Ethereum Daily Analysis: ETH Below All Daily EMAs, Lower Bollinger Band
Market Overview
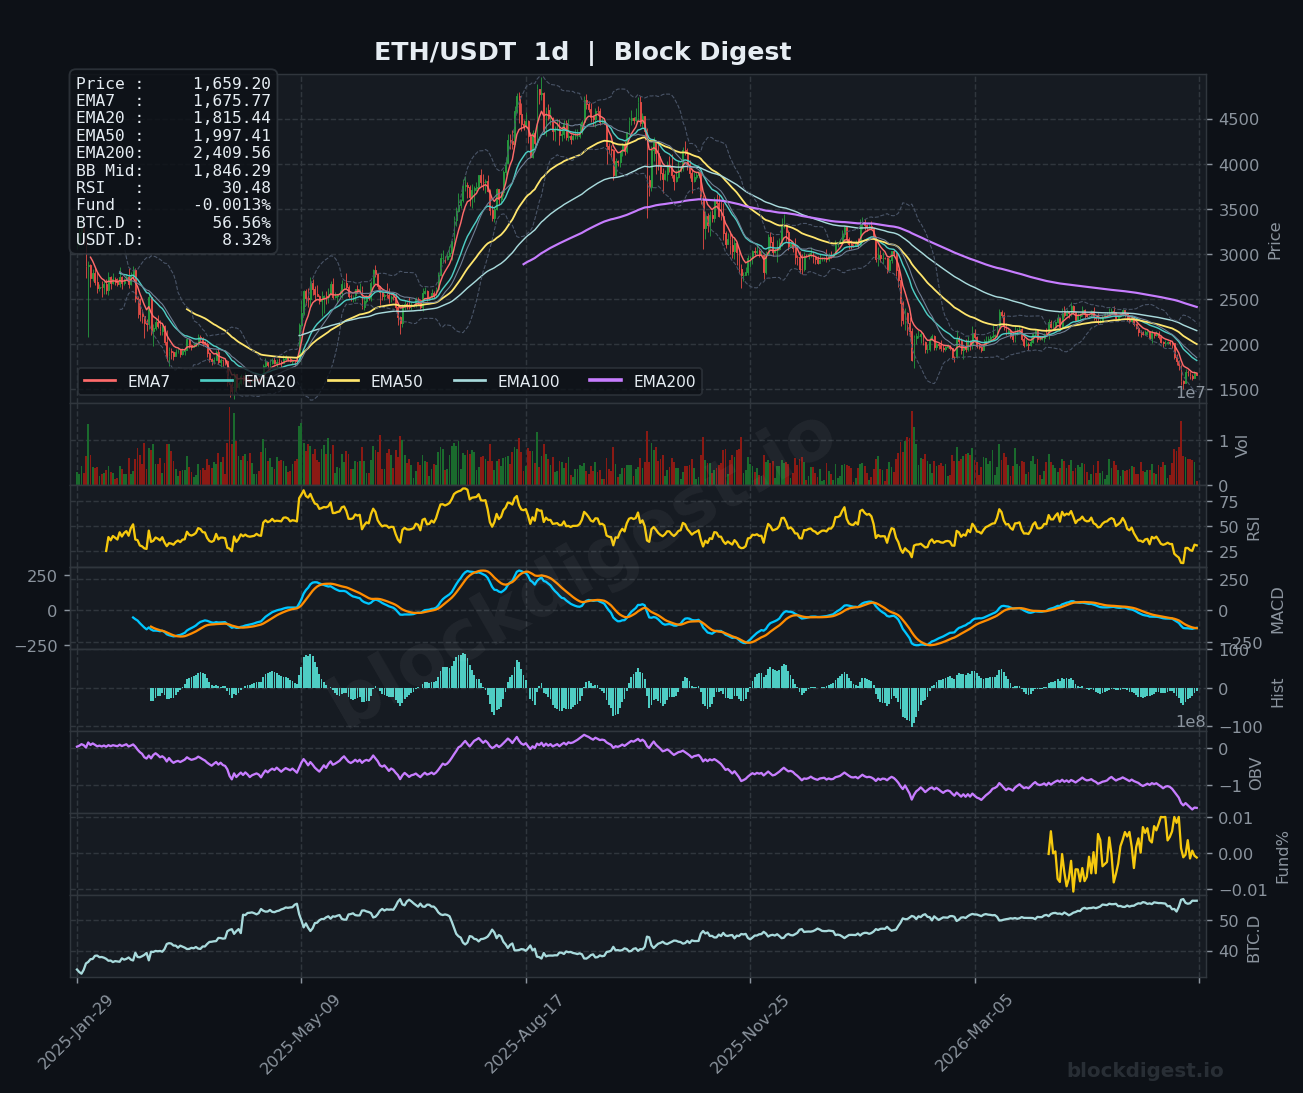
ETH/USDT is currently trading at $1,659.20, deep in bearish territory across all major timeframes. Price sits well below every significant daily EMA — the EMA7 at $1,675.77, EMA20 at $1,815.44, EMA50 at $1,997.41, and the EMA200 at $2,409.56 — painting a fully stacked bearish EMA structure on the daily chart. The Bollinger Band midline on the daily sits at $1,846.29, with price hugging the lower band, indicating sustained selling pressure with no immediate mean-reversion signal. The dominant daily trend remains firmly downward, with price having shed roughly 60% from its cycle peak near $4,500.
Multi-Timeframe Confluence
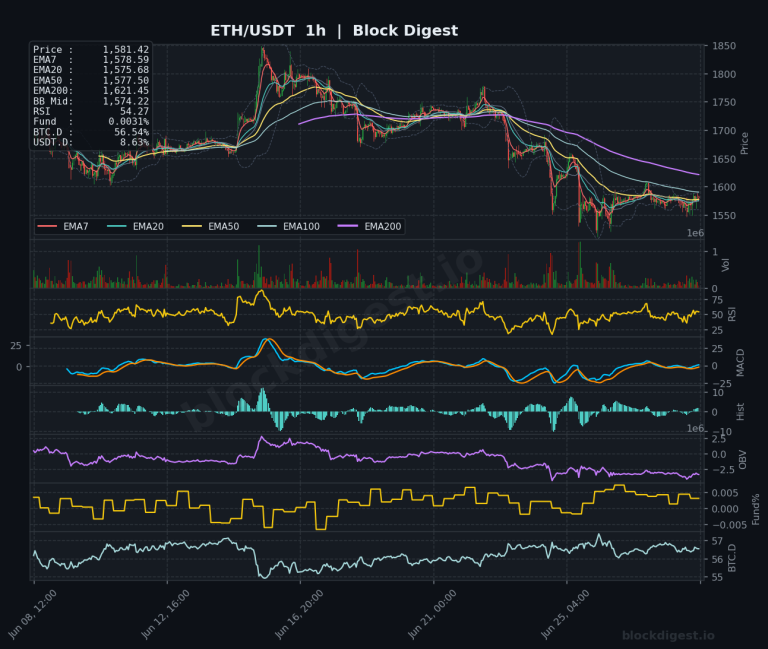
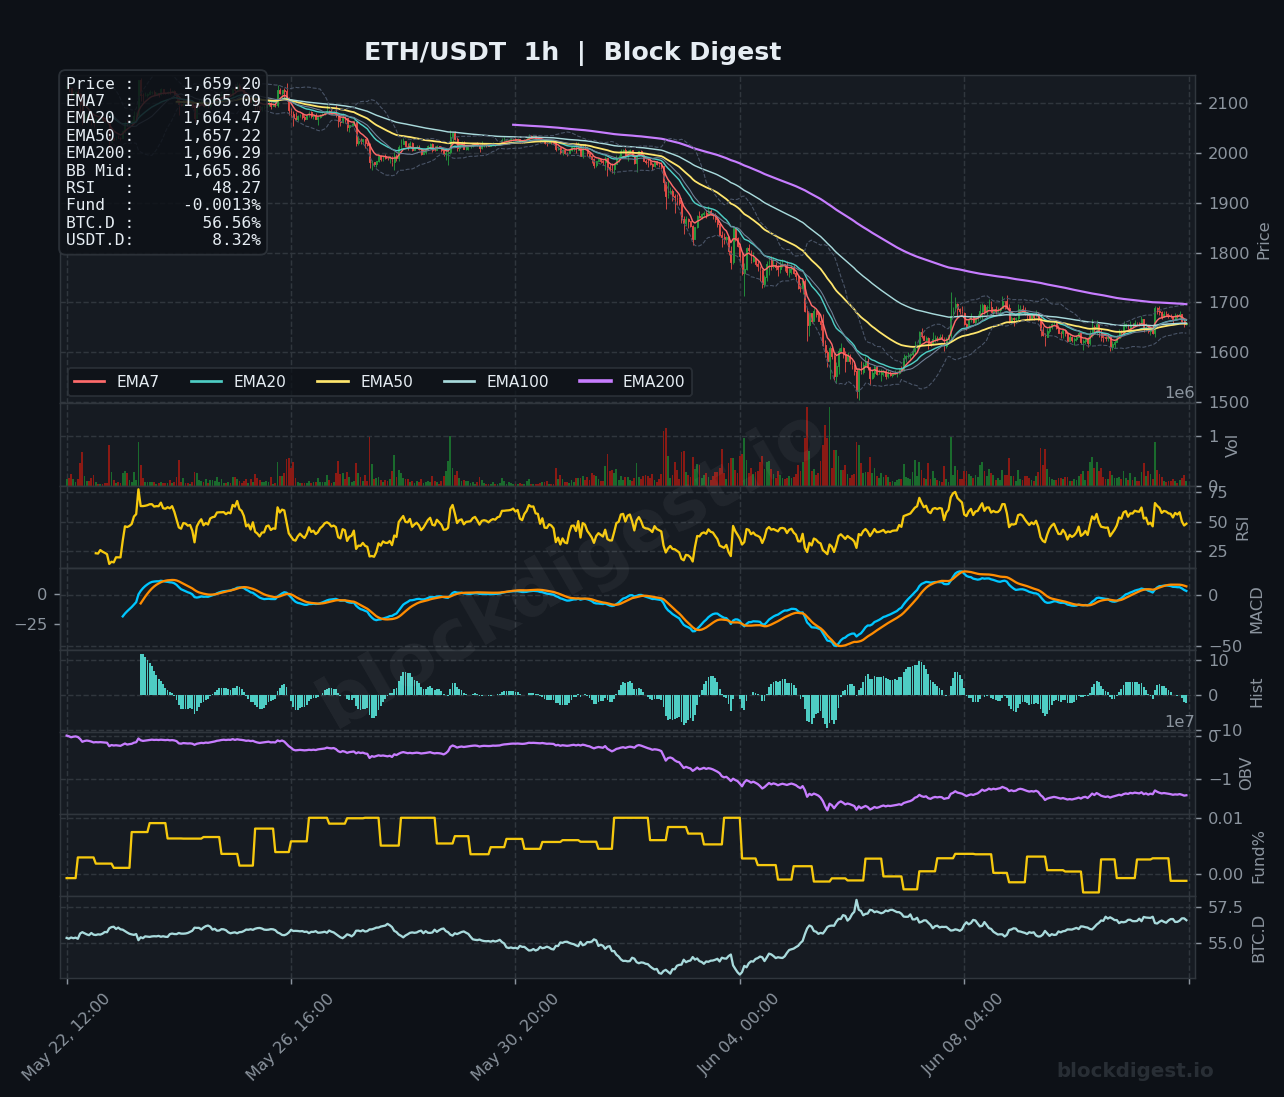
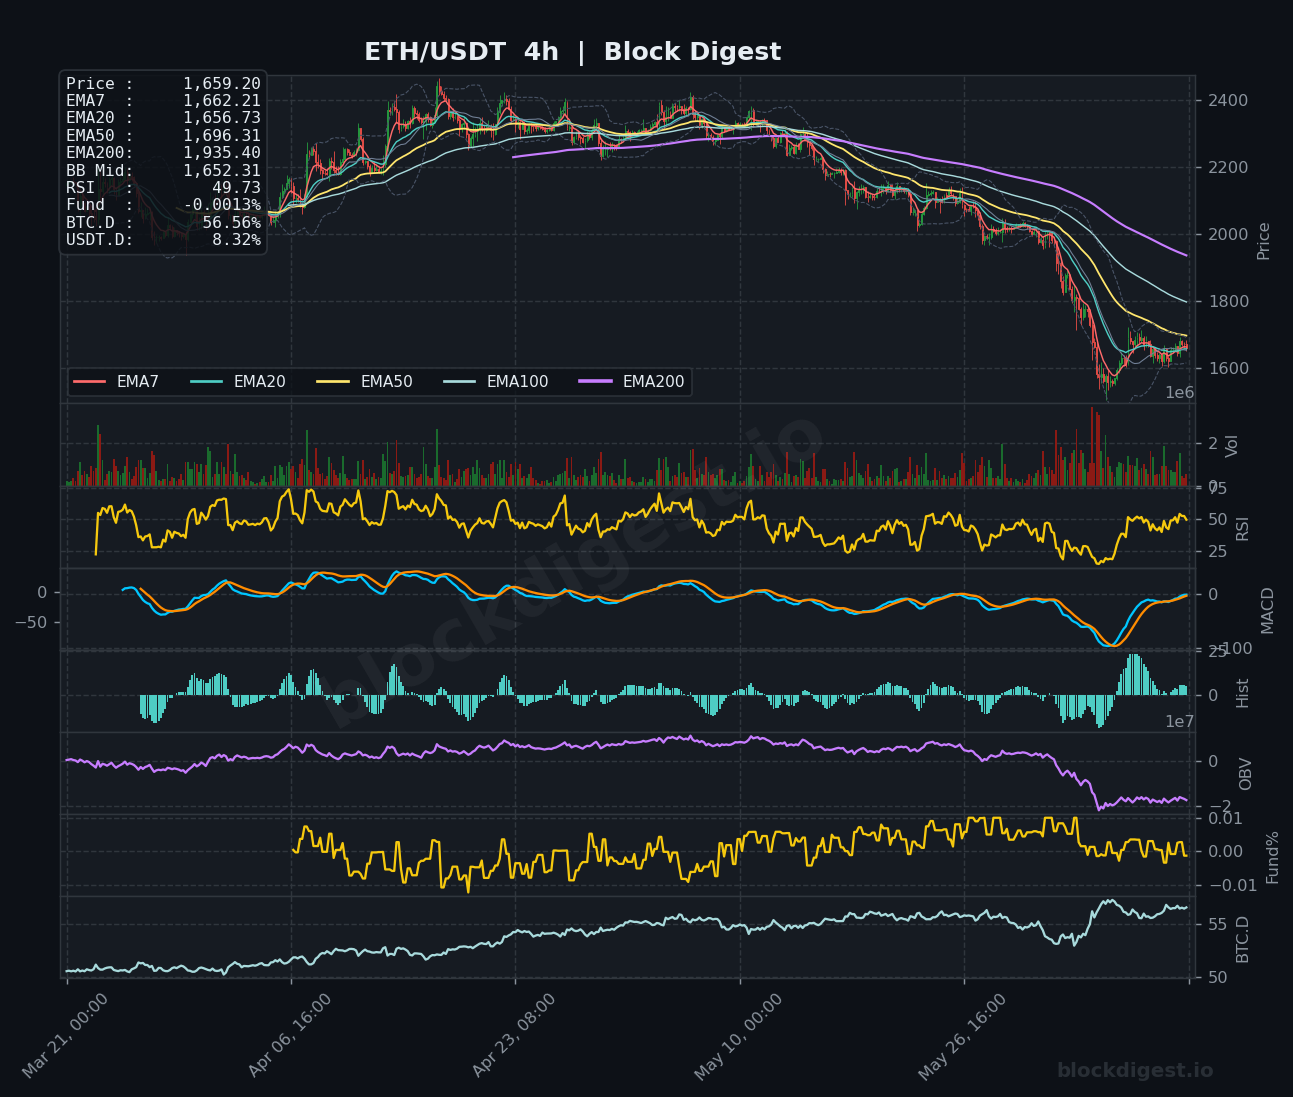
All three timeframes are aligned in a bearish configuration, with short-term price action offering only modest consolidation rather than any meaningful recovery. On the 1h chart, price is trading tightly around its EMA cluster ($1,657–$1,665), suggesting short-term indecision after a sharp decline, while the 4h EMA200 at $1,935.40 sits roughly $275 above current price — a formidable overhead barrier. The 4h Bollinger Band midline at $1,652.31 is being tested from above, meaning the current bounce is fragile at best. There is no bullish EMA crossover signal on any timeframe, and the absence of higher timeframe support confirmation makes this consolidation look more like a bear flag than a genuine base.
Key Levels to Watch
- Resistance: $1,696 — the 1h EMA200, the nearest dynamic resistance that capped prior recovery attempts and would need to be reclaimed to signal any short-term trend shift
- Resistance: $1,815 — the daily EMA20, a critical structural level that has acted as resistance throughout the recent downtrend and represents the minimum threshold for a medium-term recovery narrative
- Resistance: $1,997 — the daily EMA50, a major confluence zone where any rally would likely face substantial sell pressure from overhead supply
- Support: $1,620–$1,630 — the recent swing low and lower Bollinger Band boundary on the 1h chart; a decisive break here would accelerate selling
- Support: $1,550 — a key psychological and historical demand zone that could act as the next major line of defense if current consolidation fails
- Support: $1,480–$1,500 — deeper structural support and a multi-year demand area that would only come into play under an aggressive bearish continuation scenario
Momentum & On-Chain Signals
The daily RSI at 30.48 is approaching oversold territory but has not yet confirmed a reversal, historically a dangerous zone that can remain suppressed during extended downtrends. On the 1h and 4h timeframes, RSI readings of 48.27 and 49.73 respectively reflect neutral-to-slightly-bearish momentum, consistent with a weak consolidation rather than a bullish impulse. The MACD on both the 1h and 4h charts shows the signal and MACD lines converging near zero with marginally positive histograms, suggesting momentum exhaustion rather than a confirmed bullish crossover. OBV across all timeframes continues to trend downward, confirming that volume is firmly on the sell side and that no meaningful accumulation has emerged at current levels.
BTC Dominance & Market Sentiment
BTC dominance currently reads at 56.56%, a multi-year high that reflects capital consolidation into Bitcoin at the expense of altcoins including ETH. USDT dominance at 8.32% remains elevated, signaling that a significant portion of market participants are sitting in stablecoins and risk appetite for altcoin exposure remains suppressed. For ETH specifically, a BTC.D reading above 56% historically correlates with continued underperformance relative to Bitcoin, meaning any broad market recovery may disproportionately benefit BTC before ETH.
Risk Scenarios
- Bullish case: A sustained reclaim of the 1h EMA200 at $1,696 with follow-through volume and a 4h close above $1,720 would suggest short-term momentum is shifting; this could open a move toward $1,815 as the next meaningful target. Confluence with a BTC.D pullback below 55% and improving OBV would strengthen this scenario considerably.
- Bearish case: A breakdown below the $1,620 swing low on elevated volume would confirm the consolidation as a bear flag and open downside toward $1,550 and potentially $1,480. A daily close beneath $1,600 with RSI continuing to deteriorate below 28 would be the clearest signal of further structural deterioration.
Outlook
The overall bias remains cautiously bearish, with the weight of evidence — stacked bearish EMAs, declining OBV, elevated BTC dominance, and a daily RSI approaching but not yet confirming oversold exhaustion — pointing toward continued downside pressure or range-bound chop at best. The key trigger to watch over the next 24–48 hours is whether ETH can convincingly reclaim the 1h EMA200 at $1,696; failure to do so keeps the path of least resistance pointing lower. A daily close below $1,620 would be the decisive level that invalidates any near-term recovery thesis. Until BTC dominance shows signs of rolling over and OBV begins to flatten or rise, any relief rallies should be treated as selling opportunities rather than trend reversals.
Disclaimer: This analysis is for informational purposes only and does not constitute financial advice. Cryptocurrency markets are highly volatile and unpredictable. All trading decisions should be made based on your own research and risk tolerance. Block Digest is not responsible for any financial losses incurred as a result of acting on this content.