Altcoin Daily Analysis: Bitcoin Dominance 55.68% as Altcoins Face Pressure
Market Context
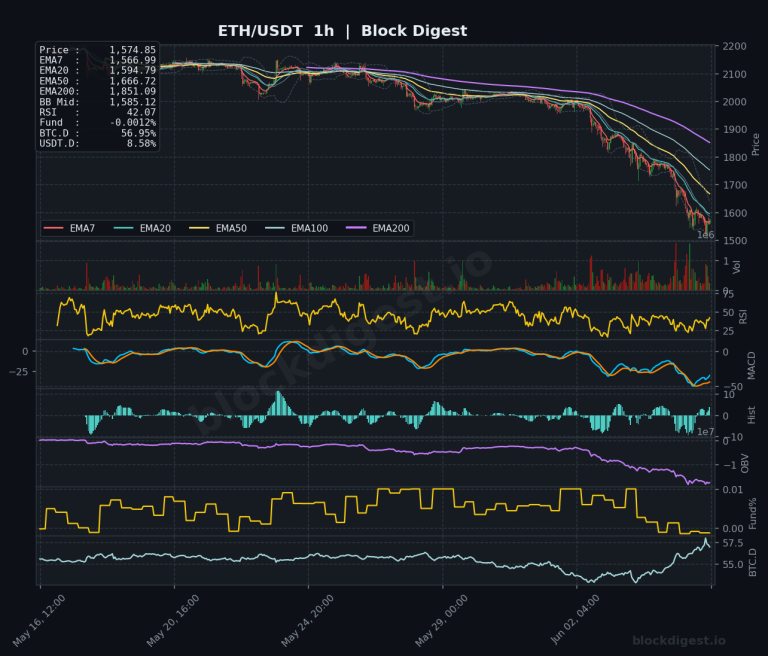
Bitcoin dominance sits at approximately 55.68% as of June 9, 2026, reflecting persistent capital retention in BTC at the expense of the broader altcoin market, which has experienced notable downside pressure over the past several weeks. USDT dominance at 8.28% signals that a meaningful portion of market participants remain sidelined in stablecoins, indicating cautious risk appetite rather than active rotation into altcoins. Until BTC dominance begins a sustained decline and USDT.D compresses meaningfully, the macro backdrop for altcoin outperformance remains structurally challenged.
Solana (SOL)
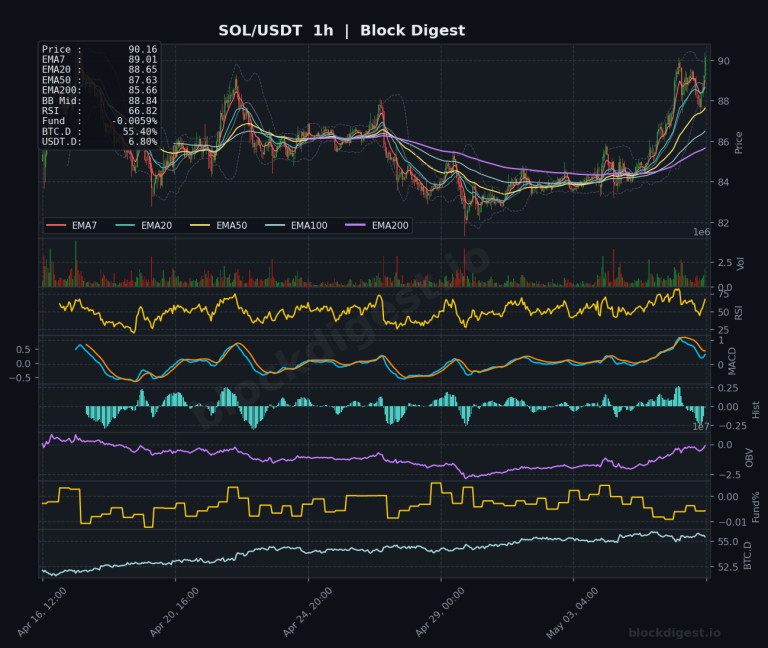
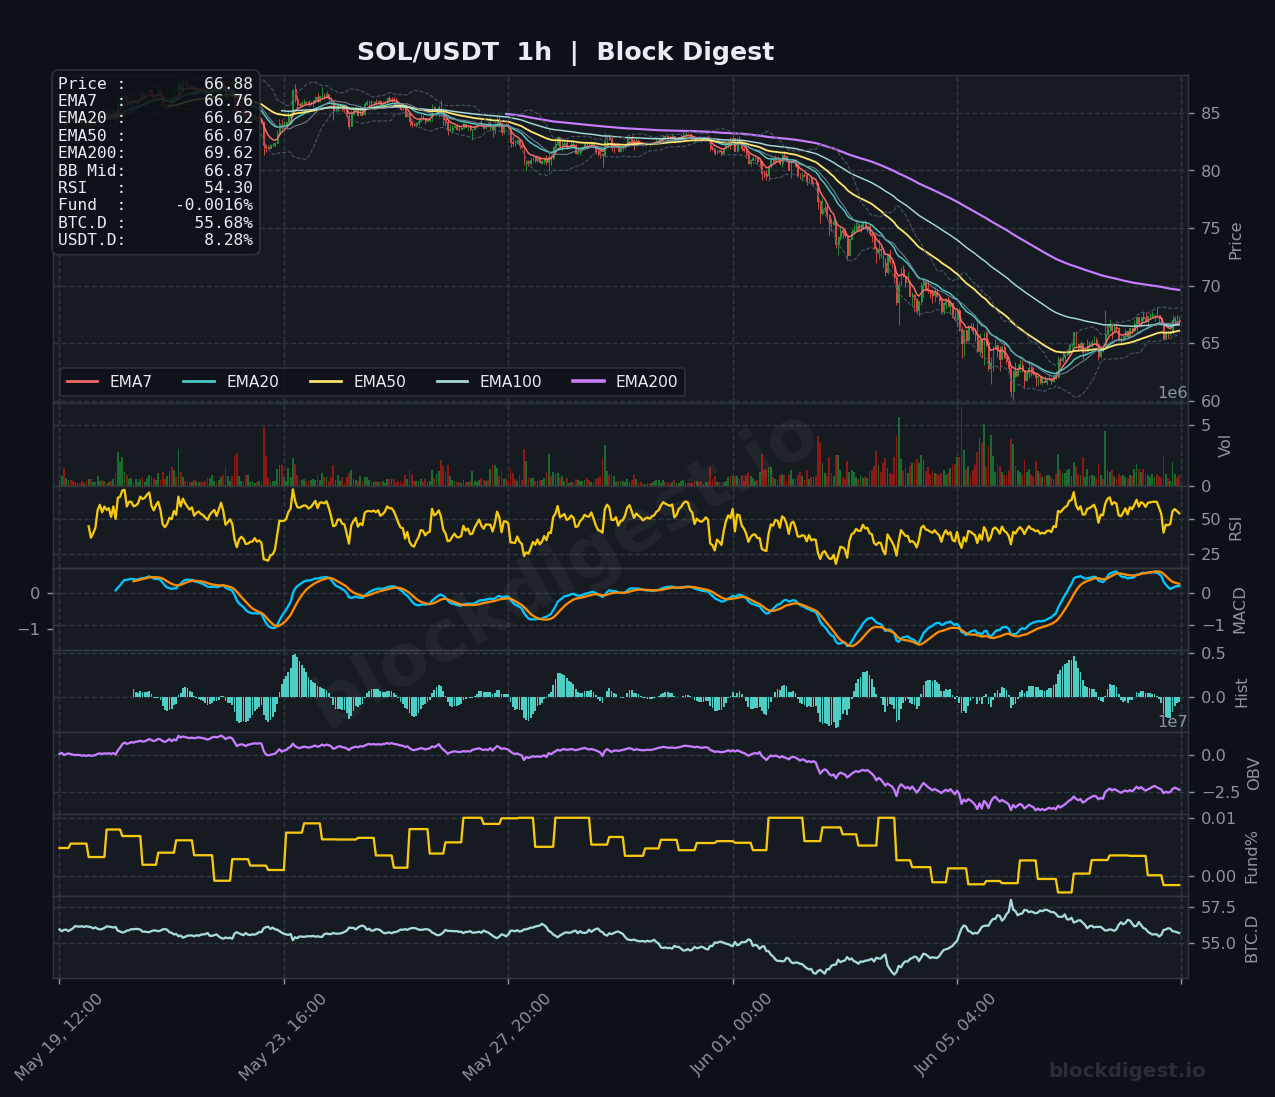
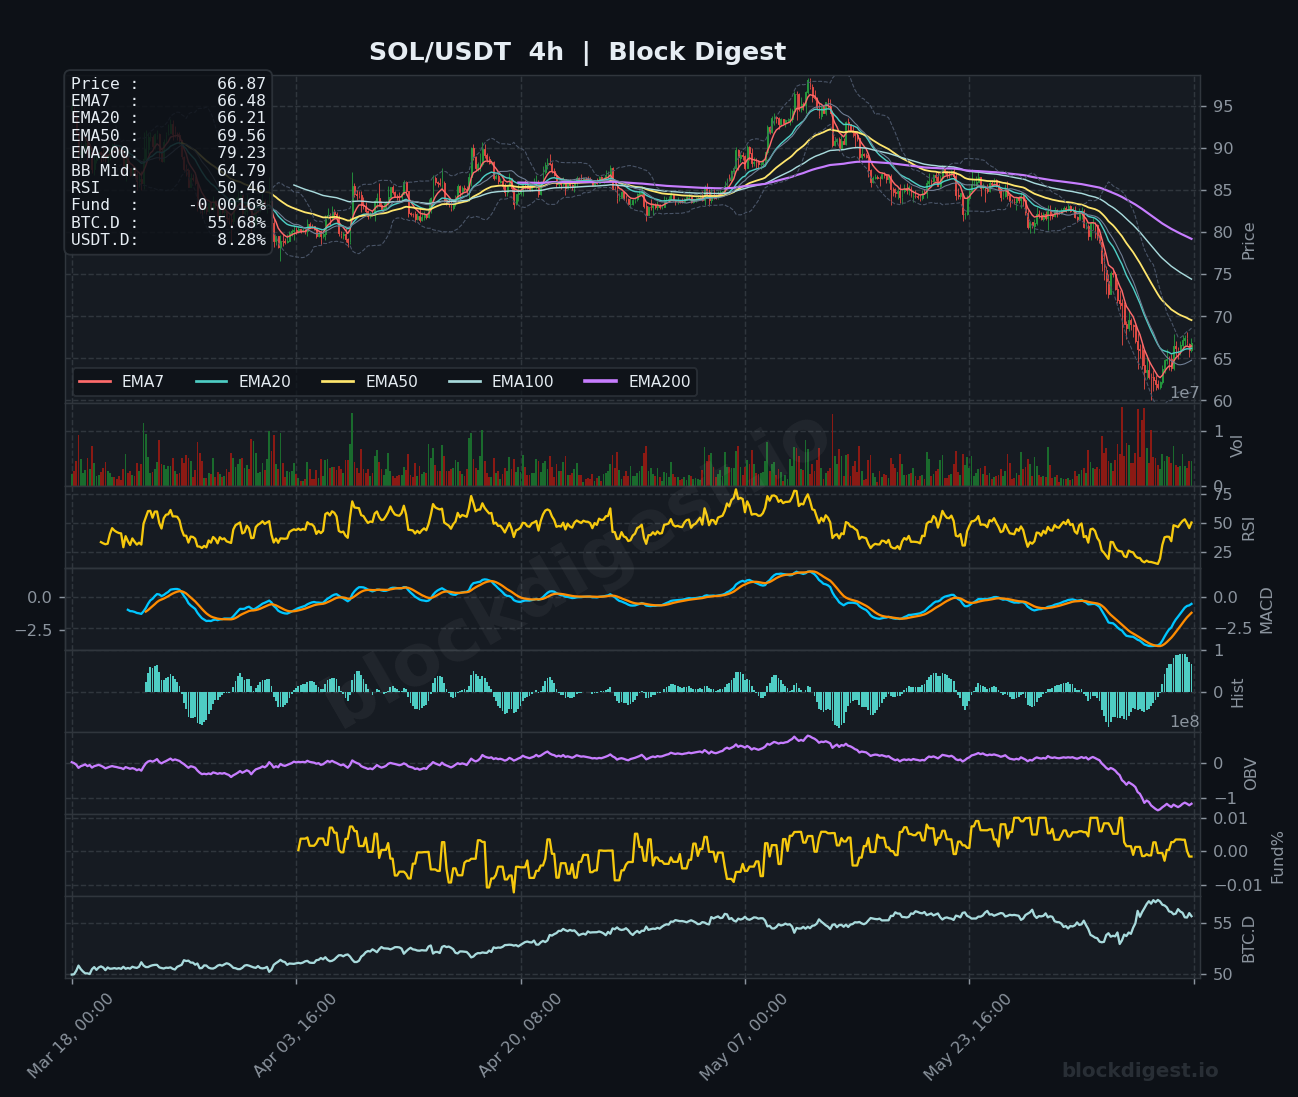
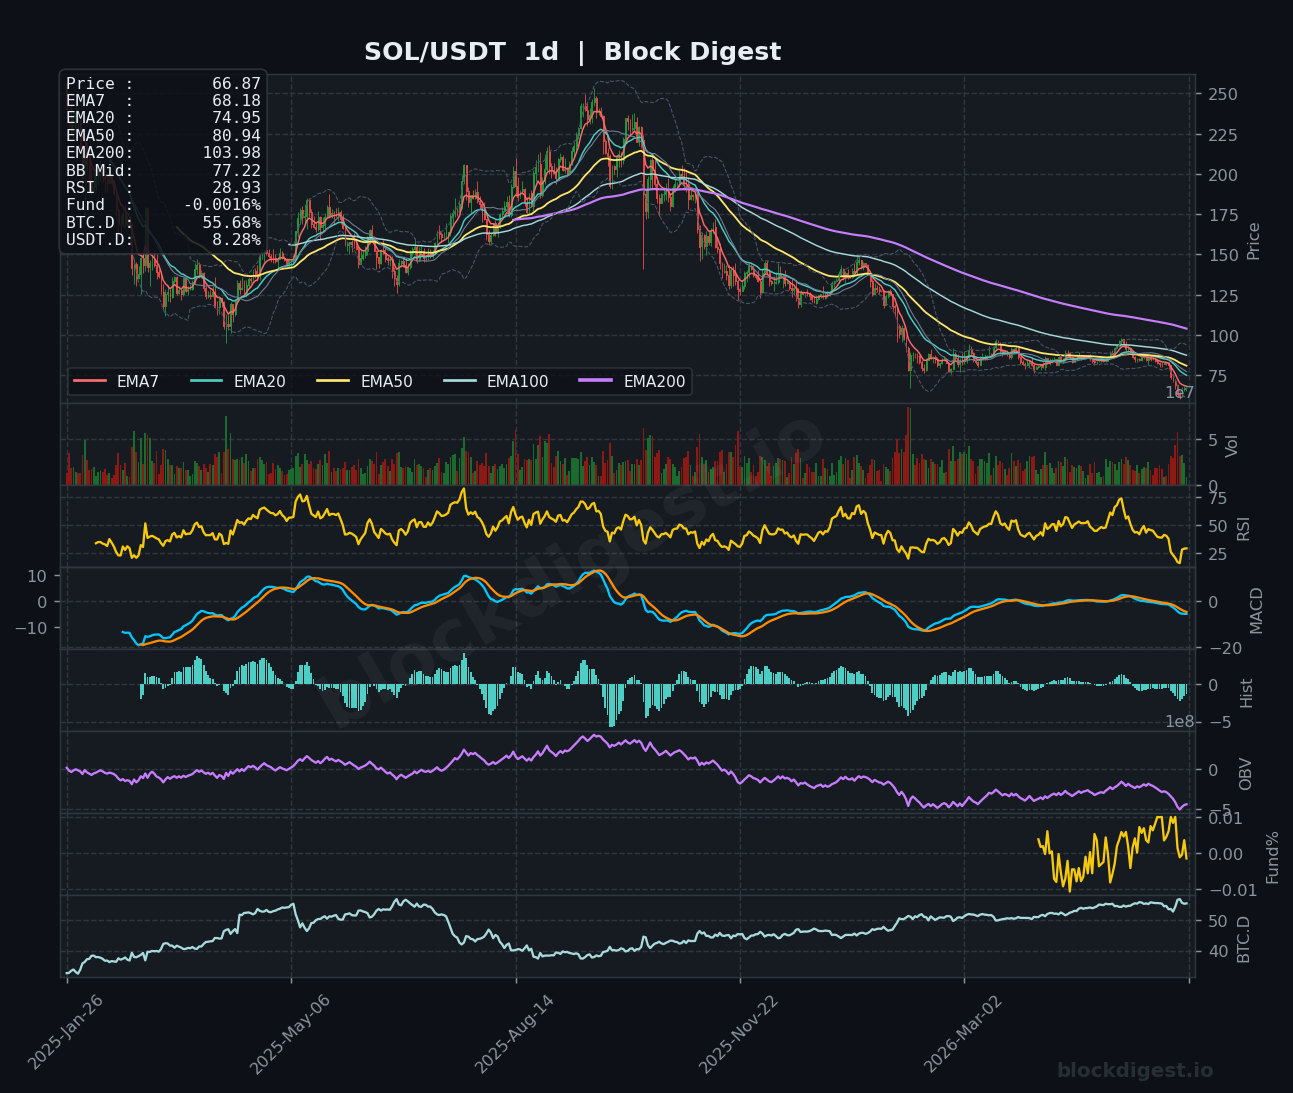
SOL is currently trading at $66.87–$66.88, attempting a modest stabilization after an extended decline from highs near $95 on the 4H chart. Price remains below all major EMAs on both the 4H and daily timeframes — the daily EMA200 sits far overhead at $103.98 — while the short-term EMAs (EMA7 at $66.76, EMA20 at $66.62) are beginning to converge just above price on the 1H, hinting at early consolidation. The daily RSI has plunged to an oversold reading of 28.93, historically a zone where at least temporary relief bounces emerge, though the 4H MACD remains in negative territory with only tentative signs of a bullish histogram turn. OBV on both the daily and 4H continues to trend downward, indicating that buying conviction has not yet returned; the short-term bias remains cautiously bearish with a watch for a bounce toward the $69–$70 resistance cluster.
XRP (XRP)
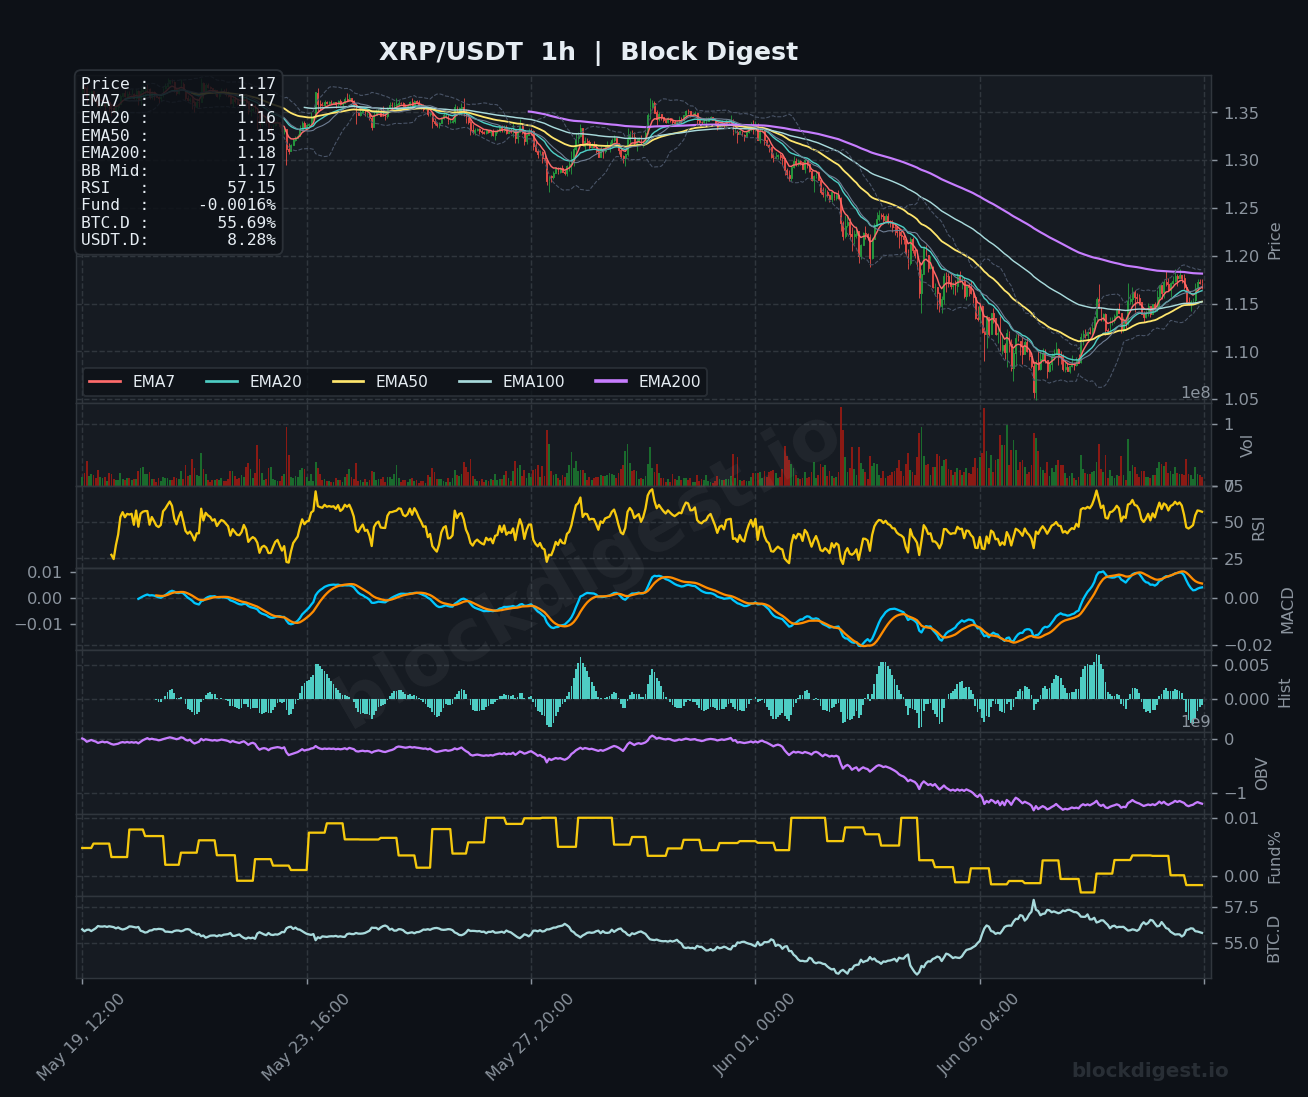
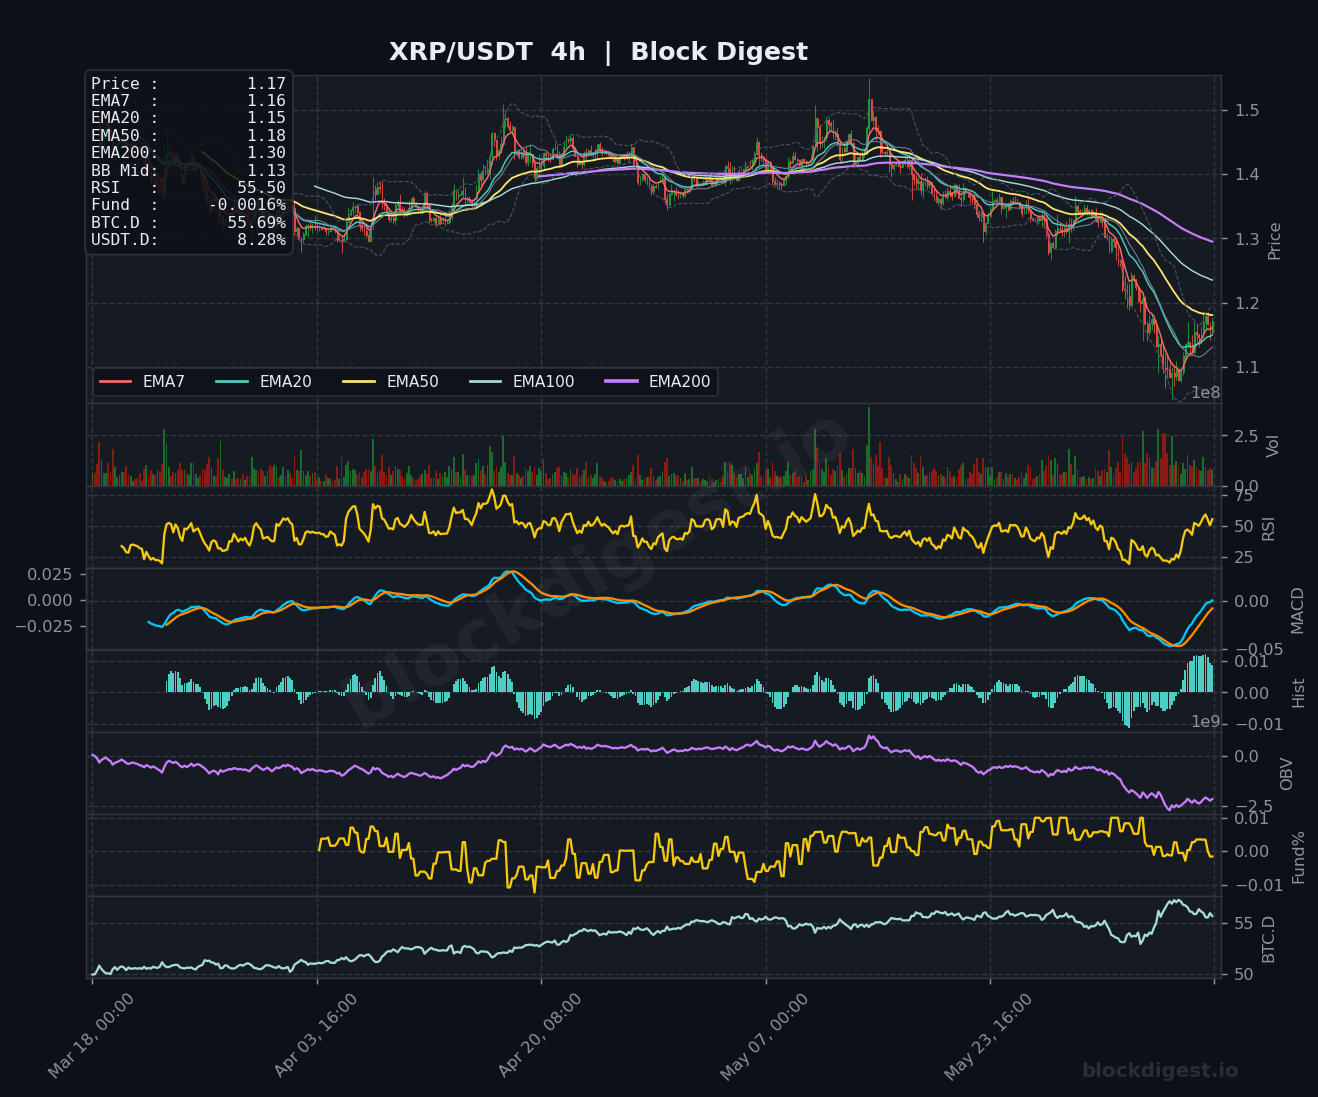
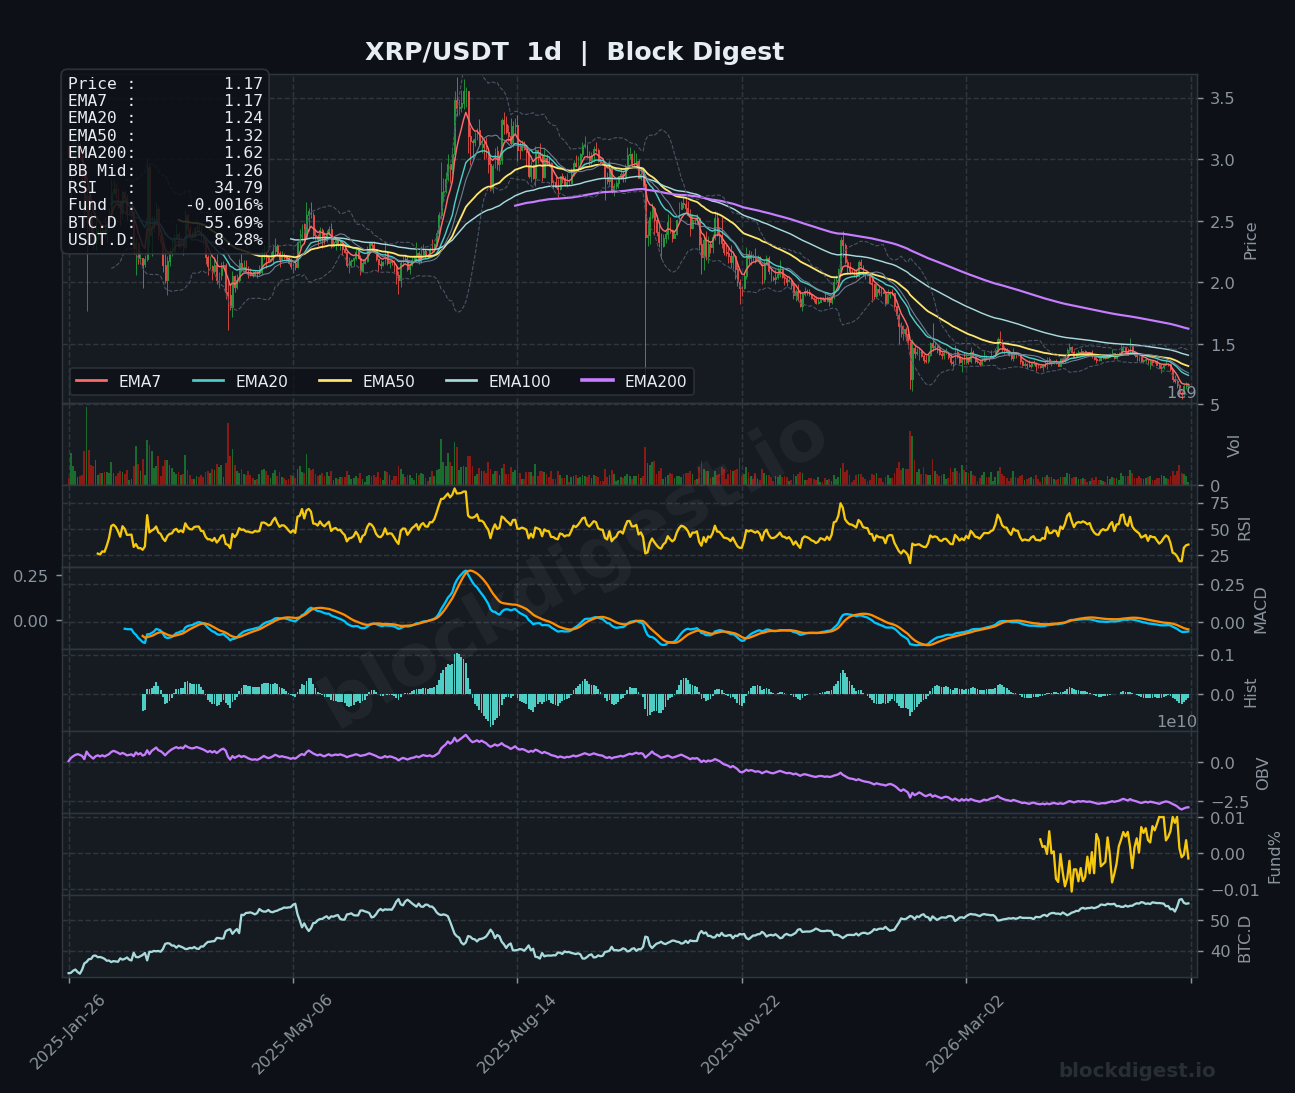
XRP is trading at $1.17, consolidating near recent lows after a sharp multi-week decline from the $1.50 area. On the 1H chart, the RSI has recovered to 57.15 and the MACD lines are crossing into positive territory, suggesting nascent short-term buying momentum; however, price remains well below the daily EMA200 at $1.62 and the daily EMA50 at $1.32, which act as formidable overhead resistance levels. The daily RSI at 34.79 shows XRP is approaching but not yet at oversold extremes, and the daily MACD histogram remains in bearish territory without a clear inflection. The 4H OBV has been in steady decline, confirming distribution pressure; a reclaim of the $1.20–$1.22 zone would be the first meaningful technical step toward a more constructive outlook, while a break below $1.10 would signal renewed downside.
BNB (BNB)
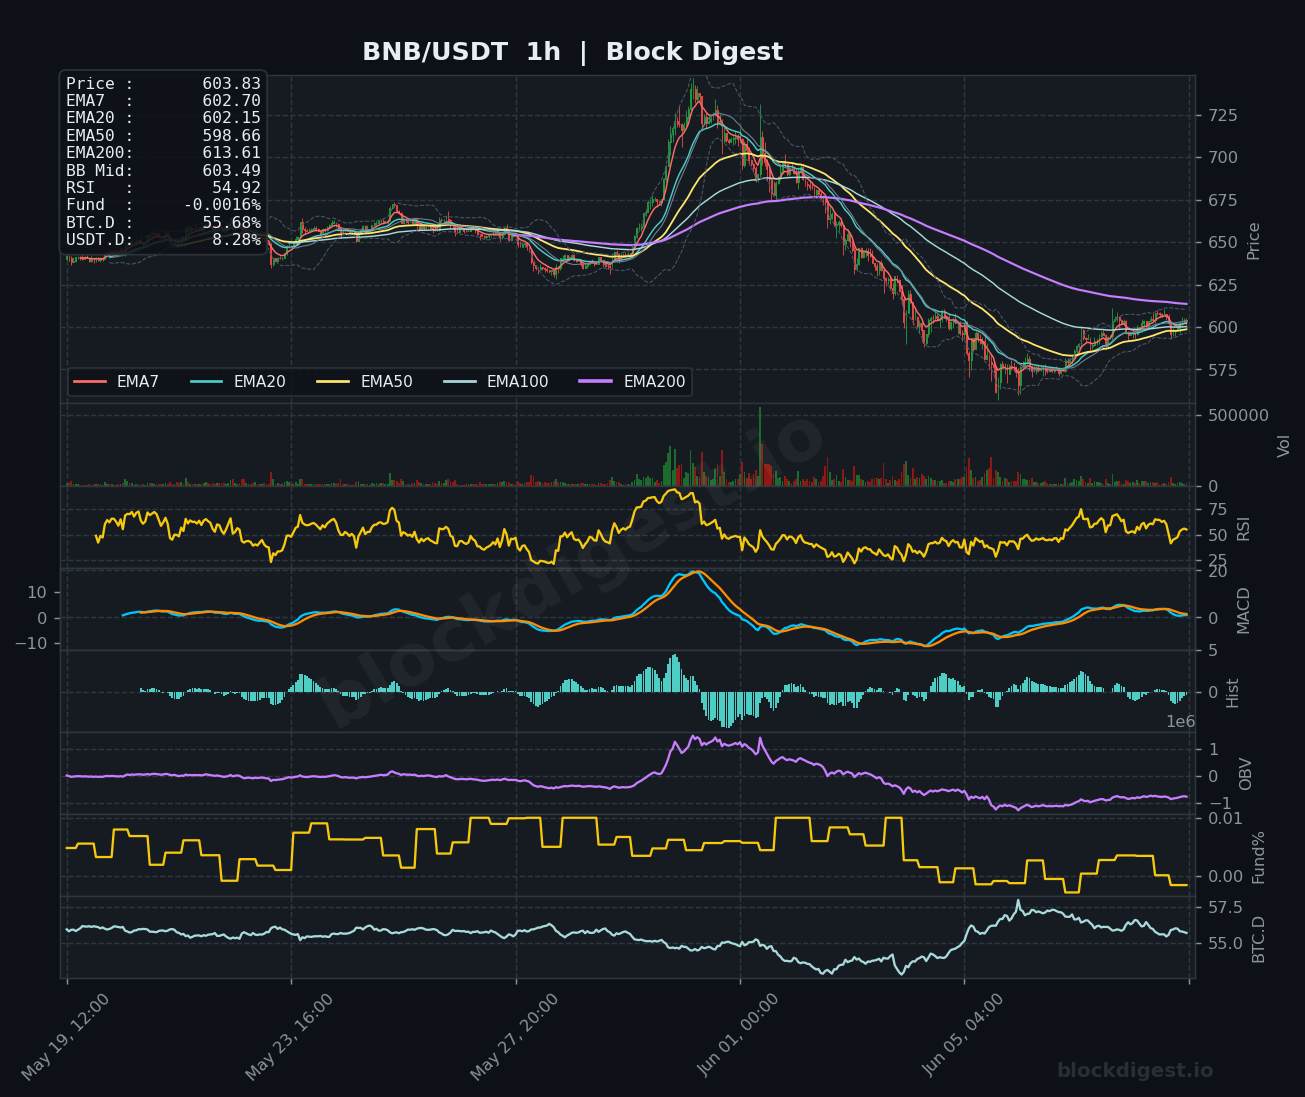
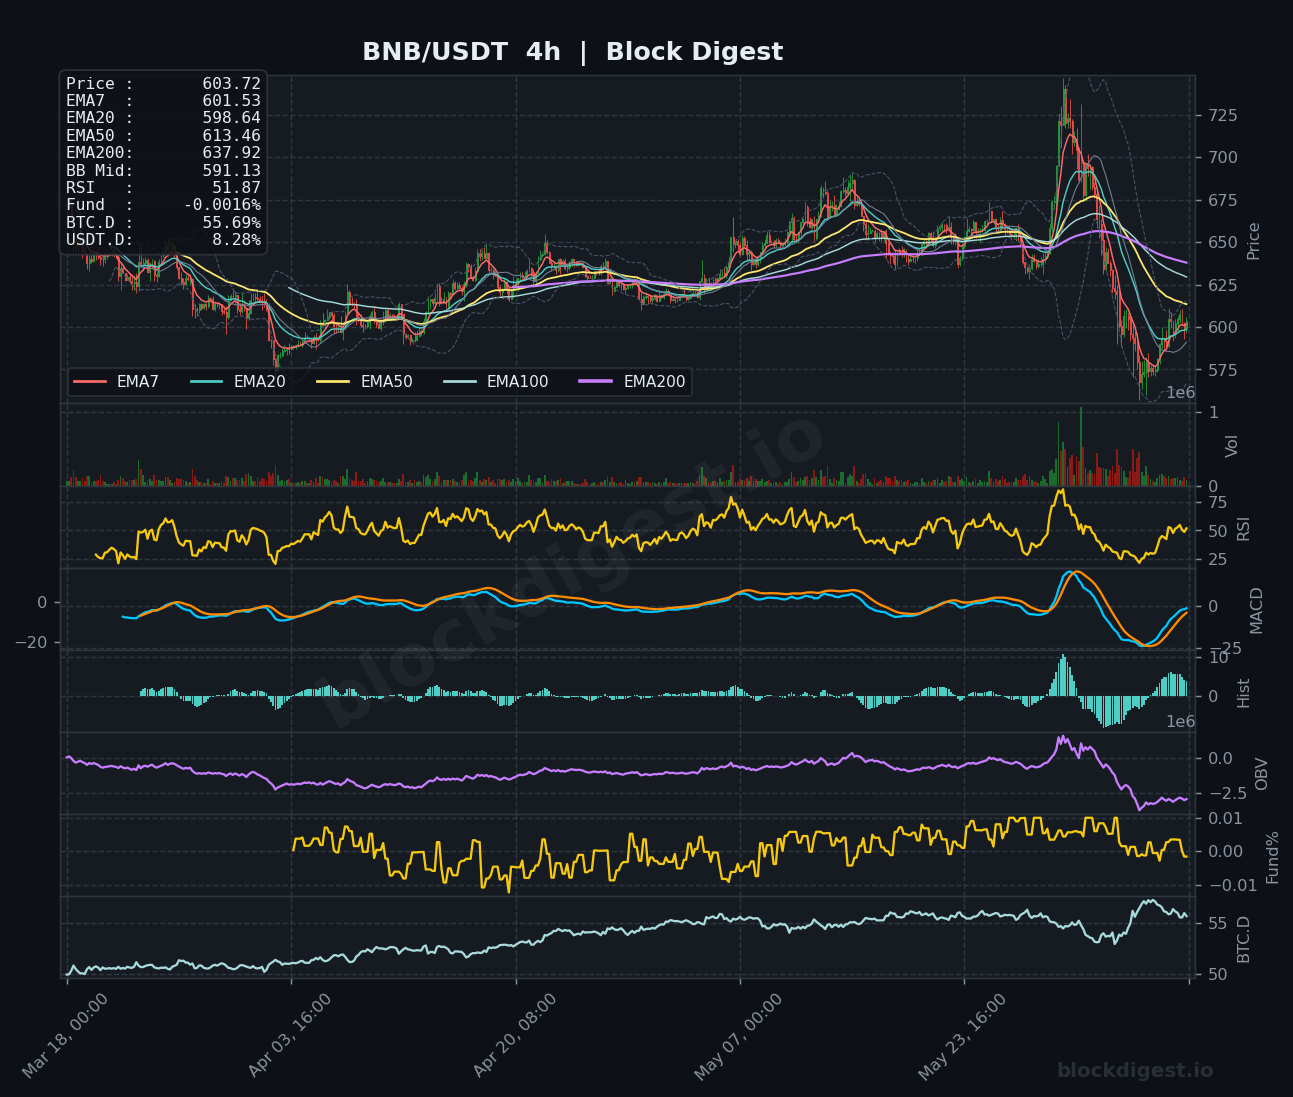
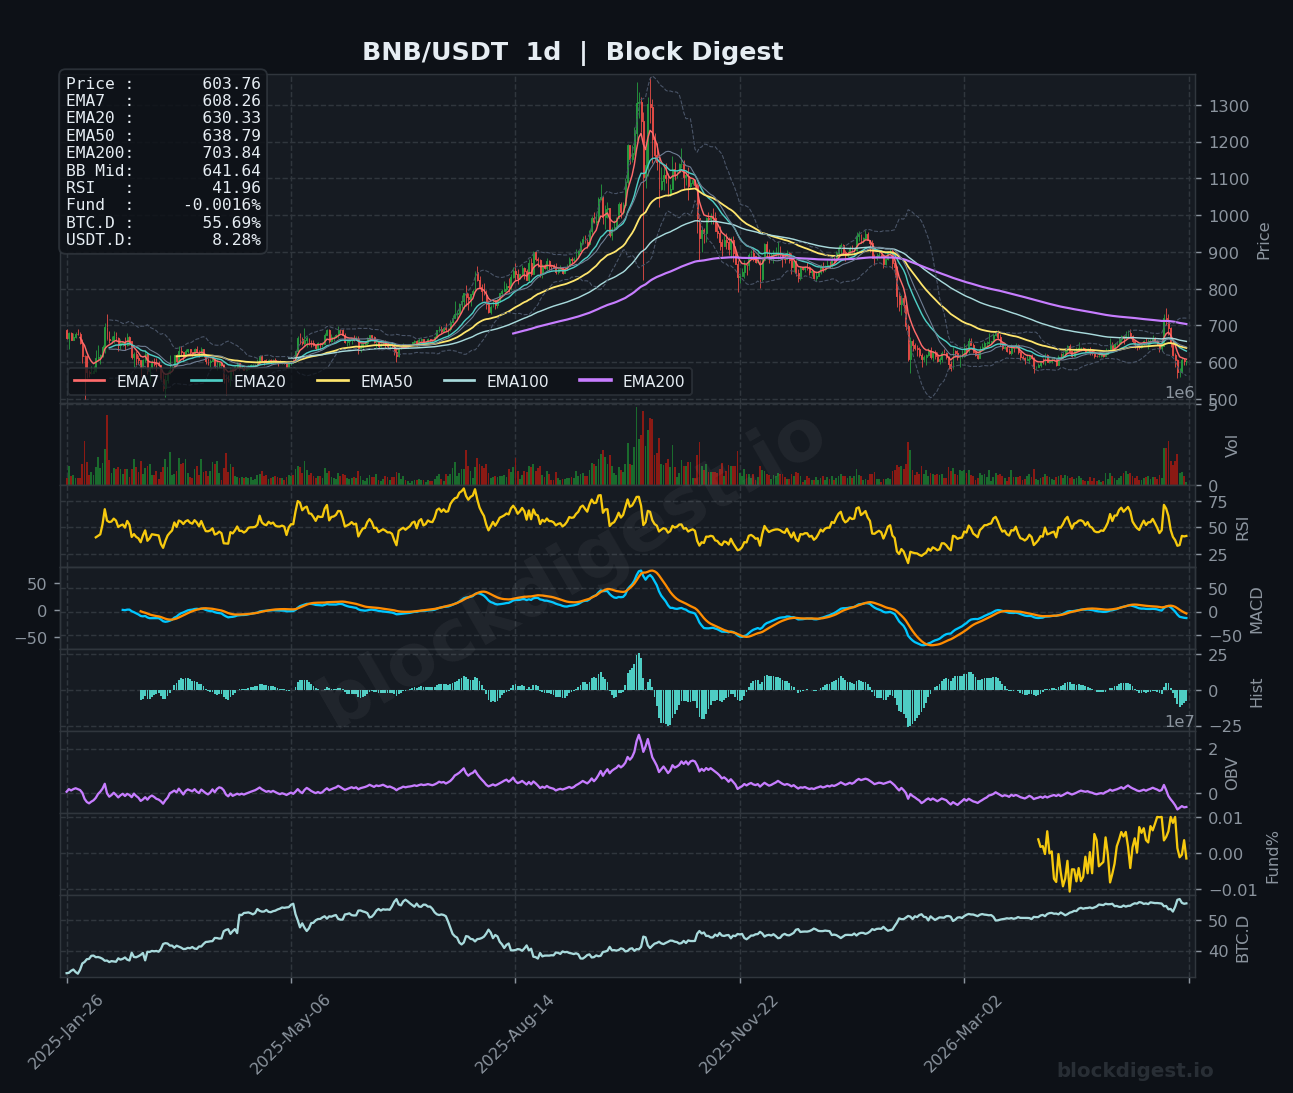
BNB is trading at approximately $603.76–$603.83, attempting to consolidate in the $590–$615 range following a sharp selloff from peaks near $730 seen on the 4H chart. The 1H EMA structure is showing early signs of compression and potential bullish alignment — EMA7 ($602.70), EMA20 ($602.15), and EMA50 ($598.66) are tightening, with the RSI at a neutral 54.92 — suggesting short-term indecision rather than sustained bearish momentum. On the daily chart, however, price remains below the EMA7 ($608.26), EMA20 ($630.33), EMA50 ($638.79), and EMA200 ($703.84), and the daily RSI at 41.96 reflects a still-bearish macro structure. BNB’s 4H MACD histogram has turned modestly positive for the first time in weeks, which is worth monitoring; the $615–$620 zone represents the immediate overhead resistance, while $575–$580 is a key support level to defend.
Dogecoin (DOGE)
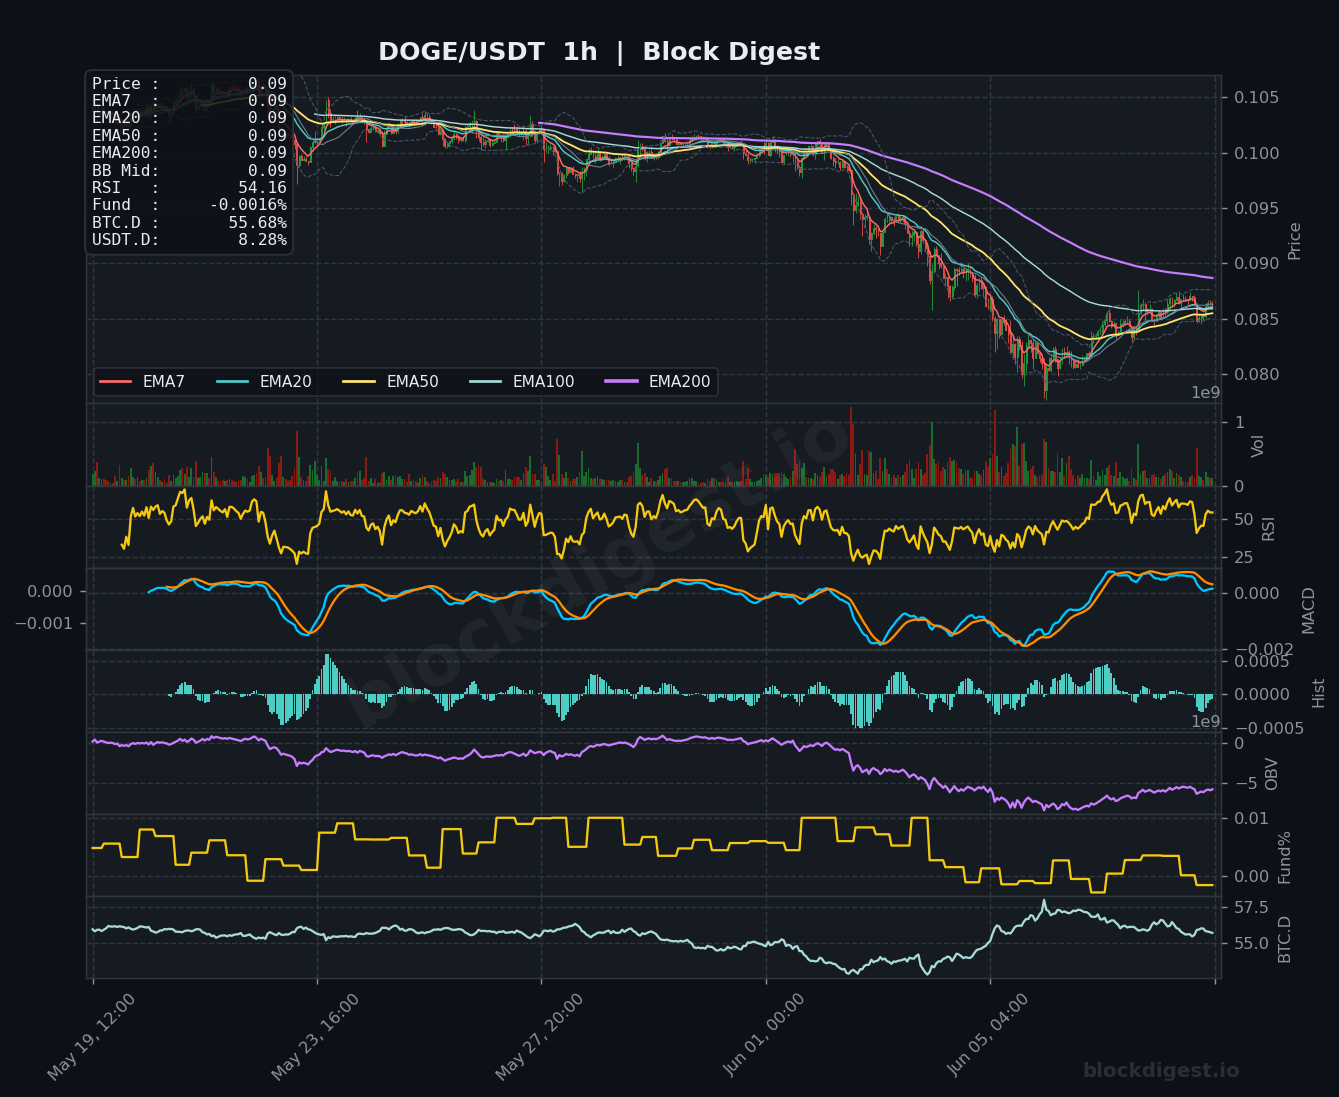
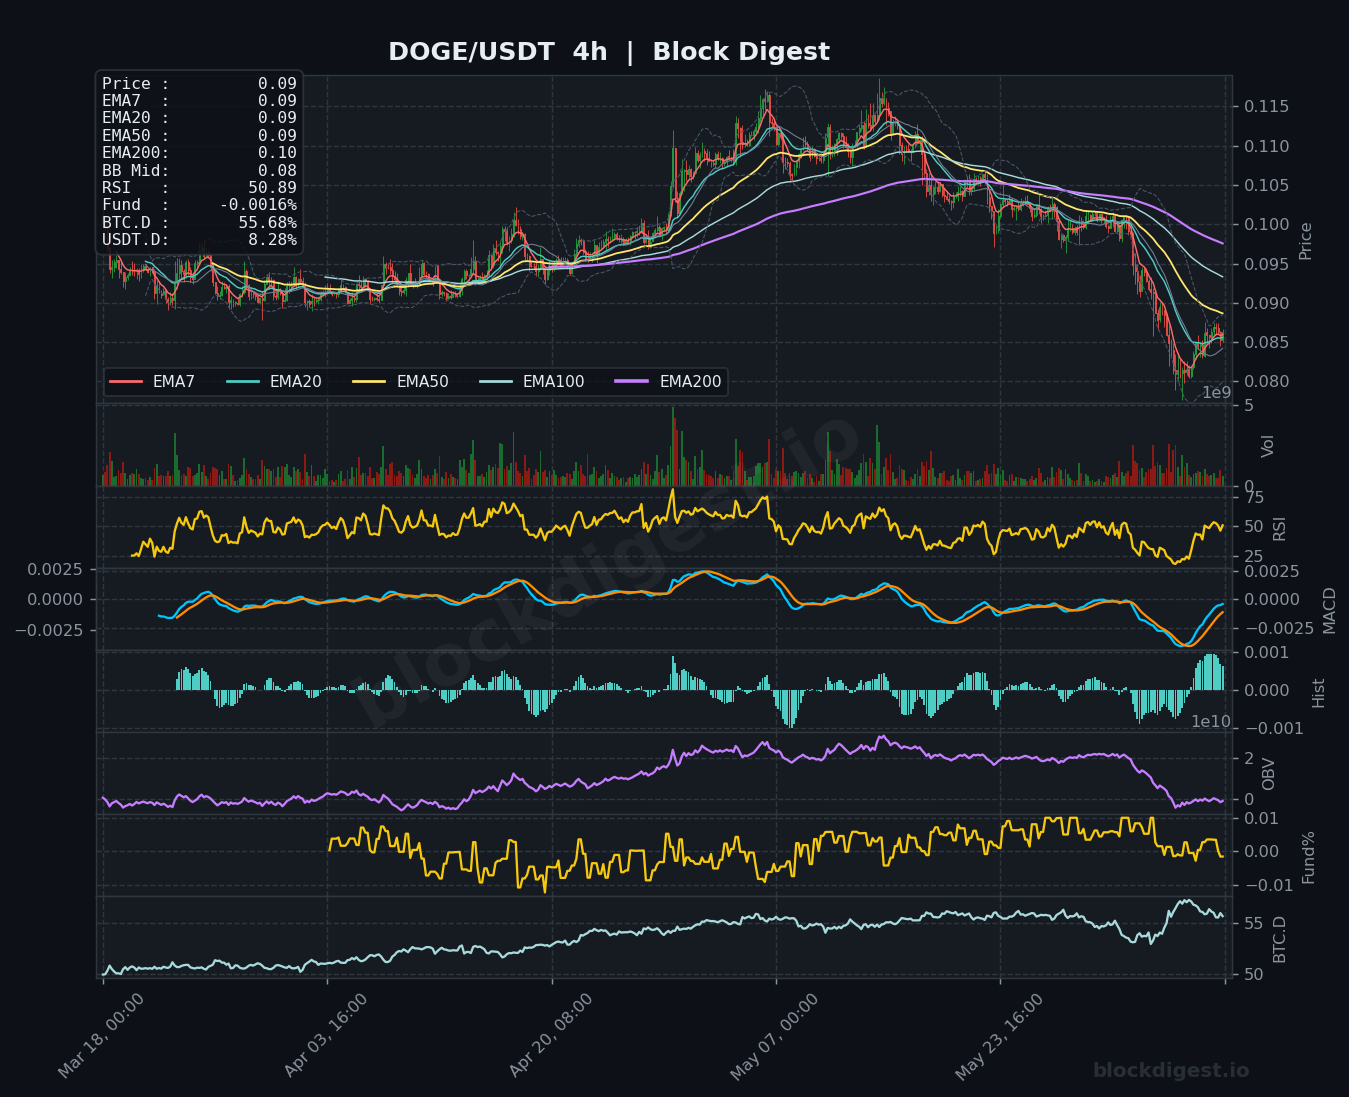
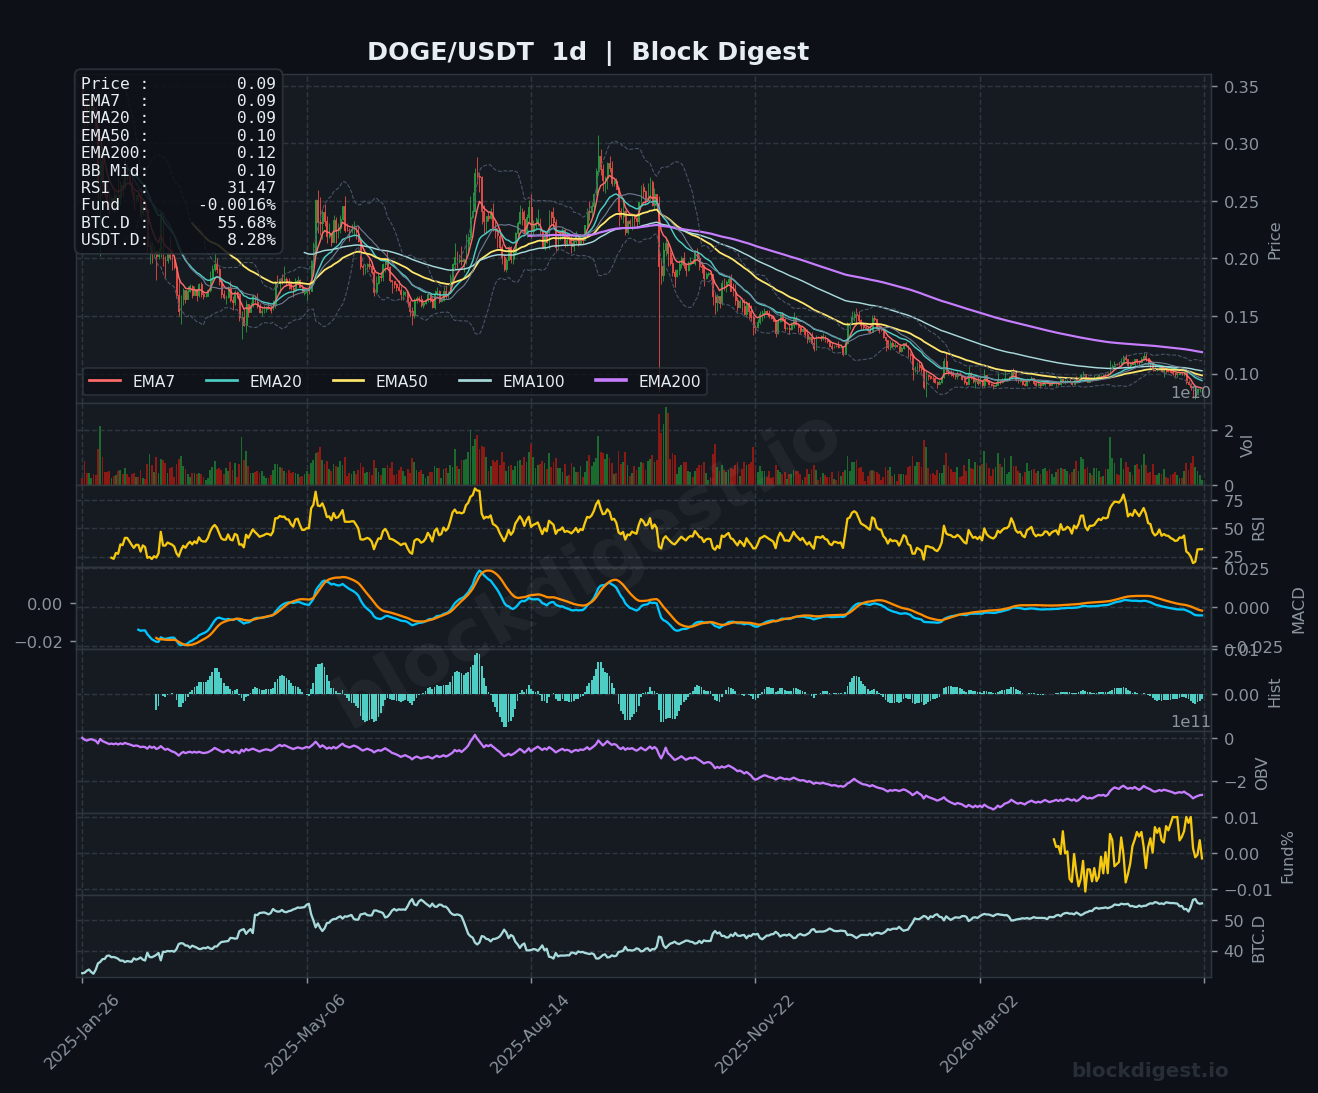
DOGE is trading at $0.09, hovering at a critical psychological and technical support level after a prolonged downtrend from highs above $0.115 on the 4H chart. The daily RSI has dropped to 31.47, nearing oversold territory, while the 1H RSI sits at a neutral 54.16, reflecting some intraday stabilization; the 4H MACD is beginning to curl slightly upward from deeply negative levels, suggesting diminishing downward momentum. All EMAs on the daily timeframe remain in a bearish cascade — EMA7 at $0.09, EMA50 at $0.10, and EMA200 at $0.12 — with price unable to reclaim any of these levels meaningfully. DOGE’s OBV on the daily has been in a protracted decline, confirming the lack of accumulation; the $0.09 level is the key support to hold, with $0.085 the next downside target if bulls fail to defend current prices.
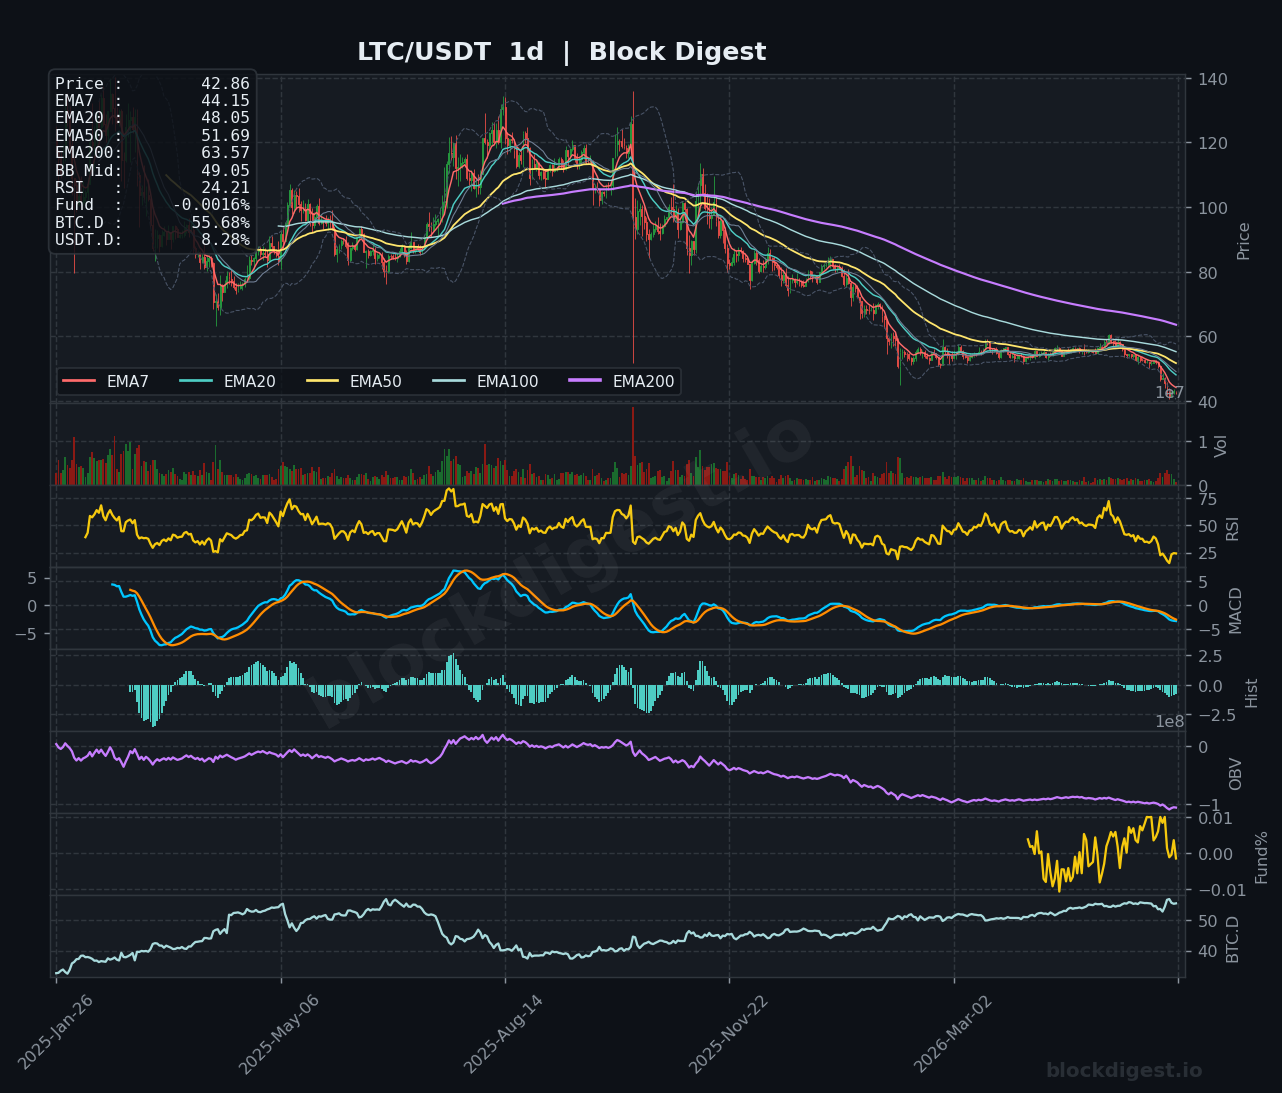
Litecoin (LTC)
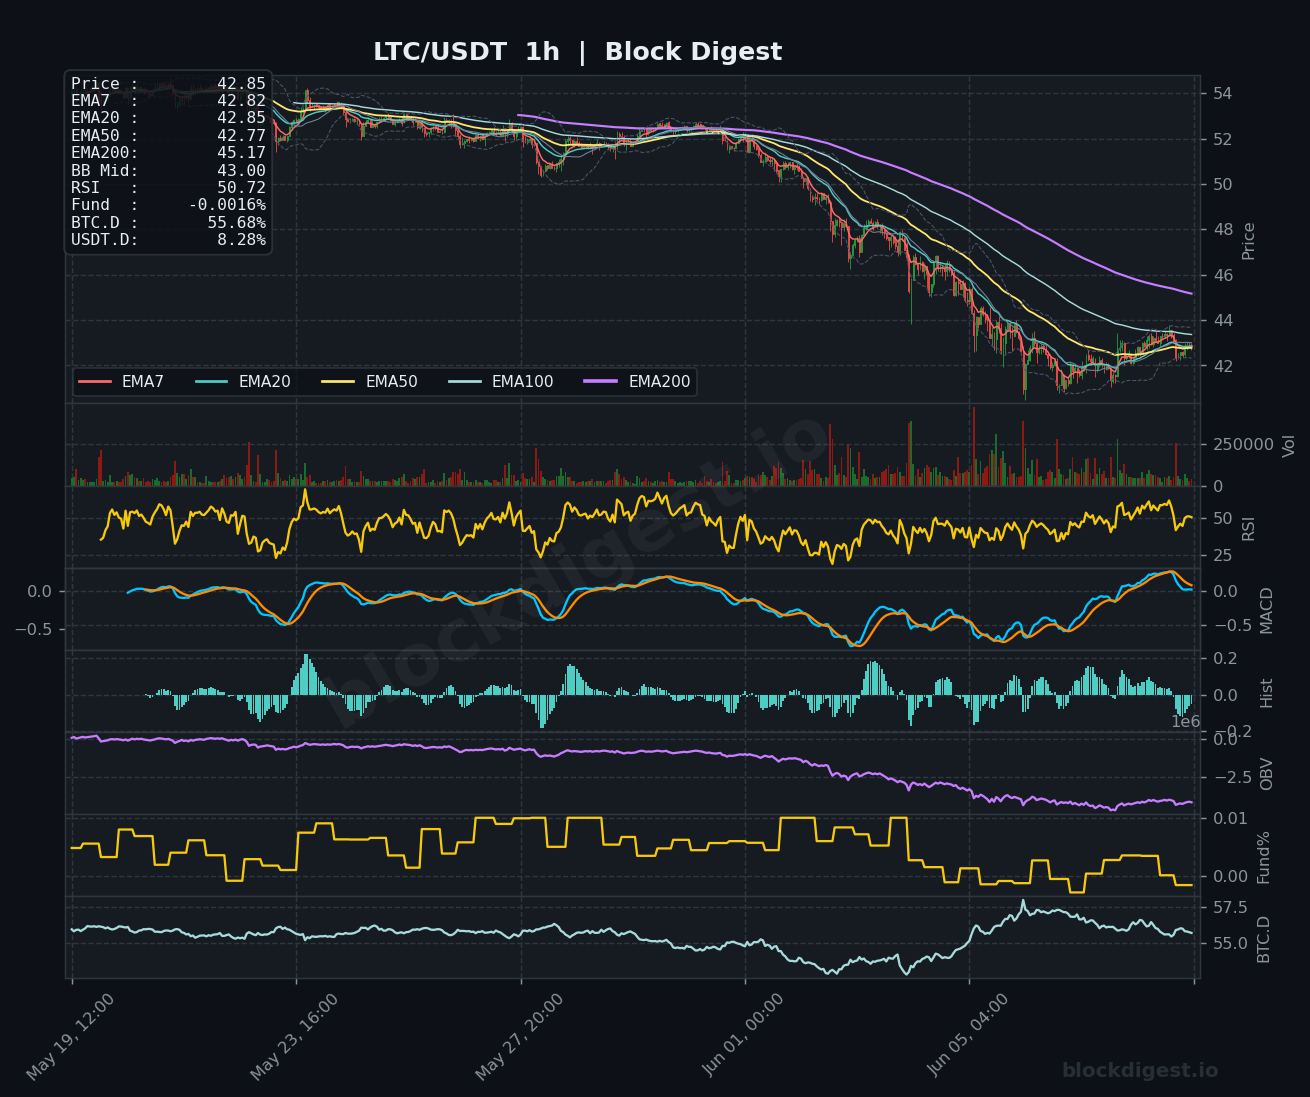
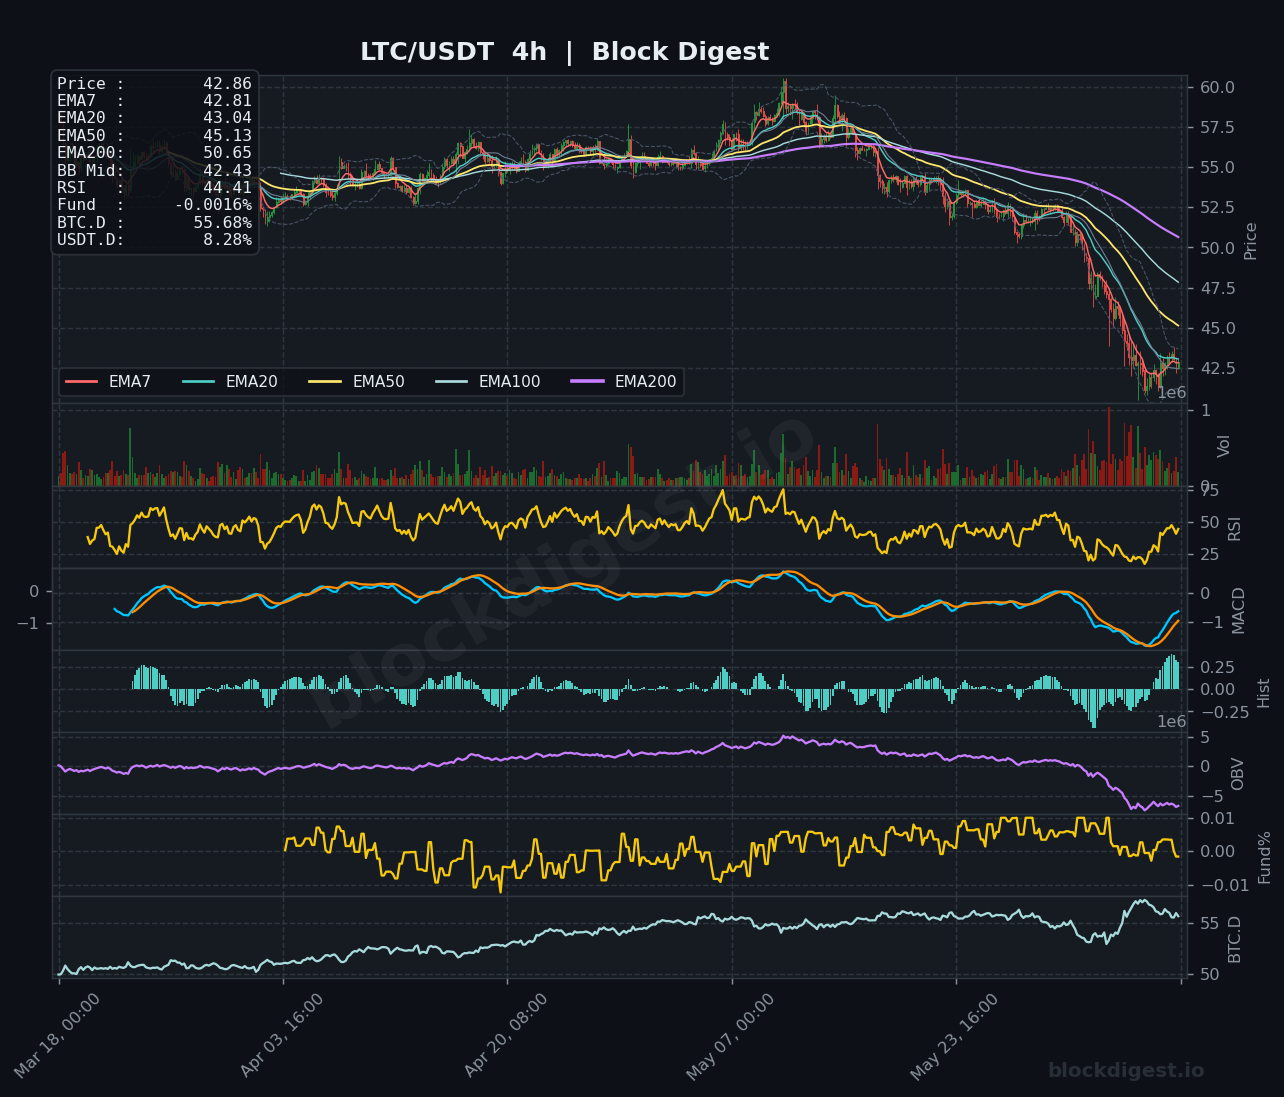
LTC is among the weakest setups in today’s review, trading at $42.85–$42.86 after a severe downtrend from the $57–$60 range visible on the 4H chart. The daily RSI has crashed to 24.21 — a deeply oversold reading — while the 4H RSI at 44.41 shows a marginal recovery from recent capitulation lows near $42; the 4H MACD histogram has flipped to positive, which may indicate a near-term relief bounce is forming. Price sits below every major daily EMA: EMA7 ($44.15), EMA20 ($48.05), EMA50 ($51.69), and EMA200 ($63.57), all sloping aggressively downward and confirming a structural bear trend. The declining OBV across all timeframes is particularly concerning; while the oversold daily RSI warrants a tactical bounce watch toward $44–$45, any recovery attempt faces heavy overhead supply and the short-to-medium term bias remains bearish.
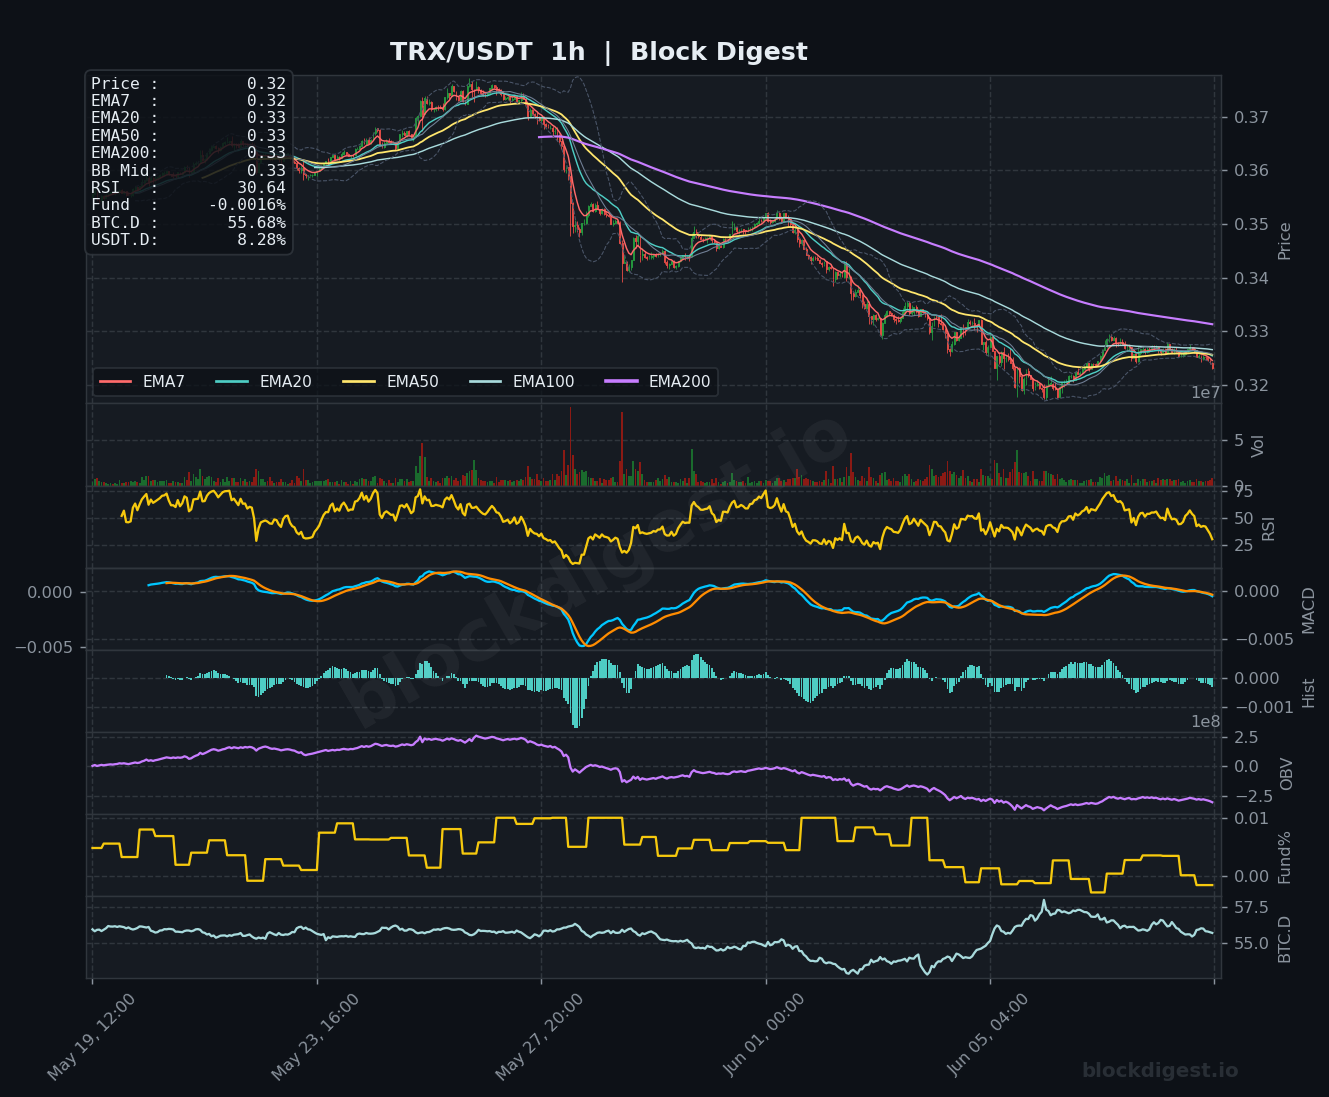
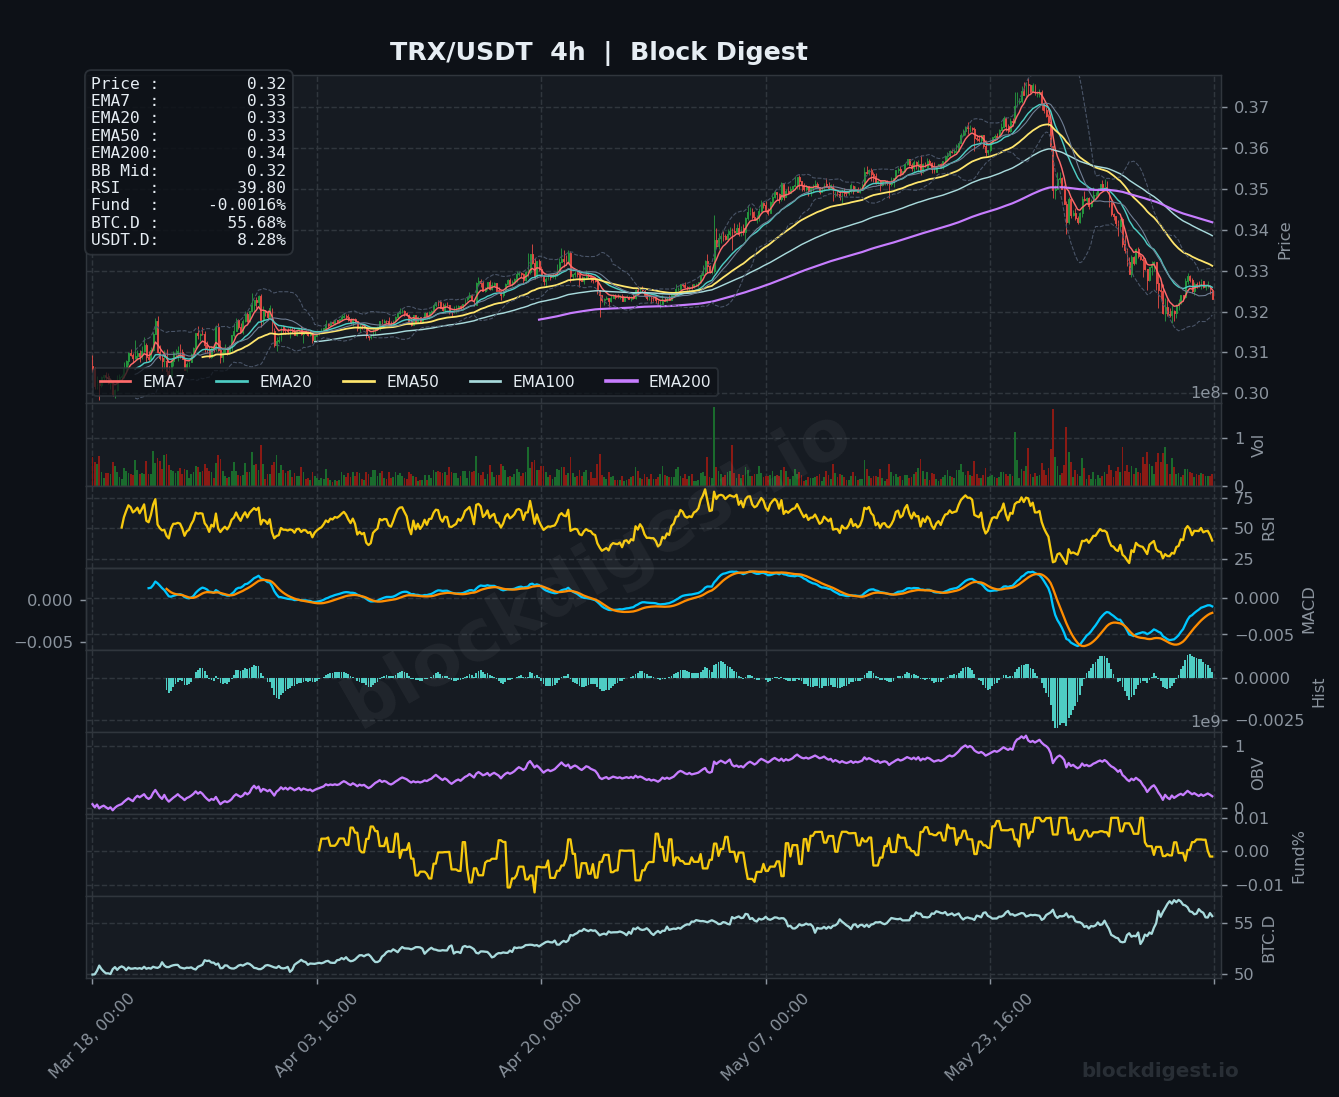
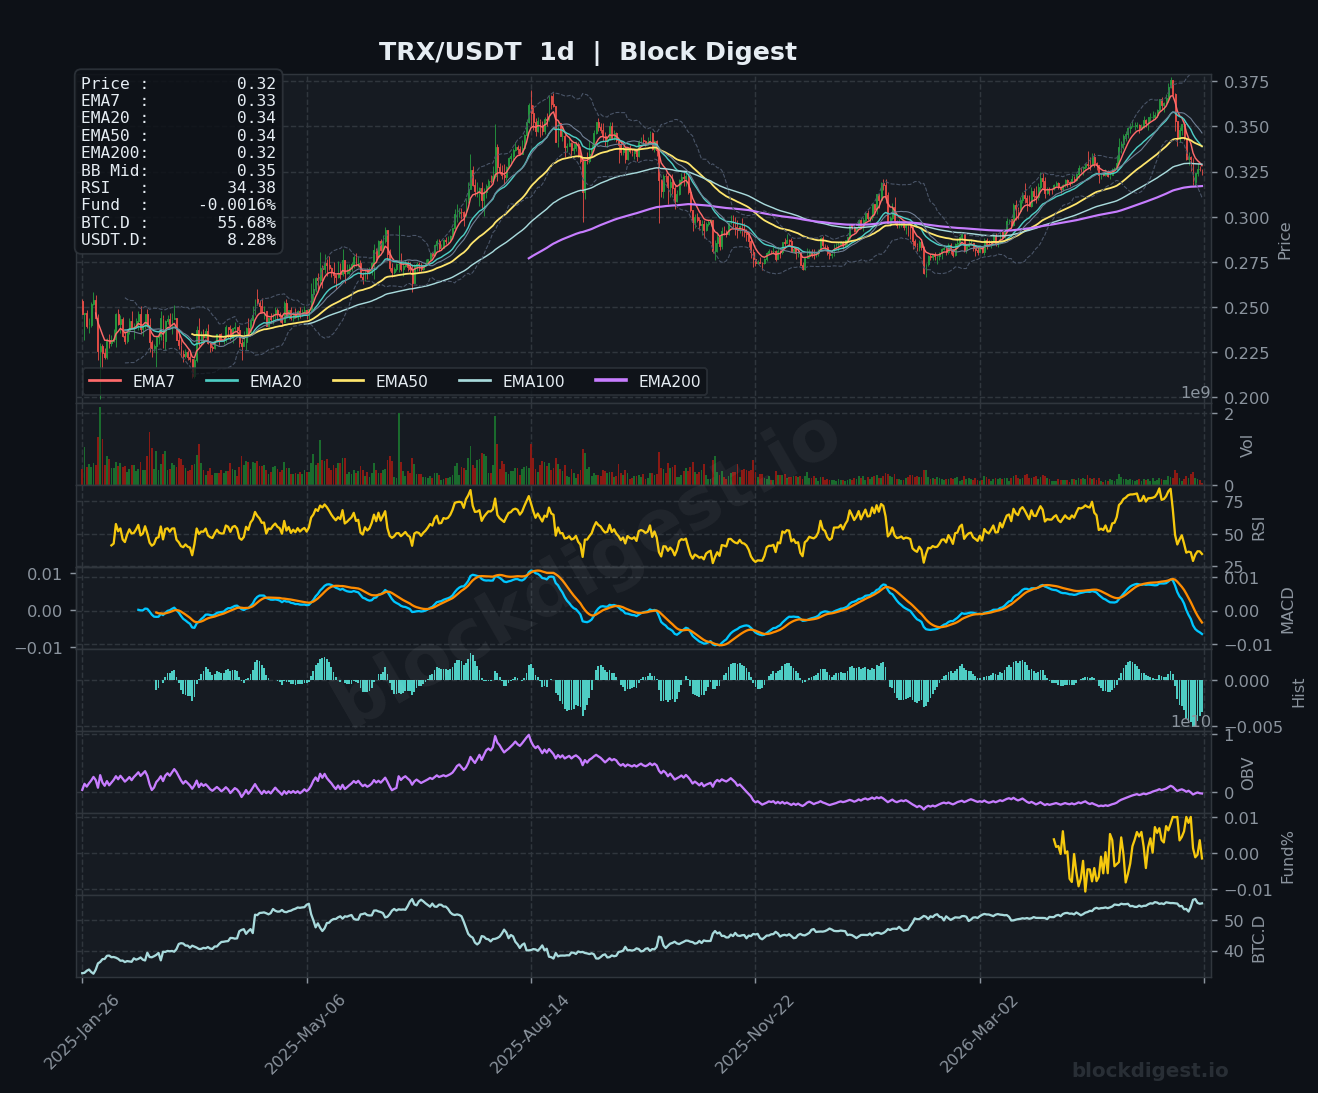
TRON (TRX)
TRX is trading at $0.32, pulling back sharply from its recent cycle high near $0.375 reached on the 4H chart, representing one of the more notable reversals among today’s covered assets given its prior multi-month uptrend. The 1H RSI has declined to a weak 30.64, nearing oversold, while the 4H RSI sits at 39.80 and the daily RSI at 34.38 — all reflecting accelerated selling pressure following the peak. Notably, TRX’s daily EMA200 at $0.32 is actually below the current price, meaning the longer-term structural trend remains more intact than peers, though the daily MACD has rolled over sharply with a bearish crossover forming. The $0.32–$0.33 zone, which coincides with the EMA200 and prior consolidation, is the key support battleground; a hold here keeps the medium-term bullish structure alive, while a breakdown targets $0.29–$0.30.
Altcoin Outlook
The broader altcoin landscape as of June 9, 2026 is characterized by extended downtrends, deeply oversold daily RSI readings across multiple assets, and declining OBV that confirm the absence of meaningful accumulation — conditions consistent with a late-stage markdown phase rather than an imminent broad recovery. BNB and XRP display the most constructive near-term setups, with BNB showing early EMA compression and a nascent 4H MACD histogram recovery, while XRP’s 1H momentum is beginning to shift positive. LTC and DOGE present the weakest technical structures, with LTC’s daily RSI at 24 being the most extreme oversold reading across the group, though oversold alone is not sufficient to trigger a sustained reversal without volume confirmation. Key conditions to watch include whether BTC dominance begins to roll over from the 55.68% level, whether USDT.D compresses below 8%, and whether any of these assets can post meaningful closes above their respective 1H and 4H EMA clusters — without those catalysts, relief bounces are likely to remain short-lived and sell-the-rip dynamics will continue to dominate.
Disclaimer: This analysis is for informational purposes only and does not constitute financial advice. Cryptocurrency markets are highly volatile and unpredictable. All trading decisions should be made based on your own research and risk tolerance. Block Digest is not responsible for any financial losses incurred as a result of acting on this content.