Bitcoin Daily Analysis: Bitcoin at $63K Below All Major EMAs
Market Overview
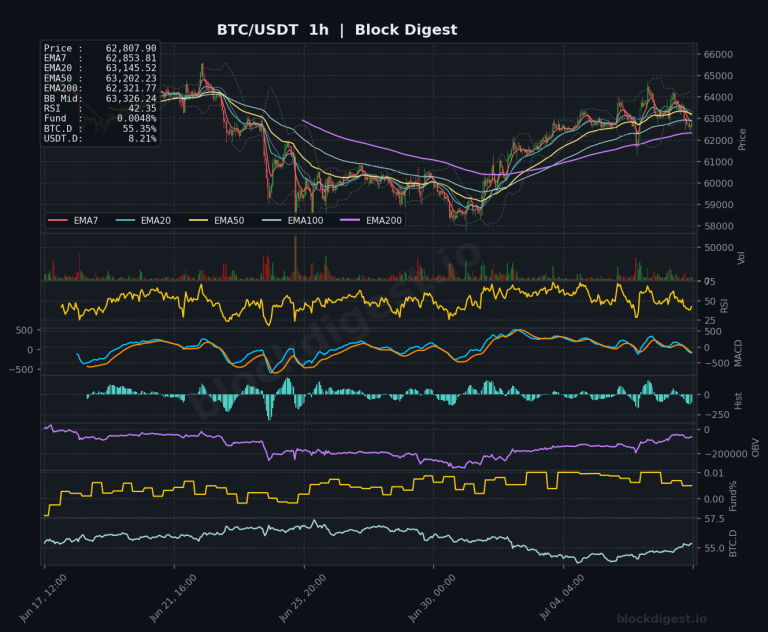
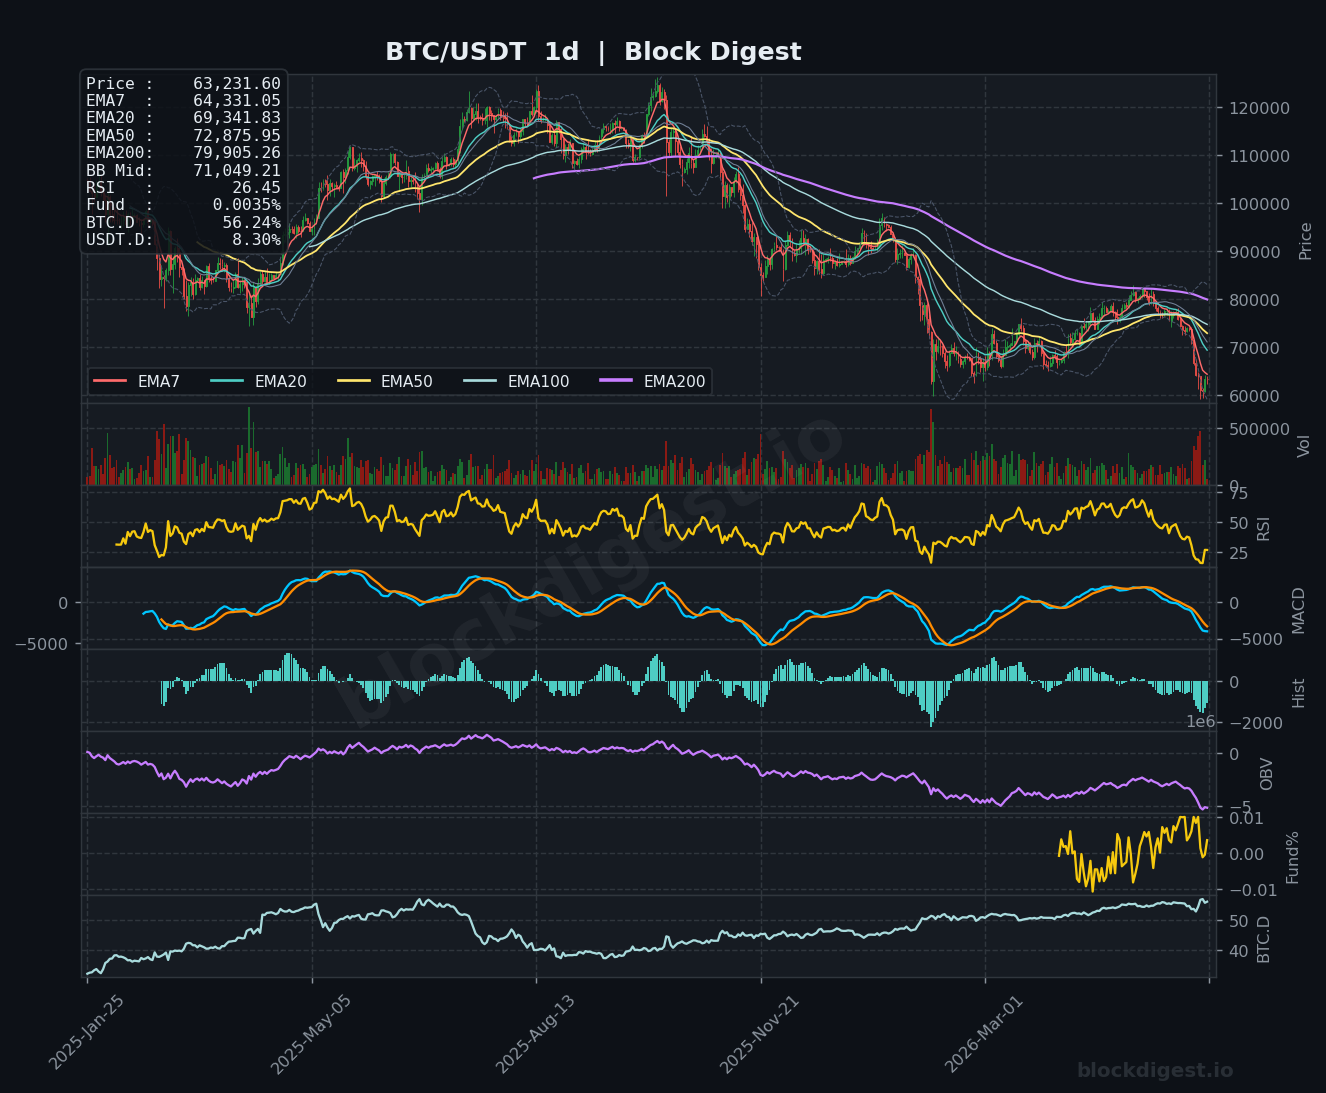
Bitcoin is currently trading around $63,210, sitting approximately 51% below its all-time high of $126,210 reached in early October 2025, reflecting an extended macro downtrend that has steadily eroded value over the past eight months. On the daily timeframe, price remains firmly beneath all major EMAs — the EMA7 at $64,331, EMA20 at $69,342, EMA50 at $72,876, and EMA200 at $79,905 — confirming a deeply bearish structural alignment with no immediate sign of mean reversion. The daily Bollinger Band midline sits at $71,049, roughly $8,000 above current price, underscoring how far price has displaced to the downside. A modest near-term bounce is visible on the lower timeframes, but it remains unconvincing against the broader macro backdrop of institutional distribution and whale-driven selling pressure.
Multi-Timeframe Confluence
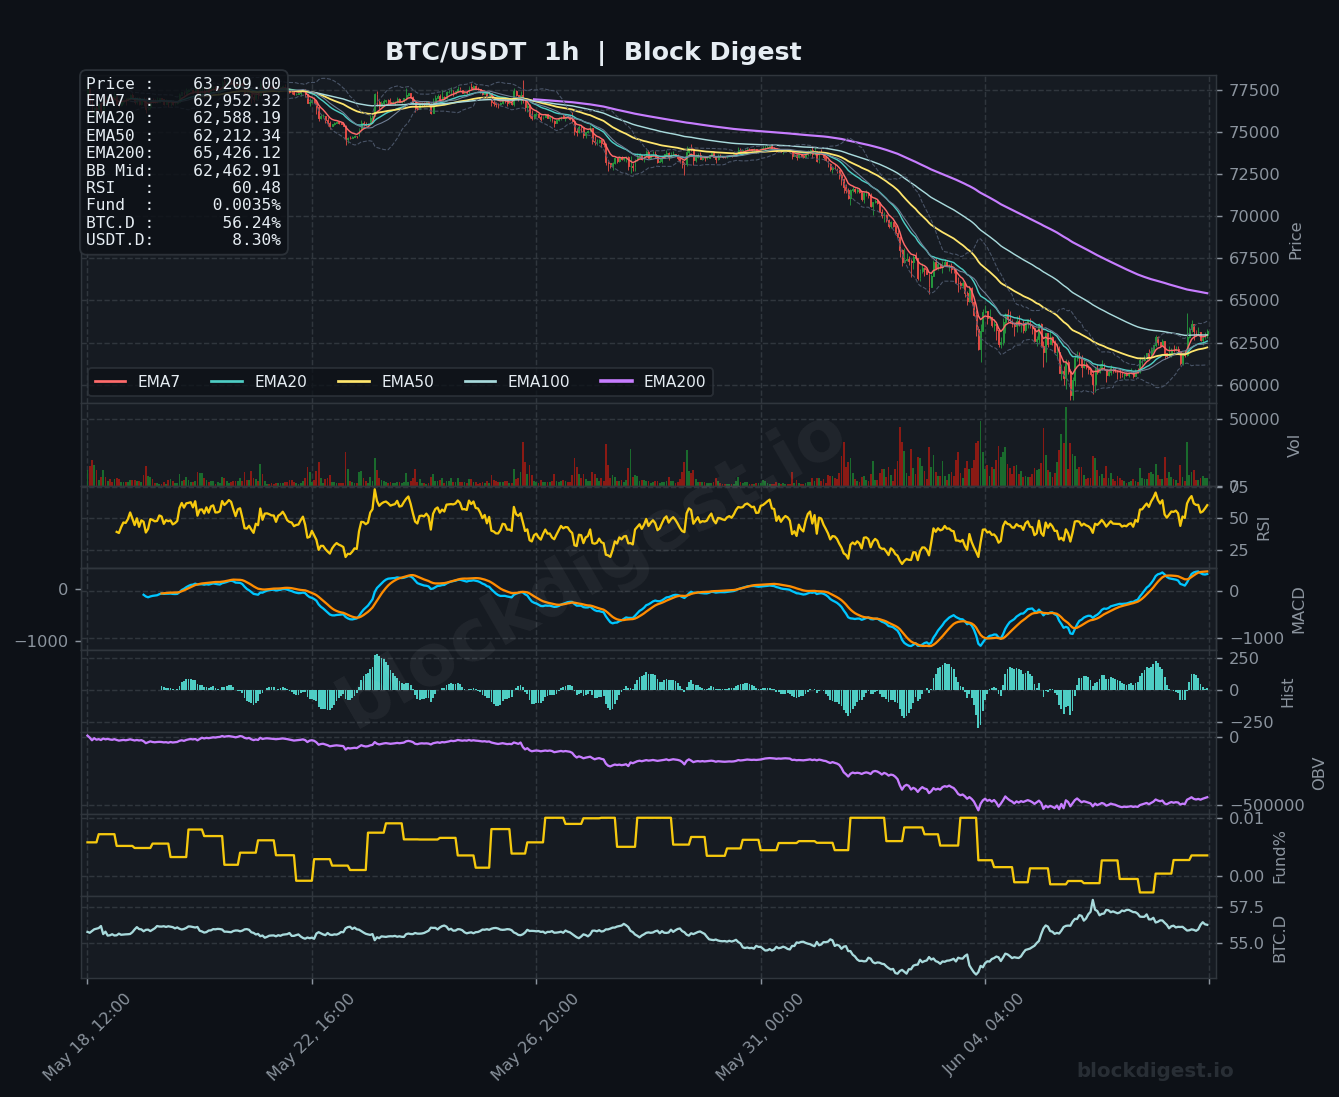
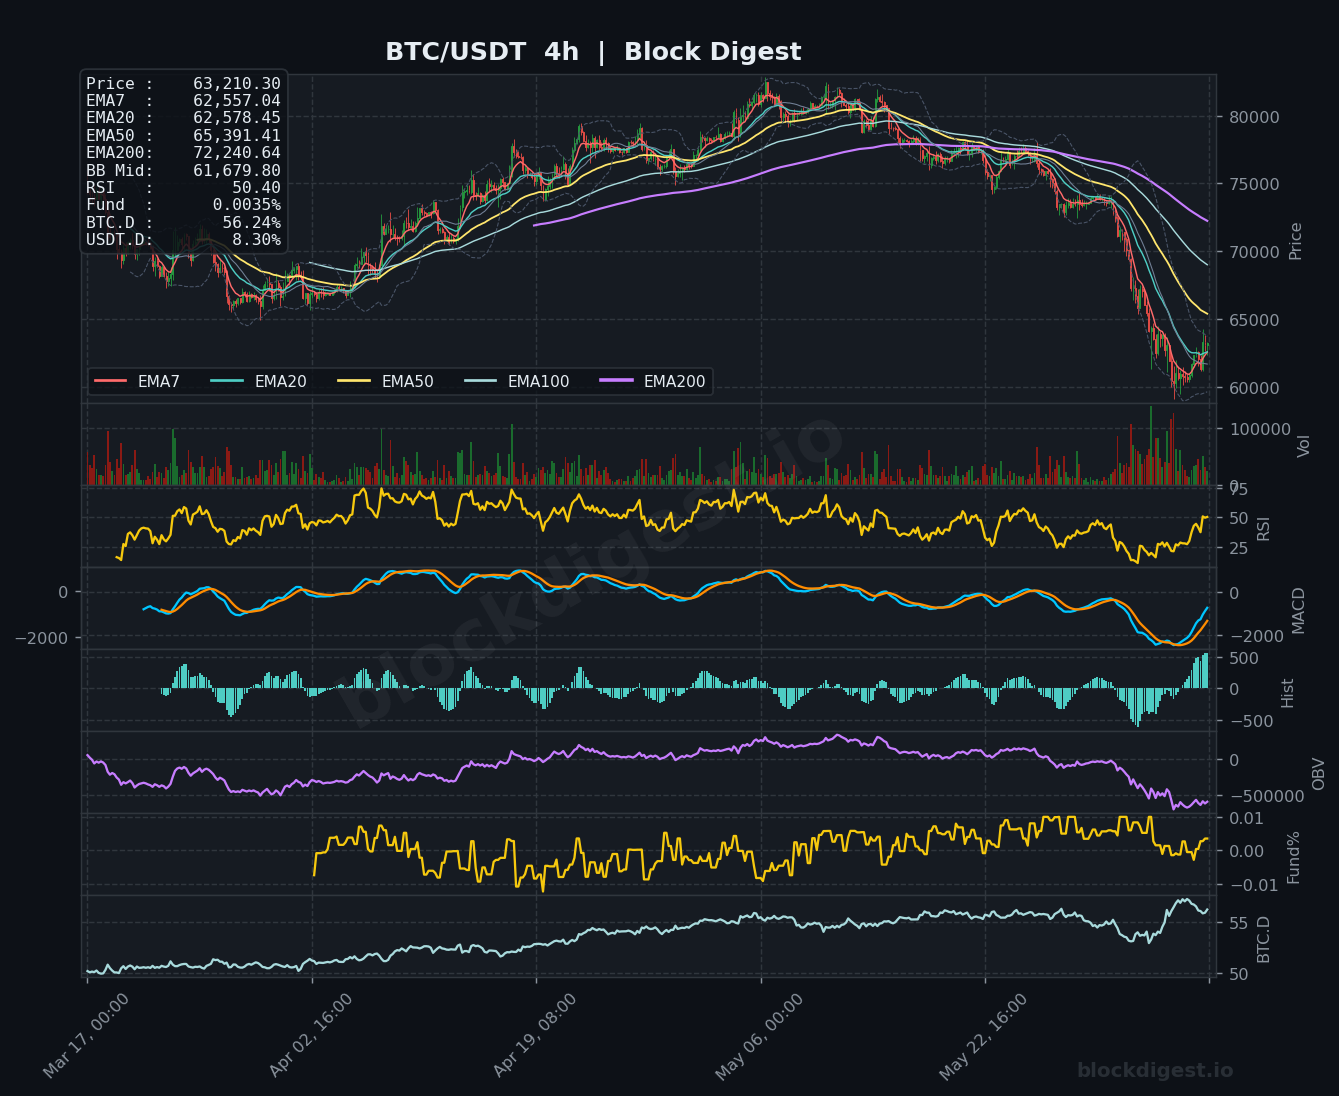
On the 1-hour chart, price has reclaimed all short-term EMAs (EMA7 at $62,952, EMA20 at $62,588, EMA50 at $62,212), suggesting early signs of intraday recovery momentum following what appears to be a capitulation low near $60,000. However, the 1-hour EMA200 sits at $65,426, representing meaningful overhead resistance that price has yet to challenge. The 4-hour chart shows a comparable picture: EMA7 ($62,557) and EMA20 ($62,578) have just crossed bullishly, but price remains well beneath the 4H EMA50 at $65,391 and EMA200 at $72,241, maintaining a bearish macro structure. Across all three timeframes, the dominant direction is unambiguously lower — the short-term bounce represents a potential dead-cat recovery rather than a structural trend reversal until significantly higher levels are reclaimed.
Key Levels to Watch
- Resistance: $64,331 — Daily EMA7, the first meaningful dynamic resistance in an overhead cluster; $65,391–$65,426 — confluence of the 4H EMA50 and 1H EMA200, a critical supply zone that capped recent recoveries; $69,342 — Daily EMA20, a major structural level that, if reclaimed, would meaningfully shift the intermediate-term bias
- Support: $62,462–$61,680 — Confluence of the 1H Bollinger Band midline and 4H BB midline, near-term demand zone currently being tested; $60,000 — Psychological round number that served as the recent local low and key demand floor; $58,000–$57,500 — The next structural support below, where prior consolidation formed ahead of the most recent leg down
Momentum & On-Chain Signals
The RSI divergence across timeframes is particularly notable: the 1-hour RSI has recovered to 60.48, indicating intraday strength and leaving oversold territory behind, while the 4-hour RSI sits at a neutral 50.40 — suggesting the bounce is maturing but not yet exhausted. The daily RSI at 26.45 is technically in oversold territory, which historically has preceded relief rallies, though oversold conditions can persist during sustained downtrends. On the 4-hour MACD, both the MACD line and signal line are converging near extreme negative levels around -2,000, with the histogram beginning to flip positive — a tentative early bullish crossover is forming. OBV on both the 1-hour and 4-hour charts remains in a clear downtrend, reflecting persistent distribution rather than accumulation, which tempers the significance of the price bounce.
BTC Dominance & Market Sentiment
BTC Dominance currently registers at 56.24%, a notably elevated reading that reflects capital consolidation into Bitcoin as risk appetite deteriorates — altcoins are bearing a disproportionate share of selling pressure. USDT Dominance at 8.30% signals a meaningful flight to stable assets, indicating market participants are defensively positioned and risk-off sentiment remains entrenched. Together, these readings suggest that while Bitcoin is outperforming the broader altcoin market on a relative basis, the macro environment does not yet favor aggressive long exposure across the crypto asset class.
Risk Scenarios
- Bullish case: A sustained hourly close above $65,391 — the 4H EMA50 / 1H EMA200 confluence — accompanied by expanding OBV and a daily RSI recovery above 35 would suggest a more meaningful relief rally toward the $69,000–$70,000 region. Continuation above the daily EMA20 at $69,342 would be required to seriously question the prevailing downtrend.
- Bearish case: Failure to hold the $62,000–$61,680 support band and a breakdown below the $60,000 psychological level would likely accelerate selling toward $57,500–$58,000, especially if OBV continues making lower lows and the 4-hour MACD fails to complete its bullish crossover.
Outlook
The overall bias remains cautiously bearish on the macro timeframe, with a short-term bounce in progress that deserves respect given the daily RSI’s deeply oversold condition near 26. The next 24–48 hours are critical: Bitcoin needs to either build a base above $63,000 and push toward $65,400 to validate the recovery, or risk rolling over and retesting the $60,000 support that recently held. The confluence of negative OBV, whale distribution narratives, and a fully bearish EMA stack on the daily chart makes any upside move a relief rally candidate until proven otherwise. Traders should monitor the $65,391 resistance closely — a clean break and hold above that level would be the first genuine sign that the correction phase may be entering a consolidation phase rather than continuation lower.
Disclaimer: This analysis is for informational purposes only and does not constitute financial advice. Cryptocurrency markets are highly volatile and unpredictable. All trading decisions should be made based on your own research and risk tolerance. Block Digest is not responsible for any financial losses incurred as a result of acting on this content.