Bitcoin Daily Analysis: Bitcoin Below All Major EMAs, Distribution Phase Ongoing
Market Overview
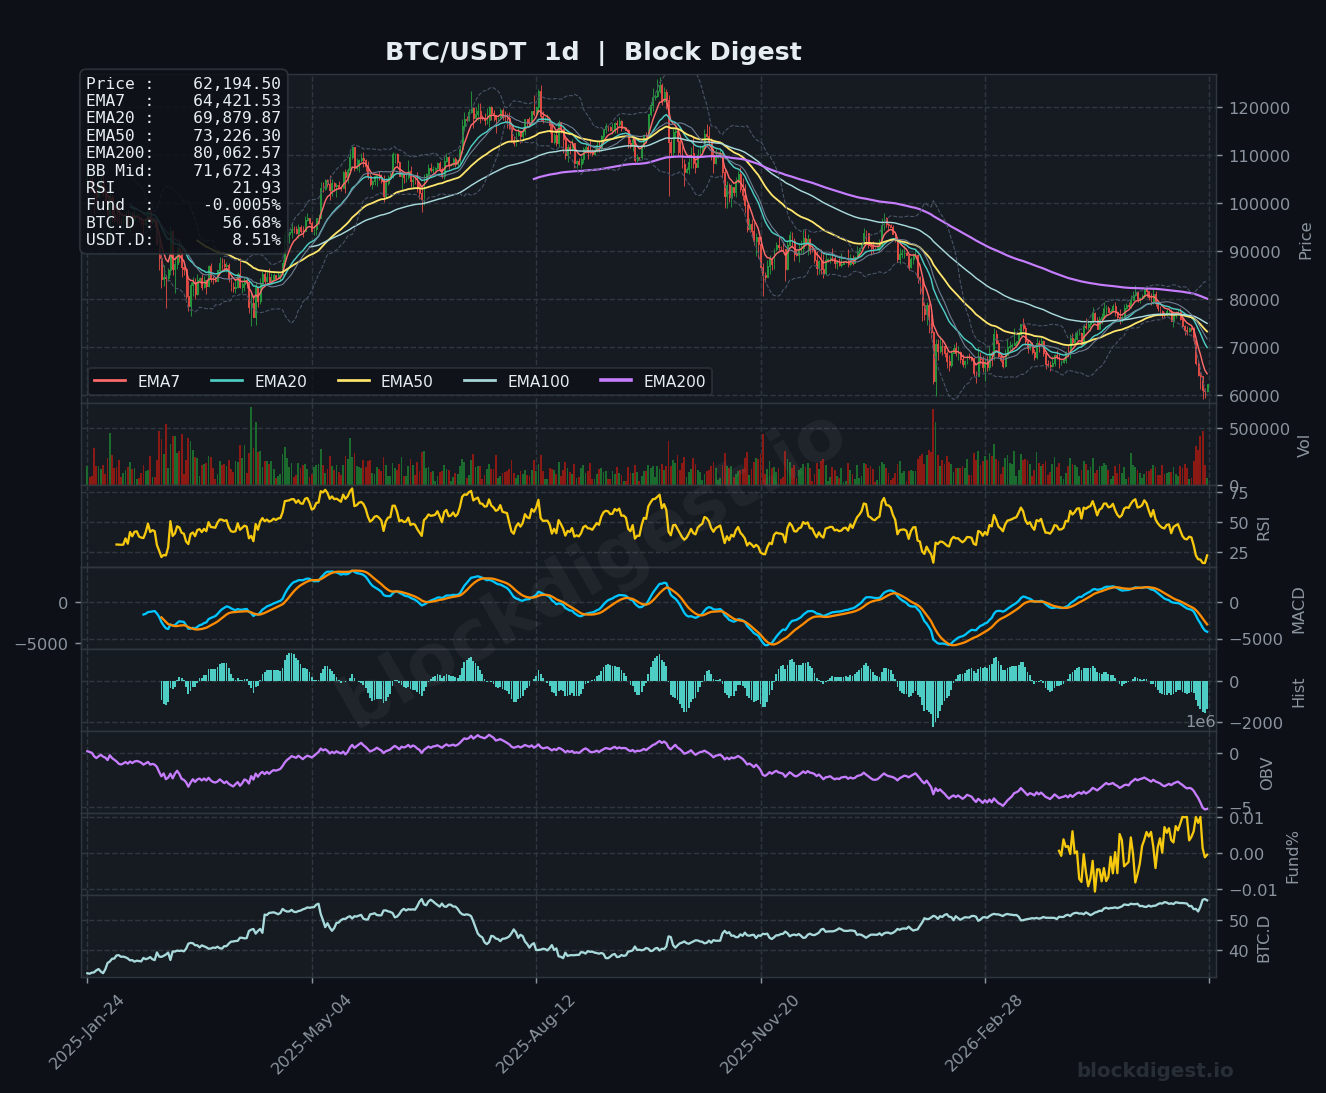
Bitcoin is currently trading at $62,194, positioned well below all major daily EMAs — the EMA7 at $64,421, EMA20 at $69,879, EMA50 at $73,226, and EMA200 at $80,062 — painting a structurally bearish picture across the higher timeframe. Price is also trading significantly beneath the daily Bollinger Band midline of $71,672, suggesting the dominant trend remains firmly to the downside. The daily chart shows a protracted distribution phase from the all-time high region near $126,272, with successive lower highs and lower lows confirming entrenched selling pressure. Notably, current price action is pressing toward the lower Bollinger Band on the daily, which may present a short-term mean-reversion opportunity but does not negate the broader bearish structure.
Multi-Timeframe Confluence
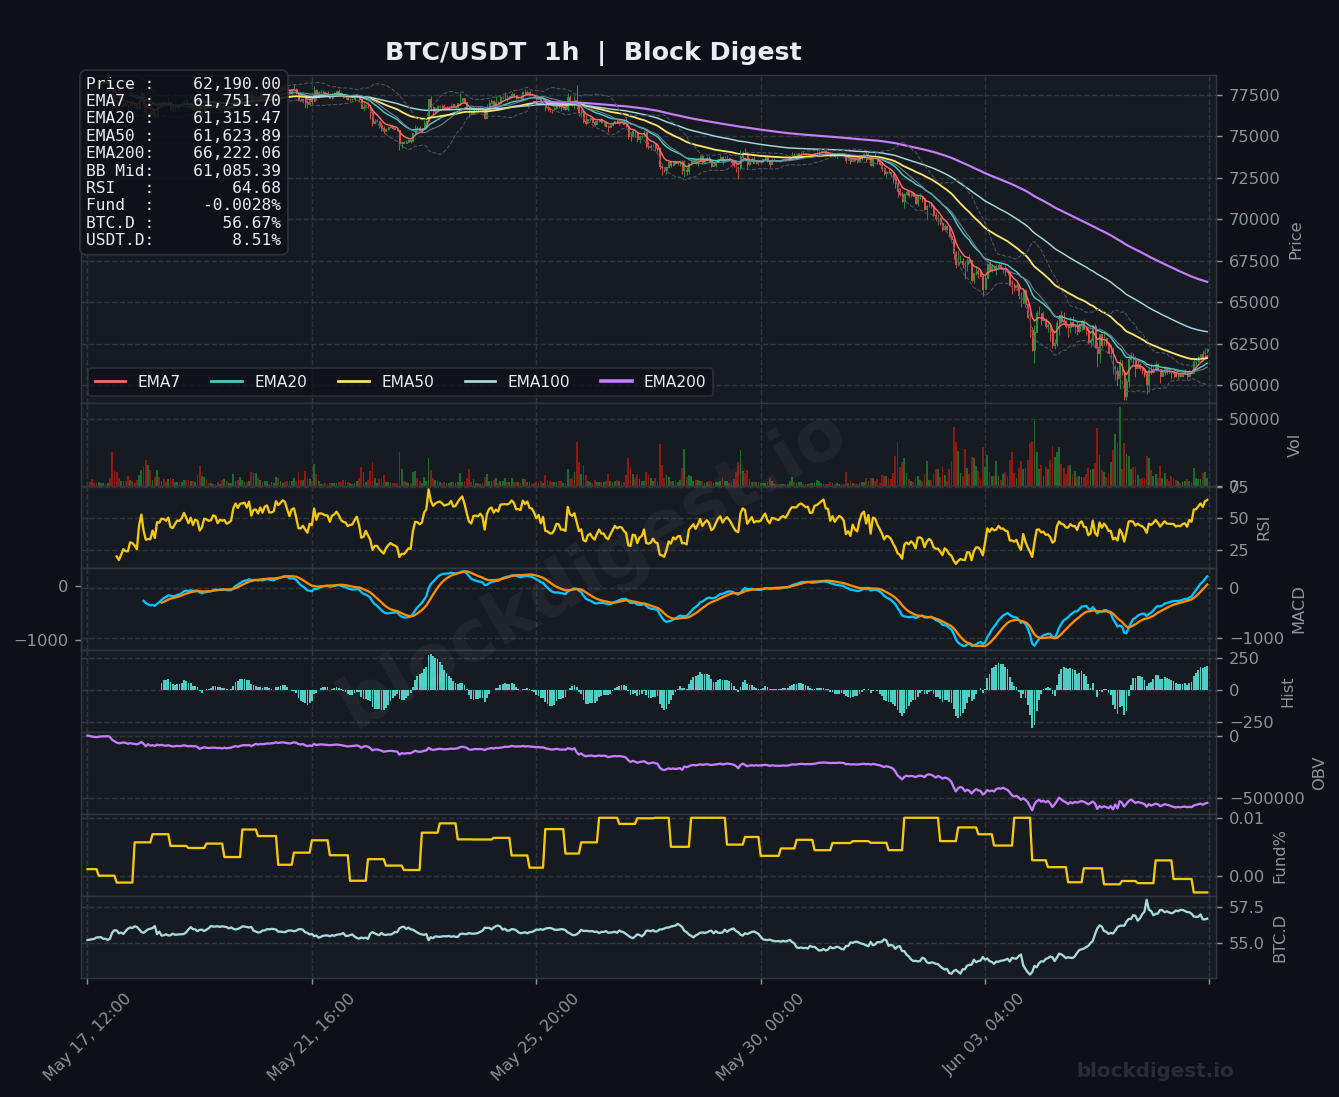
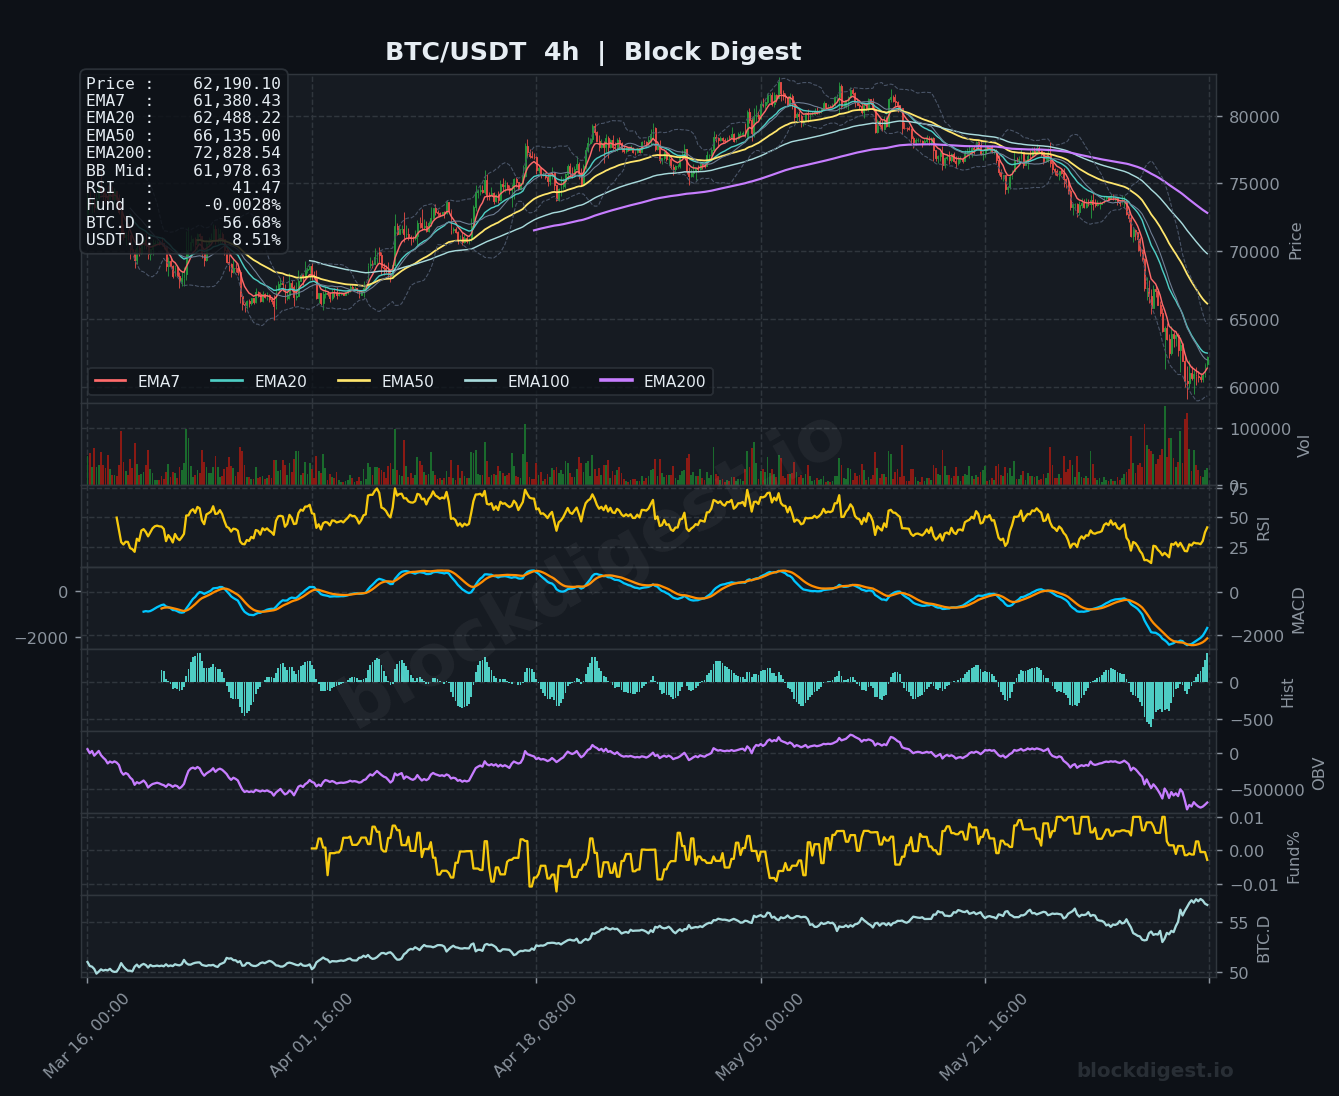
All three timeframes are in broad bearish alignment, with EMAs stacked in a bearish cascade (short-term below long-term) on both the 1h and 4h charts. On the 1h chart, price at $62,190 sits just above EMA7 ($61,751) and EMA20 ($61,315), suggesting a very tentative short-term stabilization following the recent sharp sell-off from the $73,500–$77,500 range. The 4h timeframe shows price attempting to recover from deeply oversold conditions — the EMA7 ($61,380) and EMA20 ($62,488) are beginning to converge near current price — though the EMA50 ($66,135) and EMA200 ($72,828) remain distant and act as formidable overhead resistance. Any short-term bounces on the lower timeframes are likely to be sold into unless price can reclaim the 4h EMA20 decisively.
Key Levels to Watch
- Resistance: $64,421 — daily EMA7, the nearest dynamic resistance and first meaningful hurdle for any recovery attempt
- Resistance: $66,135 — 4h EMA50, a key pivot that would need reclaiming to suggest the short-term downtrend is reversing
- Resistance: $69,879 — daily EMA20, representing a major structural ceiling that would shift medium-term bias if reclaimed on a daily close
- Support: $61,315 — 1h EMA20, the immediate intraday support zone currently cushioning price
- Support: $60,000–$60,339 — the psychological round number and recent market lows per broader context; a breach here would signal continued capitulation
- Support: $58,000–$58,500 — the lower Bollinger Band range on the daily timeframe, representing a potential exhaustion zone if selling accelerates
Momentum & On-Chain Signals
The daily RSI is extremely notable at 21.93 — deeply into oversold territory and at levels not frequently seen in Bitcoin’s recent history, suggesting the magnitude of the sell-off has been severe. The 4h RSI reads 41.47, recovering from lows but still below the neutral 50 line, while the 1h RSI at 64.68 reflects the recent short-term bounce attempt with momentum tilting modestly bullish on that timeframe. The daily MACD remains in a deep bearish crossover with a substantially negative histogram, confirming the trend deterioration, though the histogram bars on the 4h are beginning to contract — a potential early sign of bearish momentum fading. On-Balance Volume (OBV) on both the 4h and daily charts continues to trend lower, confirming ongoing net distribution rather than accumulation. The funding rate sits at -0.0028% (1h) and -0.0005% (daily), reflecting slightly negative sentiment — shorts are marginally paying longs, which historically can act as a contrarian signal for a relief bounce.
BTC Dominance & Market Sentiment
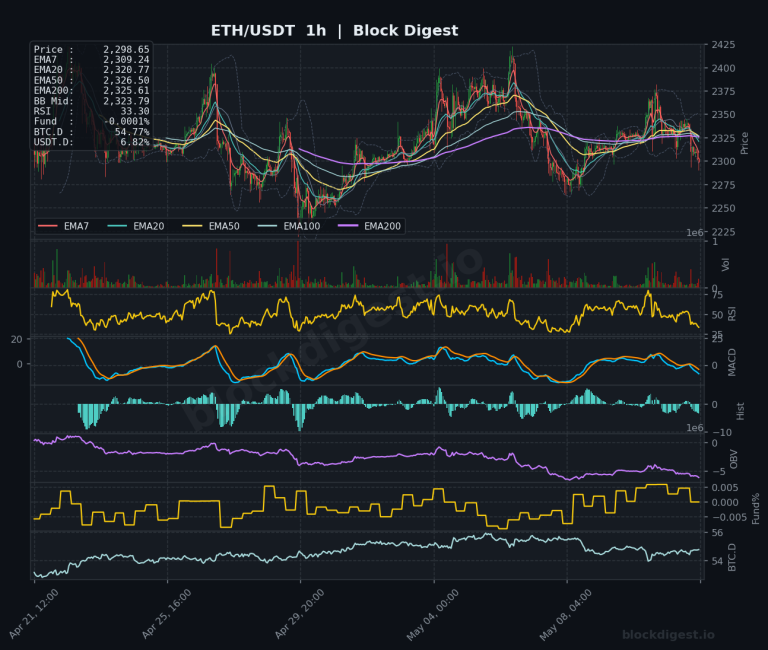
BTC dominance stands at 56.67–56.68%, a relatively elevated reading that suggests capital has been consolidating into Bitcoin rather than rotating broadly into altcoins amid the market drawdown. USDT dominance at 8.51% indicates a meaningful proportion of market participants have moved to stablecoins, reflecting risk-off positioning and reduced appetite for crypto exposure broadly. Together, these readings suggest the market is in a defensive posture — not yet showing the kind of USDT.D spike that would typically mark maximum fear, but clearly not positioned for aggressive risk-on rotation either.
Risk Scenarios
- Bullish case: A sustained hold above $61,315 (1h EMA20) with a confirmed reclaim of $64,421 (daily EMA7) on a 4h close would signal a credible short-term recovery, opening the path toward the $66,135–$69,879 resistance band. Extremely oversold daily RSI at 21.93 combined with negative funding rates creates the setup for a sharp short-squeeze bounce if buy pressure returns.
- Bearish case: A breakdown and daily close below $60,000 would confirm a continuation of the macro downtrend, with the next meaningful support cluster not until the $58,000–$58,500 lower Bollinger Band zone. Persistent negative OBV divergence on the daily and the deeply bearish EMA stack suggest any failure to hold current levels could accelerate selling.
Outlook
The overall bias remains cautiously bearish on the higher timeframes, with the daily EMA stack, declining OBV, and deep MACD bearish crossover all pointing to sustained structural weakness. However, the daily RSI at 21.93 is a significant signal that a mean-reversion bounce is statistically overdue, and the slightly negative funding rate adds a contrarian element worth monitoring. In the next 24–48 hours, the critical trigger to watch is whether BTC can defend $61,315–$62,000 and build a base, or whether the $60,000 level gives way entirely. A thesis-changing development to the upside would require a 4h close above $66,135; to the downside, any daily close beneath $60,000 would reinforce the bearish continuation narrative and likely draw in further selling.
Disclaimer: This analysis is for informational purposes only and does not constitute financial advice. Cryptocurrency markets are highly volatile and unpredictable. All trading decisions should be made based on your own research and risk tolerance. Block Digest is not responsible for any financial losses incurred as a result of acting on this content.