Bitcoin Daily Analysis: Bitcoin at $61K, Below All Major EMAs
Market Overview
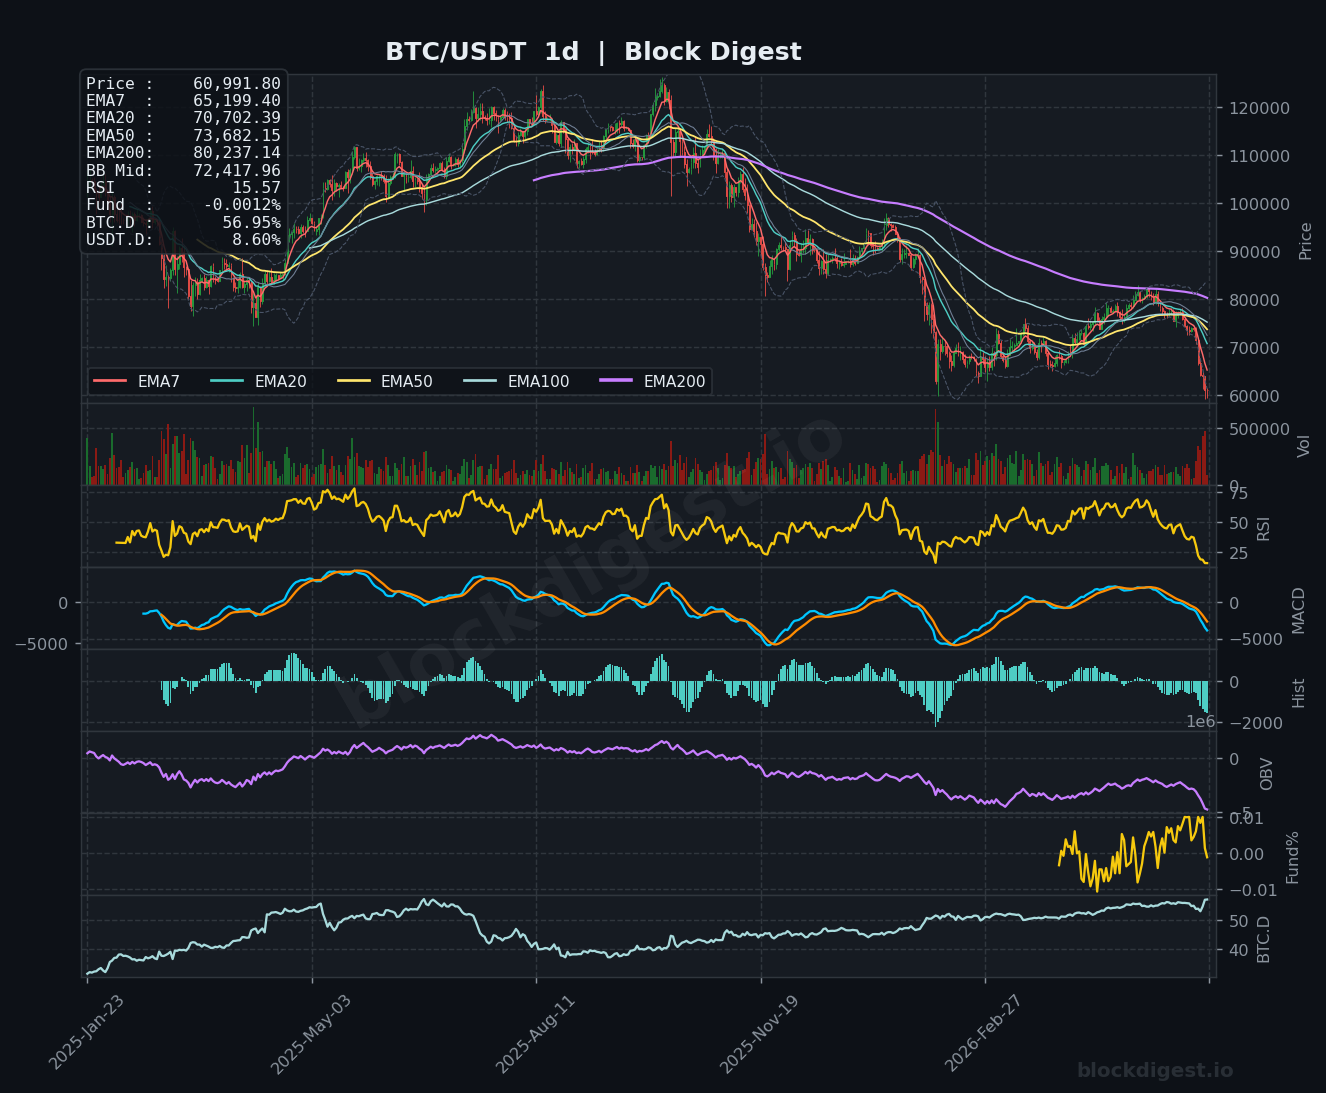
Bitcoin is trading at approximately $61,005 after suffering a sharp multi-week decline from its recent highs above $73,000, representing a loss of roughly 16% over the past week alone — well off its all-time high of $126,210 set last October. On the daily timeframe, price is trading significantly below all major EMAs: the EMA7 sits at $65,199, EMA20 at $70,702, EMA50 at $73,682, and the EMA200 at $80,237 — a full bearish stack that signals sustained distribution pressure. Price is also trading well beneath the Bollinger Band midline ($72,417), hugging the lower band, which confirms that the dominant trend on the daily chart is firmly bearish. The $60,000 psychological level is now directly in play as a critical near-term battleground.
Multi-Timeframe Confluence
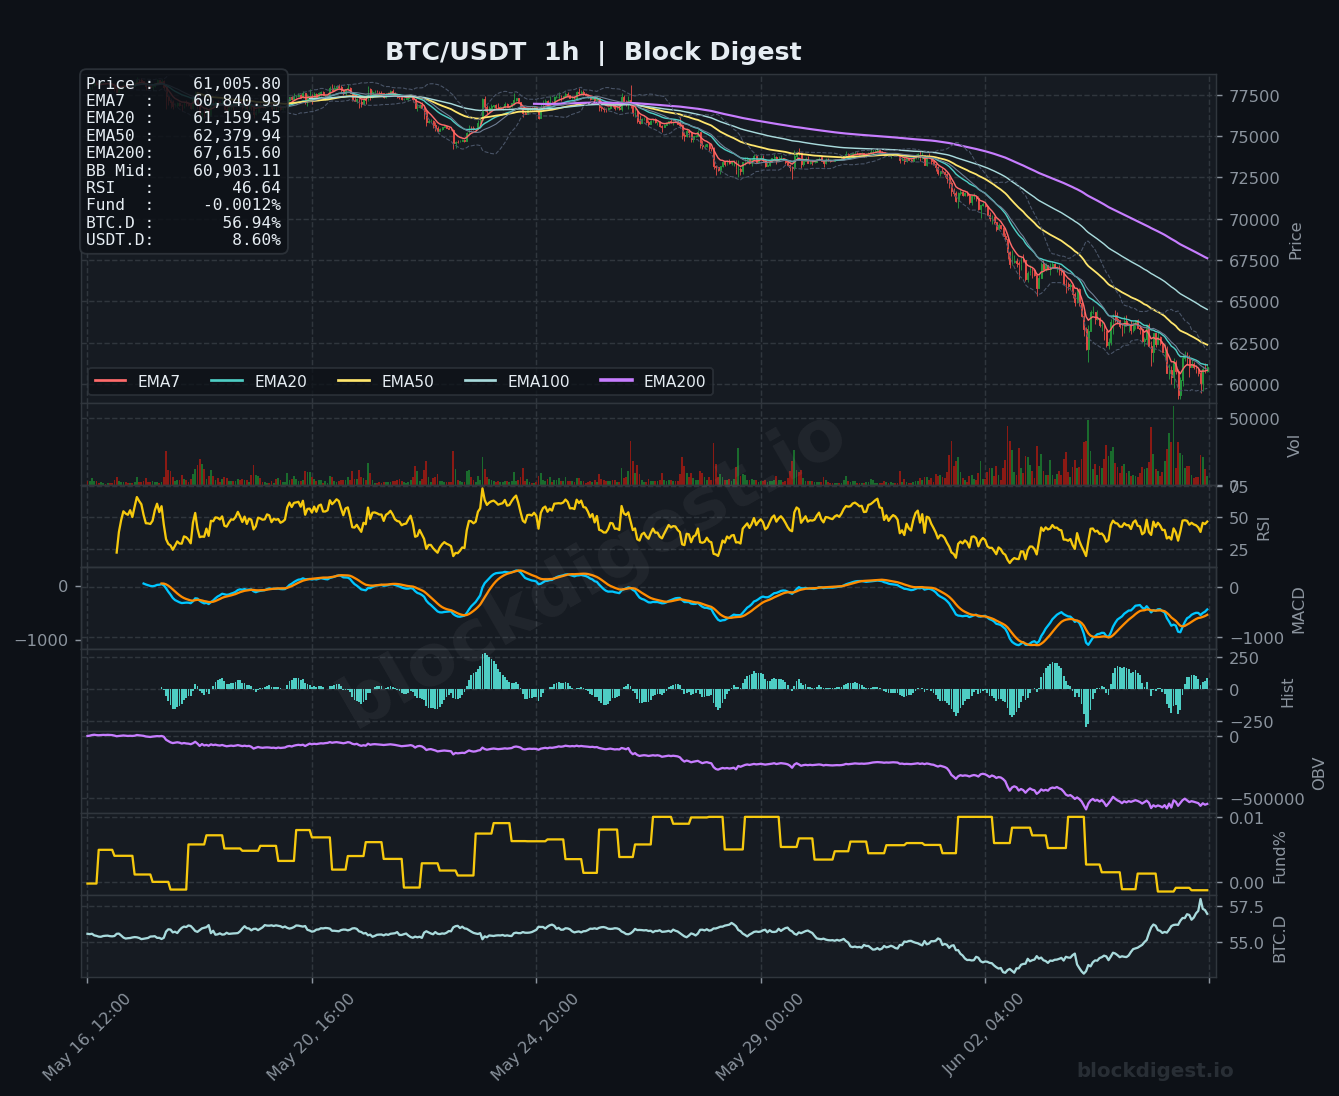
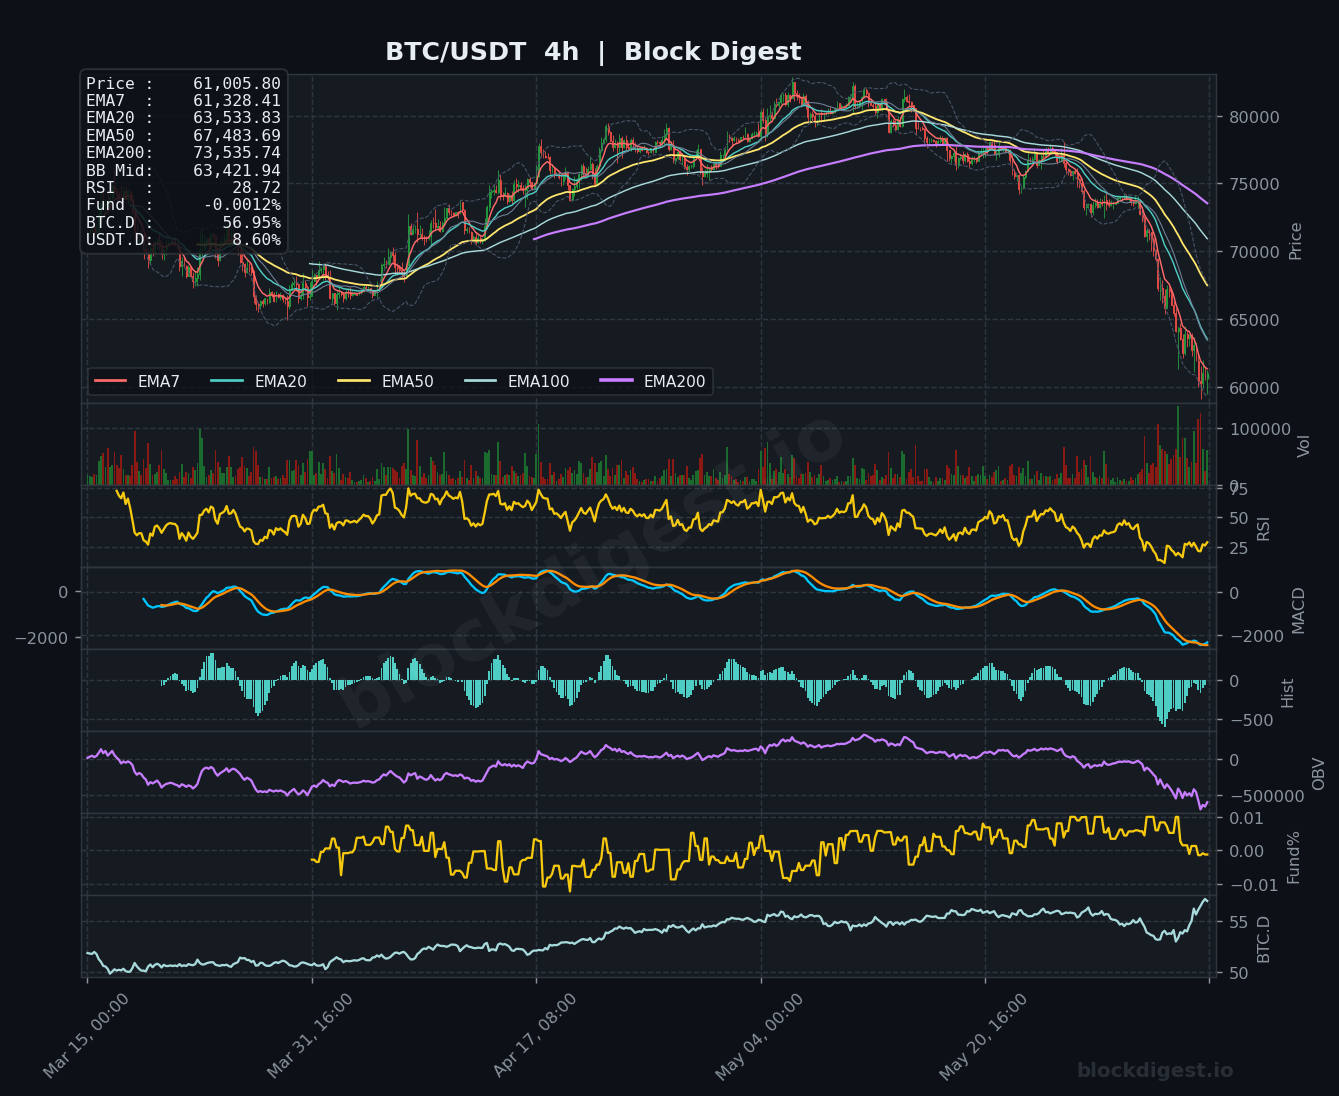
Across all three timeframes, the picture is uniformly bearish, with little meaningful divergence to suggest an imminent structural reversal. On the 1h chart, price is trading just above the EMA7 ($60,841) and EMA20 ($61,159) after a sharp capitulation spike, but remains well below the EMA50 ($62,379) and EMA200 ($67,615), confirming that any near-term bounce is occurring within a broader downtrend. The 4h chart reinforces this view: the EMA20 at $63,533 and EMA50 at $67,483 are both sloping aggressively downward with price having collapsed through all key moving average support levels in rapid succession. The daily timeframe shows the most severe structural damage, with all EMAs in a deeply bearish alignment and price approaching the lower Bollinger Band — a zone that may temporarily attract dip buyers but offers no structural guarantee of a floor.
Key Levels to Watch
- Resistance: $62,379 — the 1h EMA50, acting as the nearest overhead supply zone and a level sellers have defended aggressively during the current decline
- Resistance: $63,421–$63,533 — the 4h Bollinger Band midline and 4h EMA20, representing the first meaningful recovery target and a level likely to draw significant selling interest on any bounce
- Resistance: $65,199–$67,483 — the daily EMA7 and 4h EMA50 cluster, a broader overhead supply zone that would need to be reclaimed to shift short-term bias to neutral
- Support: $60,000 — major psychological round number and widely cited confluent level by derivatives analysts at Deribit; a loss of this level would carry significant technical and sentiment implications
- Support: $59,227 — the overnight capitulation wick low from the jobs data selloff, representing the most recent structural low and a line in the sand for bulls
- Support: $57,500–$58,000 — a broader demand zone visible on the daily chart corresponding to prior consolidation structure; would likely be the next target on a decisive break below $59,227
Momentum & On-Chain Signals
The RSI readings tell a deeply oversold story across timeframes: the daily RSI has collapsed to just 15.57, a historically extreme reading that indicates severely stretched conditions to the downside and warrants close monitoring for potential mean-reversion signals. The 4h RSI sits at 28.72, hovering near oversold territory, while the 1h RSI at 46.64 suggests a mild intraday recovery attempt is underway after the overnight flush. The daily MACD remains in deeply negative territory with the histogram expanding to the downside, reflecting accelerating bearish momentum with no crossover signal in sight. On-chain OBV across all timeframes is in a clear downtrend, confirming net distribution and a lack of meaningful accumulation at current levels — the 4h OBV in particular has dropped sharply to multi-week lows. The funding rate at -0.0012% is slightly negative, consistent with a market where short positioning is elevated and overleveraged longs have been flushed.
BTC Dominance & Market Sentiment
BTC dominance is currently reading 56.94–56.95% across timeframes, a level that has been rising steadily as altcoins suffer disproportionately in the risk-off environment — this is consistent with capital rotating defensively into Bitcoin relative to the broader crypto market rather than exiting entirely. USDT dominance at 8.60% is elevated, reflecting a meaningful shift toward stablecoin positioning and confirming that overall risk appetite in the crypto market remains suppressed. Together, these readings suggest the market is in a defensive posture: participants are not yet deploying aggressively, and the macro headwinds from Friday’s strong jobs report — and the associated repricing of Fed rate cut expectations — continue to weigh on sentiment.
Risk Scenarios
- Bullish case: A decisive hold and close above $60,000 on the daily timeframe, followed by reclaiming the 1h EMA50 at $62,379, would suggest the capitulation low is in and open a path toward the $63,421–$65,199 resistance cluster; a relief rally of 5–8% from current levels is plausible if macro sentiment stabilizes.
- Bearish case: A confirmed daily close below $59,227 would negate the current recovery attempt and expose BTC to a deeper move toward the $57,500–$58,000 support zone; failure there would bring the $55,000 region into scope as the next major structural demand area.
Outlook
The overall bias heading into the next 24–48 hours is cautiously bearish with an acknowledgment that deeply oversold daily conditions (RSI 15.57) may produce a short-term technical bounce, but such a bounce should be treated as a potential relief rally within a downtrend rather than a structural reversal signal. The critical trigger to watch is whether BTC can sustain trade above $60,000 — a level with strong psychological, technical, and derivatives-related significance — on a closing basis. Any reclaim and hold of $62,379 (1h EMA50) would be the minimum requirement to shift short-term momentum to neutral. Until the 4h and daily EMAs begin to flatten and price can establish a series of higher lows, the path of least resistance remains downward, and the macro backdrop of potential Fed rate hike repricing provides an additional structural headwind that technical analysis alone cannot override.
Disclaimer: This analysis is for informational purposes only and does not constitute financial advice. Cryptocurrency markets are highly volatile and unpredictable. All trading decisions should be made based on your own research and risk tolerance. Block Digest is not responsible for any financial losses incurred as a result of acting on this content.