BD Extreme Index Explained: How to Spot Historically Extreme Market Conditions
BD Extreme Index explained — and why BD Pulse alone isn’t always enough.
BD Pulse tells you what the market looks like right now. But “right now” without historical context can be misleading. A score of 70 might look elevated — but is it actually unusual, or is that just a normal reading for this stage of the cycle? The BD Extreme Index answers that question by placing the current score in its full historical context.
This guide explains what the BD Extreme Index measures, how to read the Z-Score zones, and how I use it alongside BD Pulse in practice.
In This Guide
What is the BD Extreme Index?
The BD Extreme Index is a Z-Score calculated from BD Pulse’s historical data. It measures how many standard deviations the current BD Pulse score is from its historical average.
BD Extreme Index = (Current BD Pulse Score − Historical Average) ÷ Historical Standard Deviation
A Z-Score of 0 means the current reading is exactly at the historical average. A score of +2 means the current reading is two standard deviations above average — statistically unusual. A score of −2 means two standard deviations below average — also statistically unusual, but in the opposite direction.
In normal distributions, roughly 95% of readings fall within ±2σ. When the BD Extreme Index moves beyond those bounds, it signals historically rare market conditions.
How to Read the BD Extreme Index
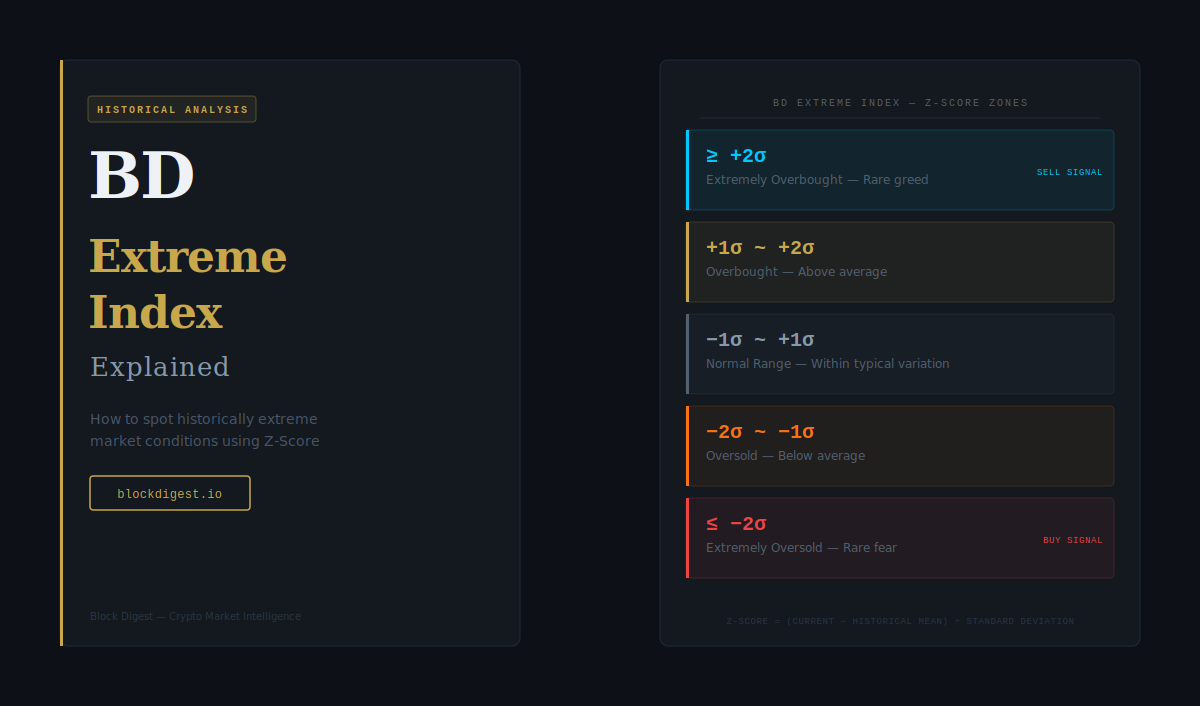
The BD Extreme Index uses five zones based on standard deviation thresholds:
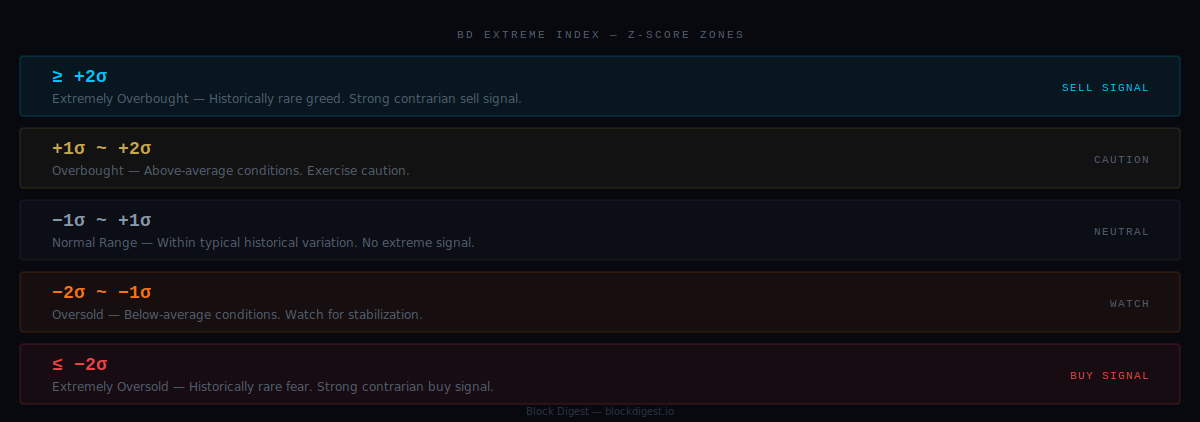
| Z-Score | Zone | What It Means |
|---|---|---|
| ≥ +2σ | Extremely Overbought | Historically rare greed — potential sell signal |
| +1σ ~ +2σ | Overbought | Above-average conditions, exercise caution |
| −1σ ~ +1σ | Normal Range | Within typical historical variation |
| −2σ ~ −1σ | Oversold | Below-average conditions, watch for stabilization |
| ≤ −2σ | Extremely Oversold | Historically rare fear — potential buy signal |
The further the Z-Score moves from zero, the more historically unusual the current market conditions are. Readings beyond ±2σ have historically been associated with significant market turning points — but they’re rare precisely because markets tend to revert toward the mean over time.
Why Z-Score Instead of Just a Raw Score?
The raw BD Pulse score gives you current conditions. But current conditions without historical context can be misleading.
Consider two scenarios where BD Pulse reads 65:
- BD Pulse 65, BD Extreme Index +0.3σ — mildly bullish conditions that are actually quite normal historically. No strong signal.
- BD Pulse 65, BD Extreme Index +2.4σ — the same raw score, but this level is historically extreme. Strong contrarian sell signal.
The BD Extreme Index solves this by telling you not just what the reading is, but how rare it is. This is particularly useful at cycle tops and bottoms, where raw scores can look “just a bit elevated” while the historical context reveals something far more unusual is happening.
Historical Windows by Timeframe
The BD Extreme Index uses different historical windows depending on the timeframe, to ensure the Z-Score reflects a meaningful sample:
| Timeframe | Z-Score Window |
|---|---|
| Daily | 365 days (1 year) |
| Weekly | 104 weeks (2 years) |
| Monthly | 36 months (3 years) |
These windows are chosen to capture at least one full market cycle in each timeframe, giving the Z-Score enough context to identify genuinely extreme readings versus normal cyclical variation.
How I Use BD Extreme Index
1. Confirm whether a BD Pulse reading is truly extreme
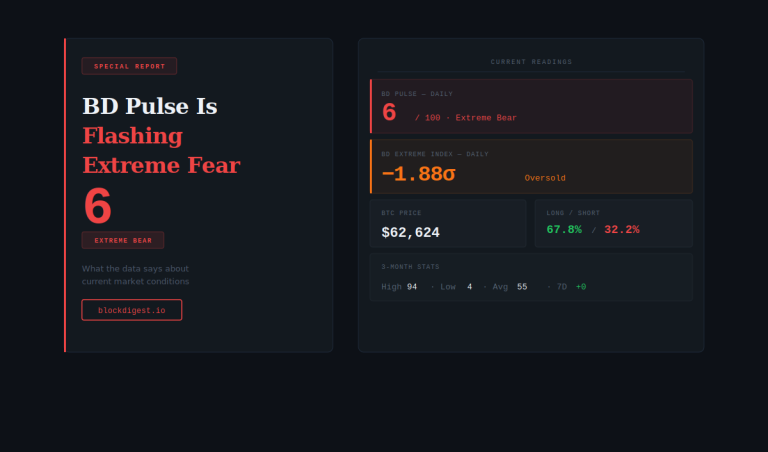
My first use case is simple: whenever BD Pulse hits the Extreme Bull or Extreme Bear zones, I check the BD Extreme Index to see if the reading is historically significant or just temporarily elevated. A BD Pulse score of 78 with a Z-Score of +1.2σ is very different from a score of 78 with a Z-Score of +2.8σ.
2. Identify asymmetric risk/reward setups
The most valuable signals tend to come when both BD Pulse and BD Extreme Index are pointing in the same extreme direction. When BD Pulse is in Extreme Bear territory and the Z-Score is at −2σ or below, the combined signal suggests conditions that are both deeply oversold and historically unusual — a setup that has historically offered asymmetric risk/reward for patient buyers.
The same logic applies in reverse: when BD Pulse is Extreme Bull and BD Extreme Index is ≥ +2σ, the market is both technically overbought and historically extreme — a strong signal to reduce exposure.
3. Use mean reversion as a framework
Markets tend to revert toward average conditions over time. The BD Extreme Index makes this tendency explicit: when the Z-Score is at +2σ or beyond, the statistical expectation is that it will eventually return toward 0. I don’t know when — no indicator can tell you that — but the BD Extreme Index helps me understand that the risk/reward balance has shifted in a meaningful way.
4. Combine with BD Pulse for the full picture
BD Extreme Index is designed to be used alongside BD Pulse, not in isolation. The full framework:
- BD Pulse — What are current market conditions?
- BD Extreme Index — How historically unusual are those conditions?
The strongest signals come when both indicators are aligned: extreme conditions that are also historically rare. A single indicator flashing an extreme reading without confirmation from the other deserves more skepticism.
BD Extreme Index vs. BD Pulse: Quick Reference
| Scenario | BD Pulse | BD Extreme Index | Interpretation |
|---|---|---|---|
| Elevated but normal | High (70+) | 0σ to +1σ | Mildly bullish, within typical range |
| Historically extreme greed | High (70+) | ≥ +2σ | Rare — strong contrarian sell signal |
| Weak but normal | Low (30−) | 0σ to −1σ | Mildly bearish, within typical range |
| Historically extreme fear | Low (30−) | ≤ −2σ | Rare — strong contrarian buy signal |
| Neutral reading | 45–55 | Near 0σ | No strong signal in either direction |
Where to Find the BD Extreme Index
The BD Extreme Index is available alongside BD Pulse at blockdigest.io/bd-pulse/.
On the BD Pulse page, toggle from “BD Pulse” to “BD Extreme Index” in the tab bar at the top. The page shows the current Z-Score across all three timeframes, the full historical chart with deviation zones marked, and context statistics including the historical mean and standard deviation. The underlying data is sourced from Binance via public API.
Key Takeaways
BD Extreme Index explained above covers the full framework from Z-Score basics to practical usage. Here’s a quick summary:
- BD Extreme Index is a Z-Score measuring how far the current BD Pulse reading is from its historical average
- Five zones: Extremely Oversold (≤ −2σ), Oversold, Normal Range, Overbought, Extremely Overbought (≥ +2σ)
- Readings beyond ±2σ are statistically rare and have historically coincided with significant market turning points
- Best used alongside BD Pulse — BD Pulse tells you current conditions, BD Extreme Index tells you how unusual those conditions are
- Available in Daily, Weekly, and Monthly timeframes at blockdigest.io/bd-pulse/
Related Guides
- BD Pulse Explained — Understanding the underlying sentiment score
- MVRV Ratio — Where are we in the macro cycle?
- SOPR Explained — What are current holders doing right now?
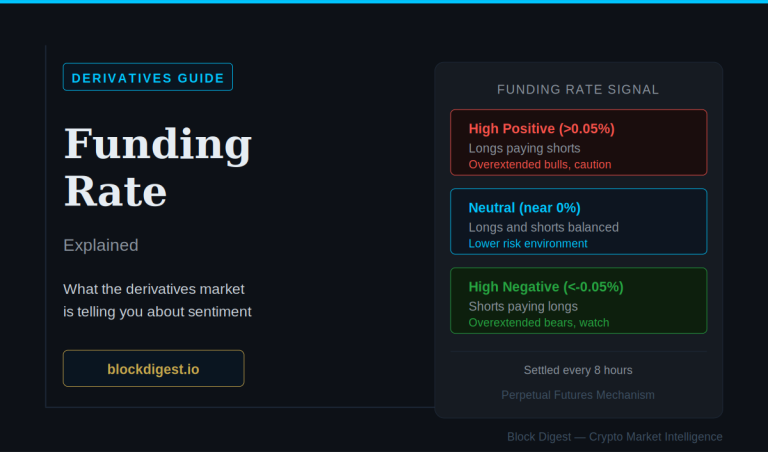
- Funding Rate Guide — What is the derivatives market signaling?
- BD Pulse (Live) — See the current score and BD Extreme Index reading
Disclaimer: This content is for informational purposes only and does not constitute financial advice. Cryptocurrency markets are highly volatile and unpredictable. All trading decisions should be made based on your own research and risk tolerance. Block Digest is not responsible for any financial losses incurred as a result of acting on this content.