Altcoin Daily Analysis: Bitcoin Dominance at 53.50%, Altcoins Face Distribution Pressure
Market Context
Bitcoin dominance sits at 53.50%, reflecting a continued rotation dynamic where BTC maintains a commanding share of total market cap, limiting meaningful altcoin outperformance in the near term. USDT dominance at 7.55% signals that a significant portion of capital remains parked on the sidelines, indicating cautious risk appetite rather than aggressive deployment into altcoins. The broader altcoin picture as of June 2, 2026 is one of sustained distribution pressure, with most major alts trading well below their respective 200-day EMAs and momentum indicators skewed bearish across multiple timeframes.
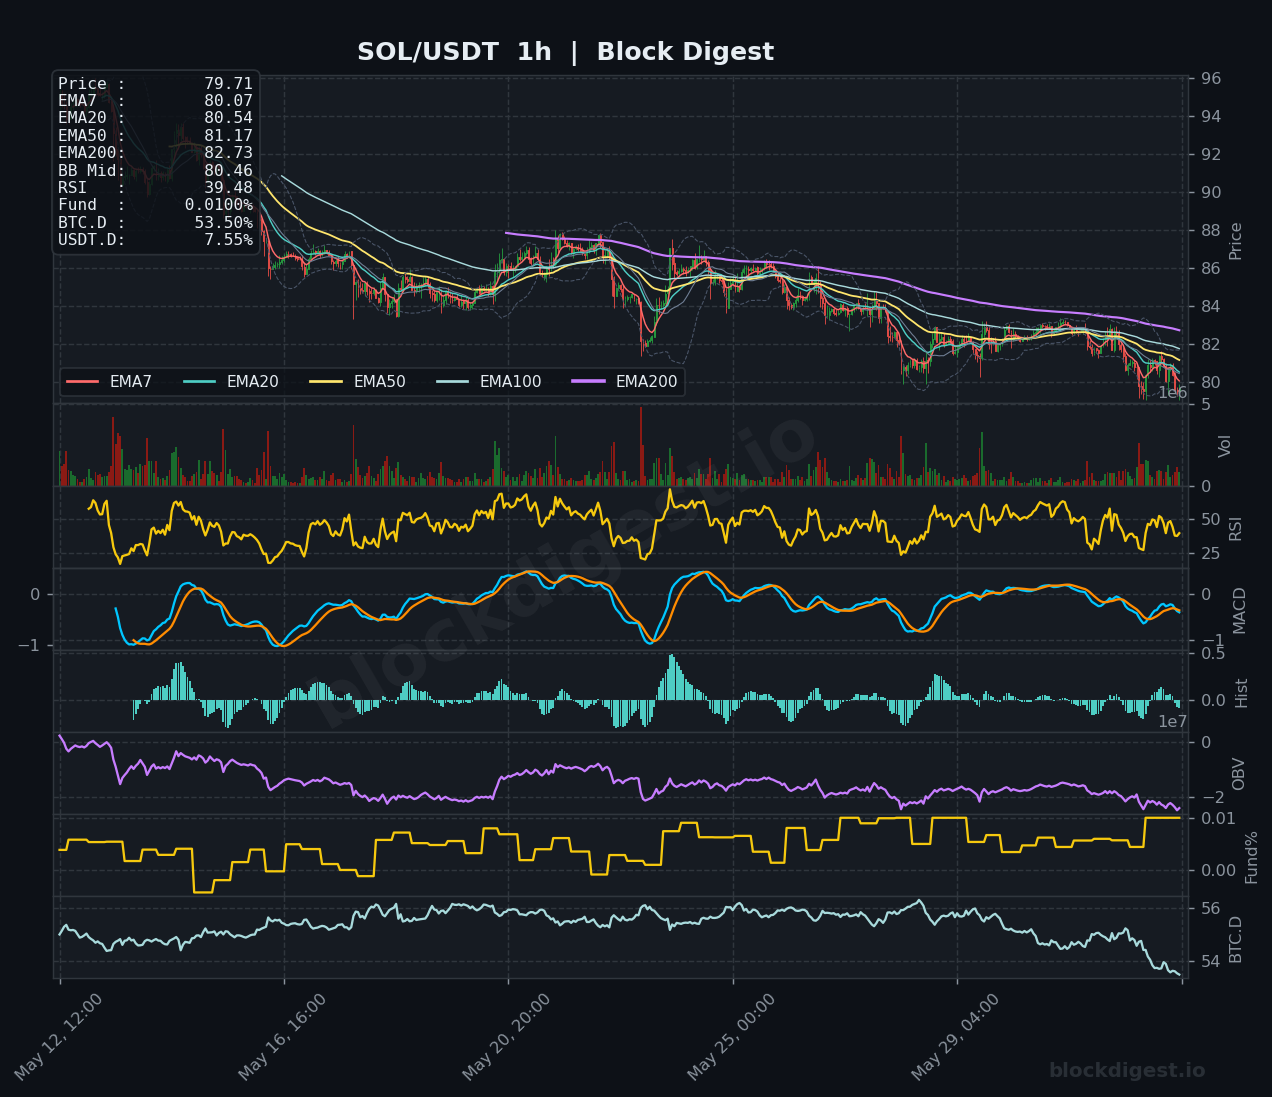
Solana (SOL)
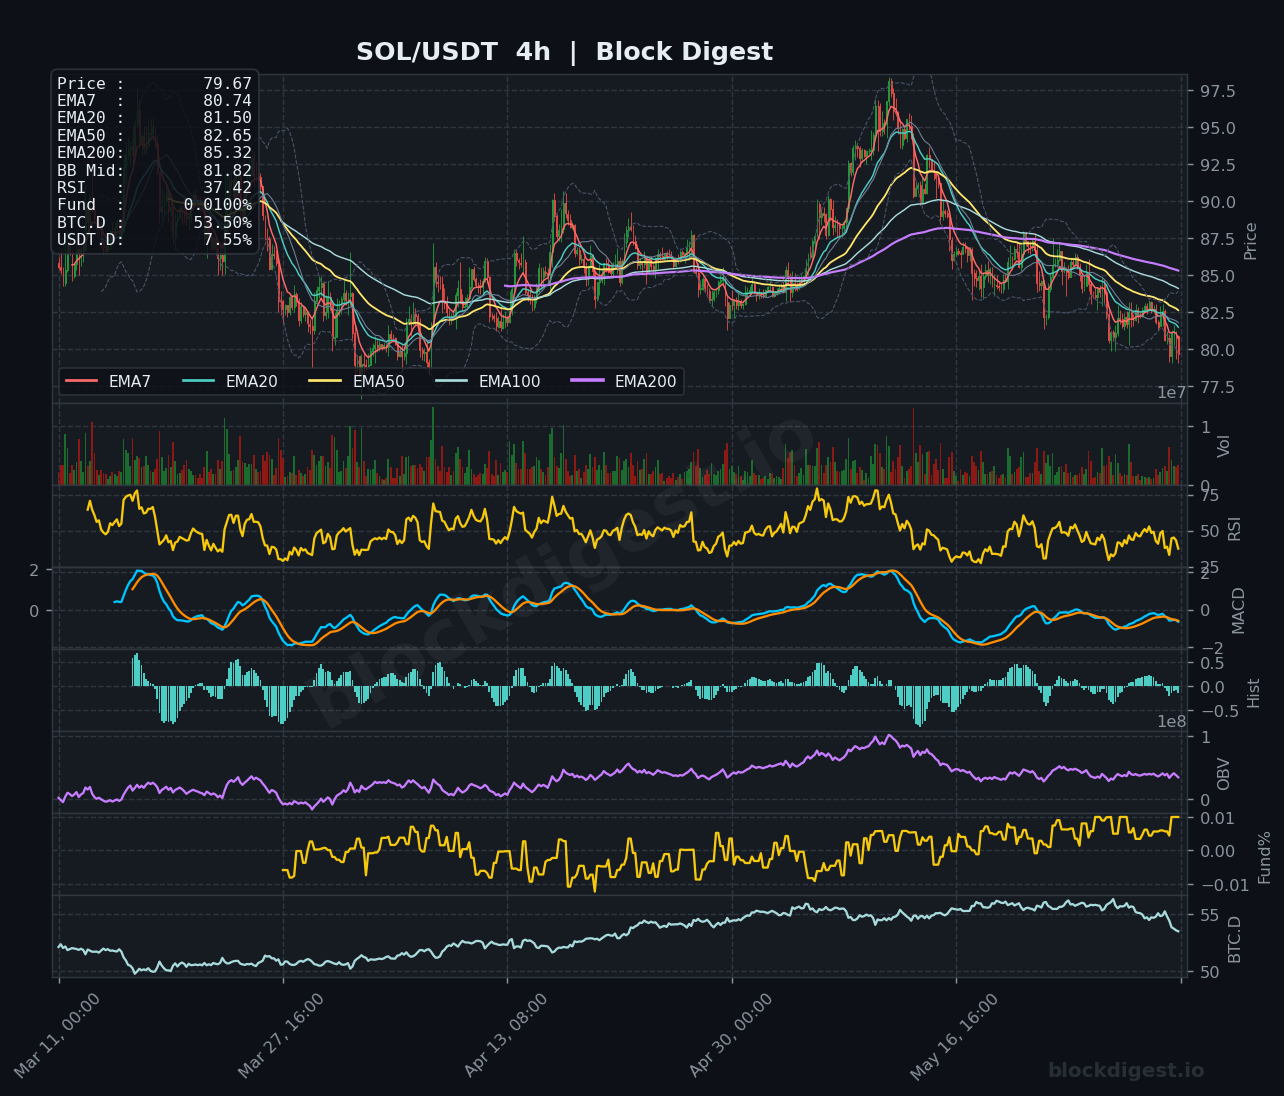
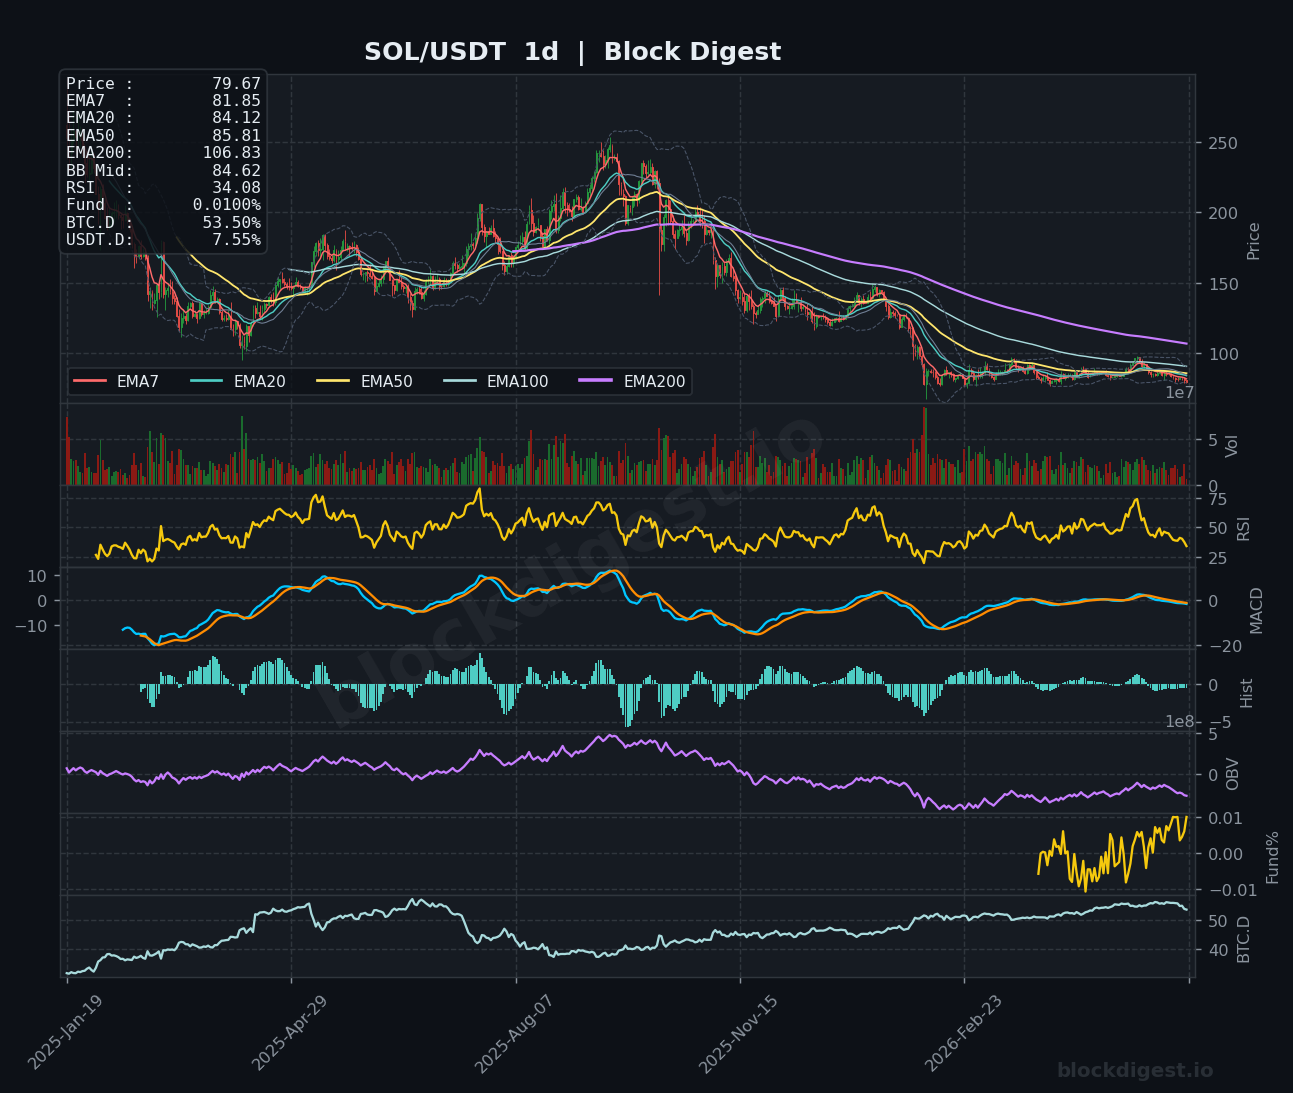
SOL is trading at $79.67, firmly below all major EMAs on the daily chart — the EMA7 at $81.85, EMA20 at $84.12, EMA50 at $85.81, and the EMA200 sitting far overhead at $106.83 — confirming a deeply entrenched downtrend. On the 4-hour chart, RSI reads 37.42 and MACD remains in bearish territory with the signal line still pointing lower, offering no credible reversal signal at present. The 1-hour RSI of 39.48 is approaching oversold conditions but has yet to produce any bullish divergence, while OBV continues to slope downward, indicating persistent selling pressure. Immediate resistance sits around $82–$83 (EMA7/EMA20 on the 4h), and a decisive daily close below $78 would open the door toward the $74–$75 range; bias remains bearish.
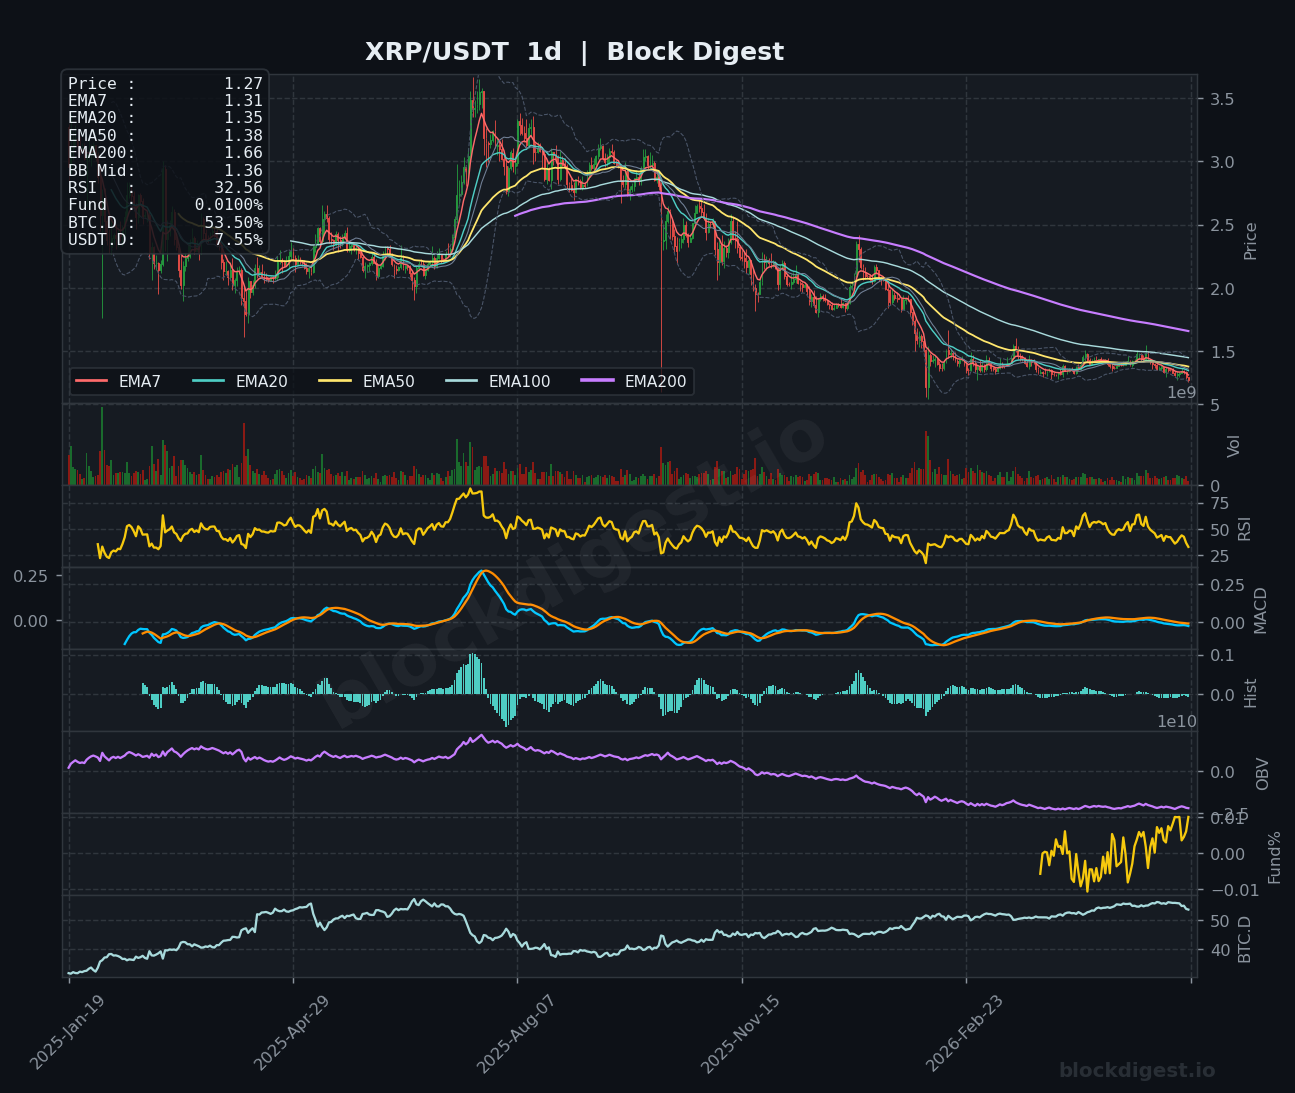
XRP (XRP)
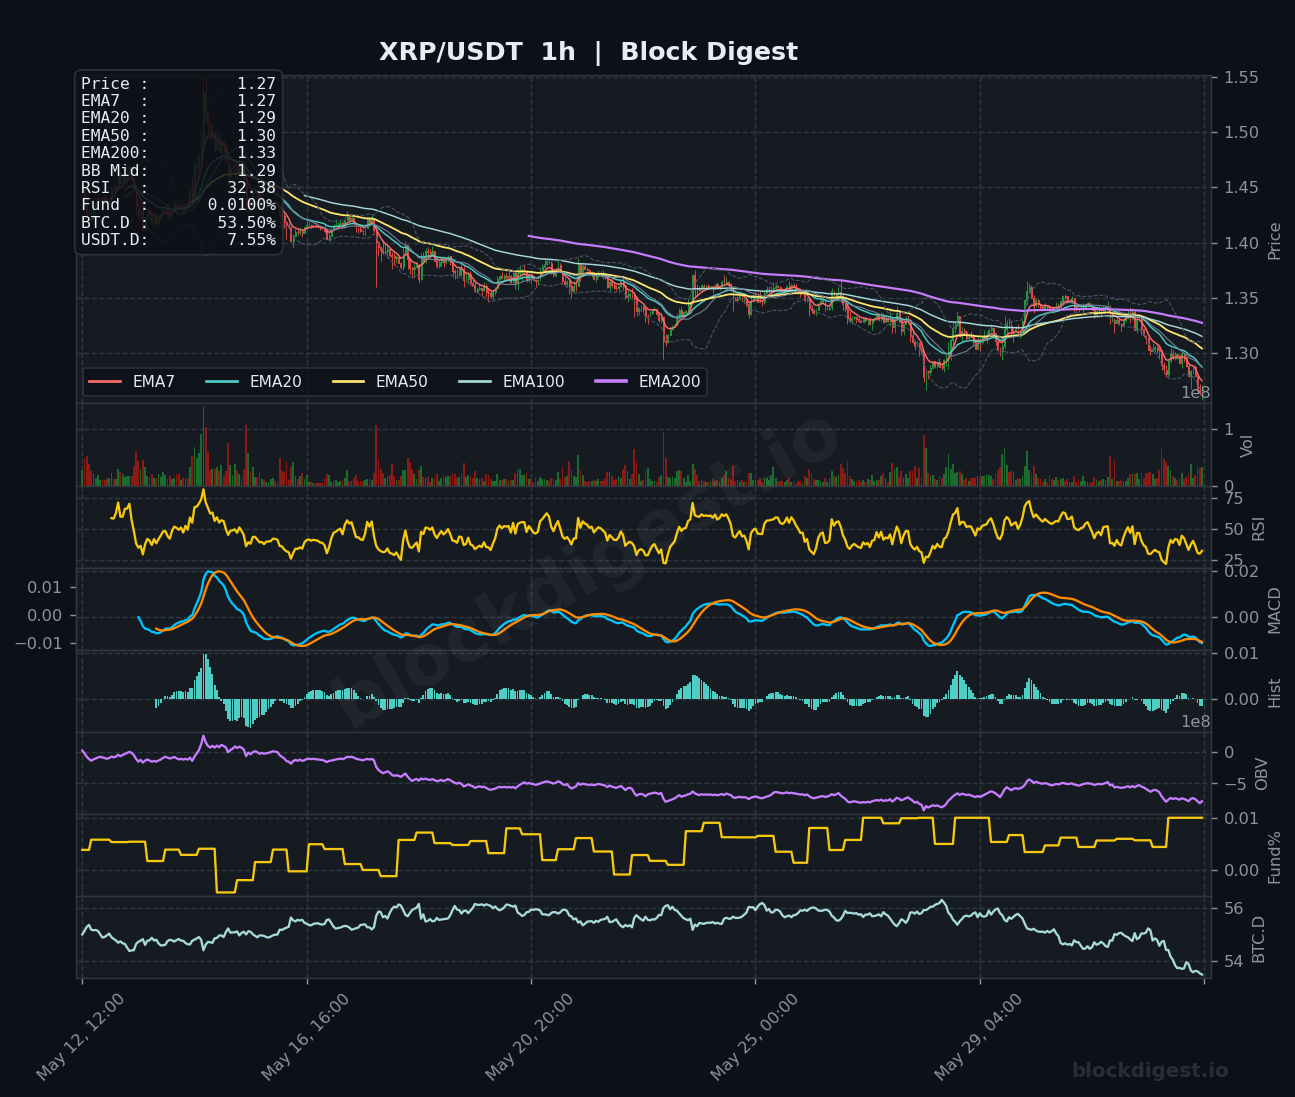
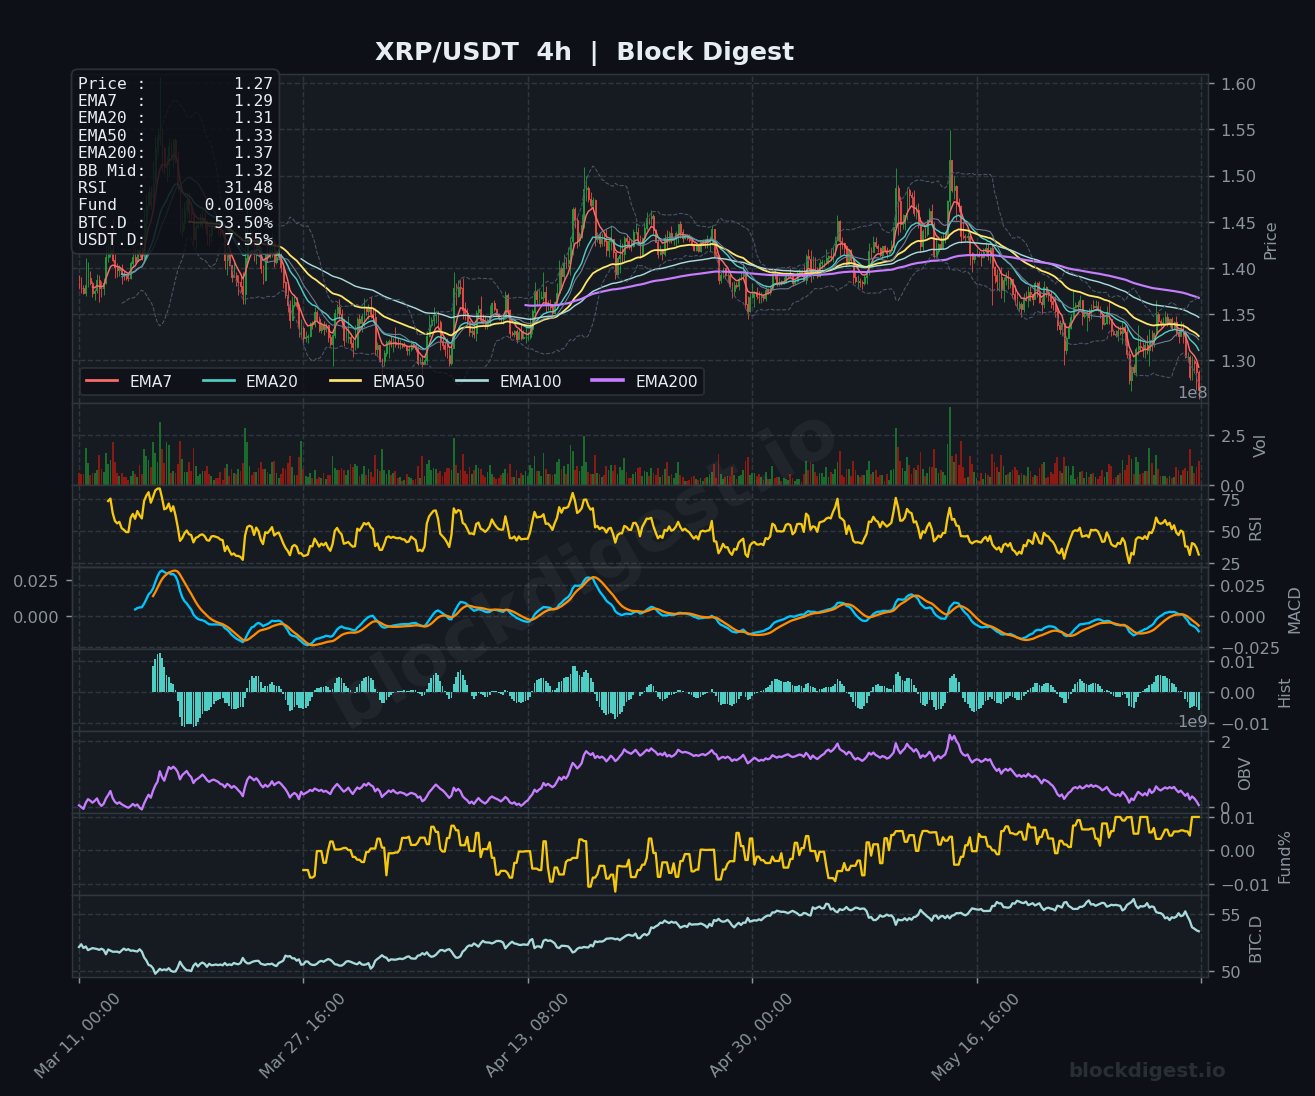
XRP is trading at $1.27, below its EMA7 ($1.31), EMA20 ($1.35), EMA50 ($1.38), and EMA200 ($1.66) on the daily chart, painting a consistently bearish structural picture since the macro top. The 4-hour RSI reads 31.48 and the MACD is pressing deeper into negative territory, with the histogram showing sustained red bars that suggest sellers retain control on the intermediate timeframe. On the 1-hour chart, RSI has dipped to 32.38 — near oversold — but OBV continues its steady decline, indicating that any bounce attempts are likely to be short-lived. Key support to watch is the $1.25 level; a breakdown there could accelerate toward $1.18–$1.20, while recovery above $1.33 (4h EMA20) would be the minimum requirement to shift sentiment near-term.
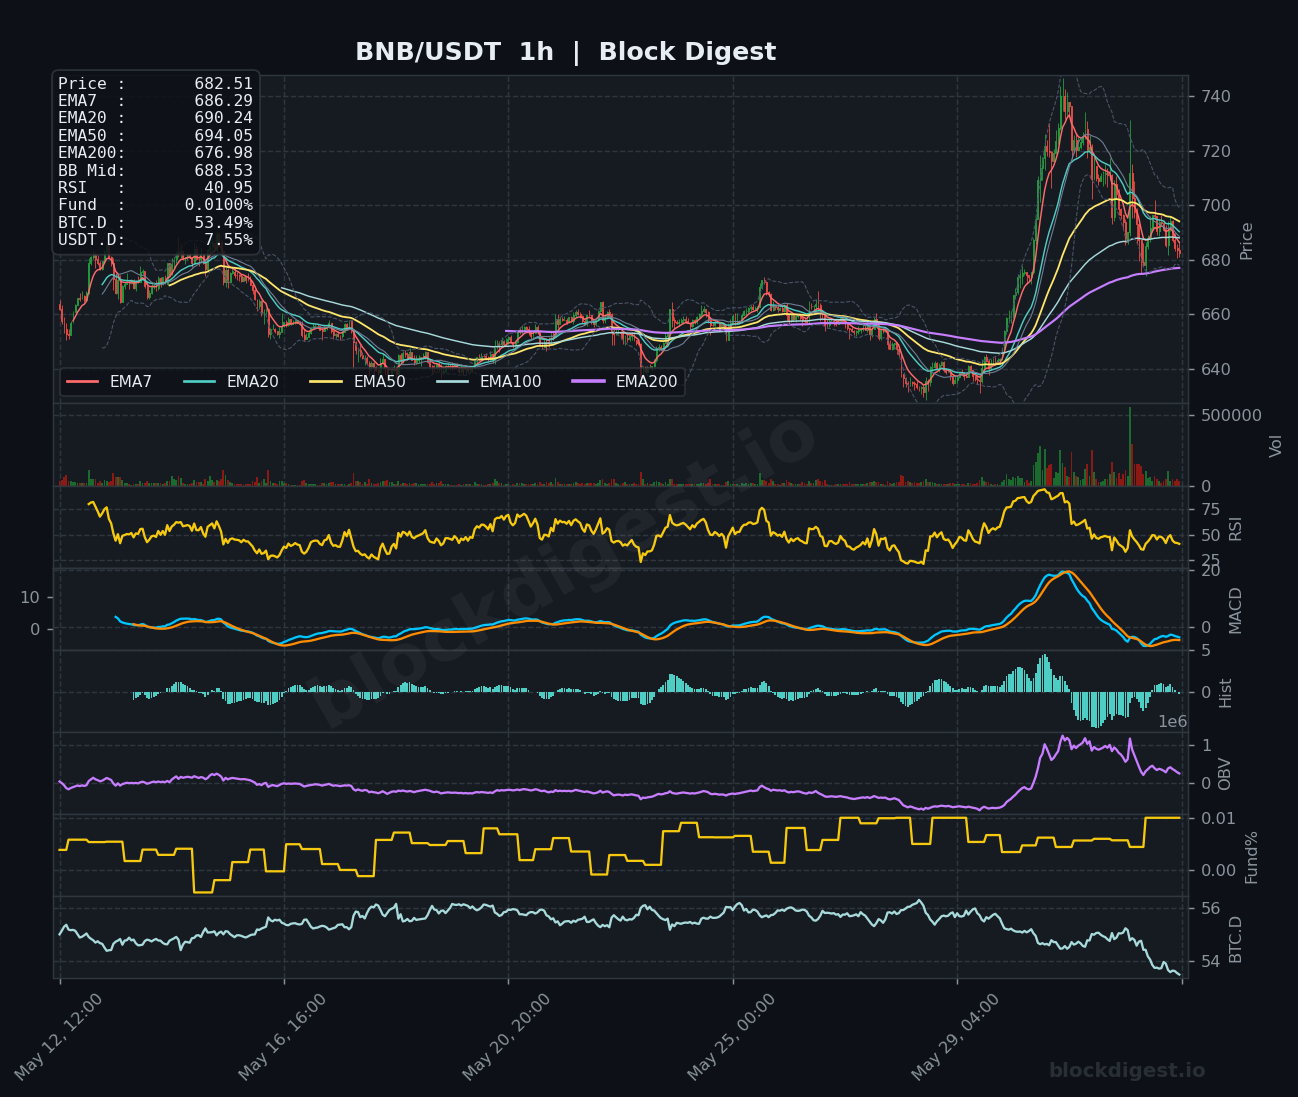
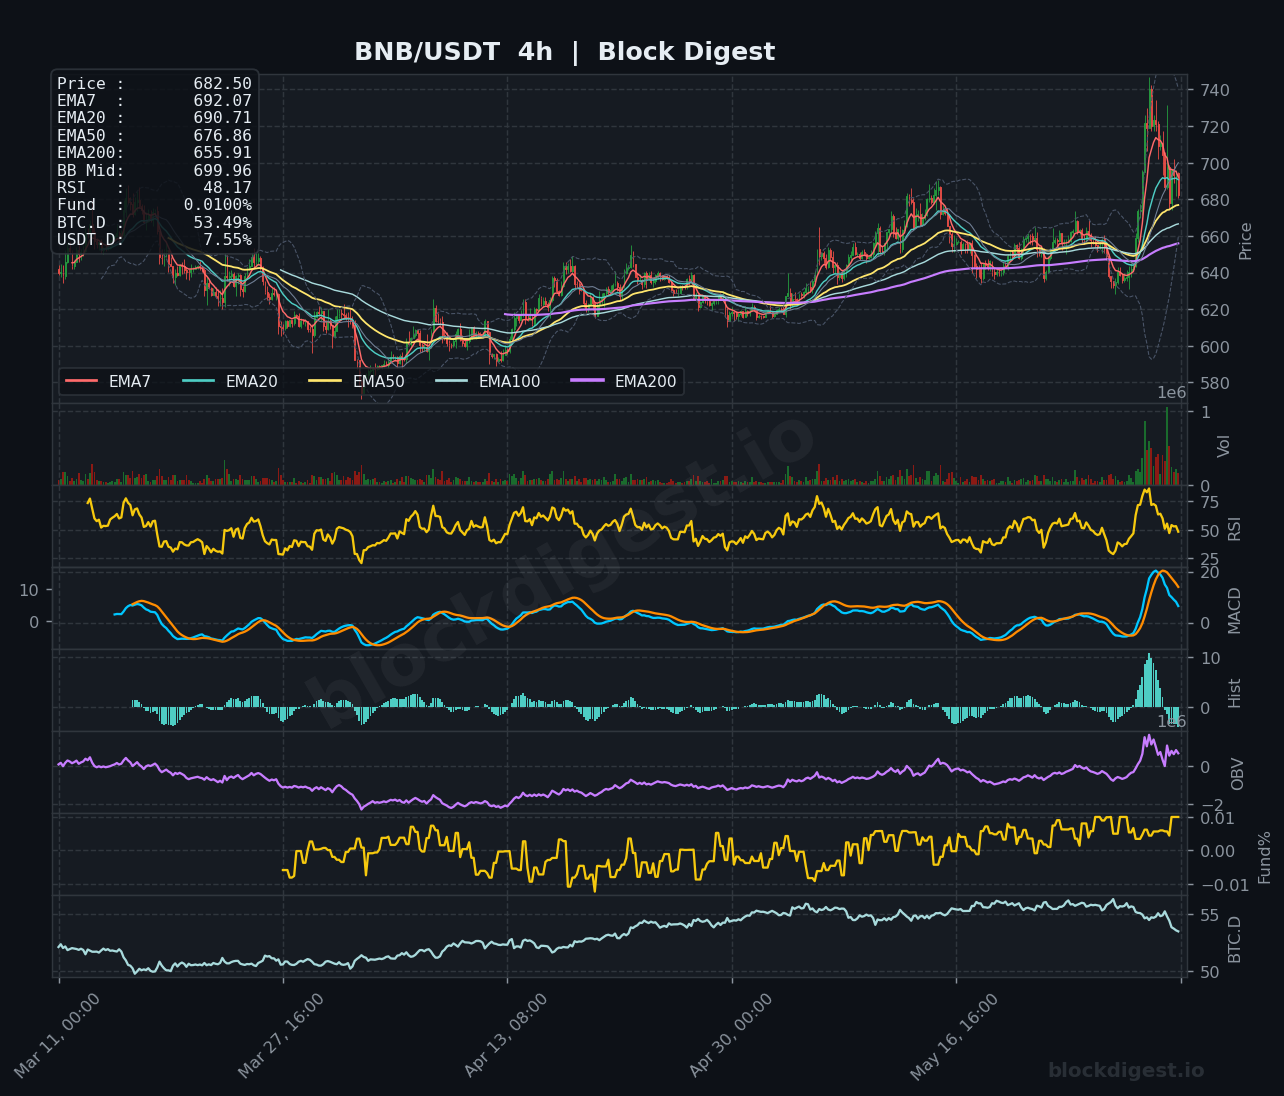
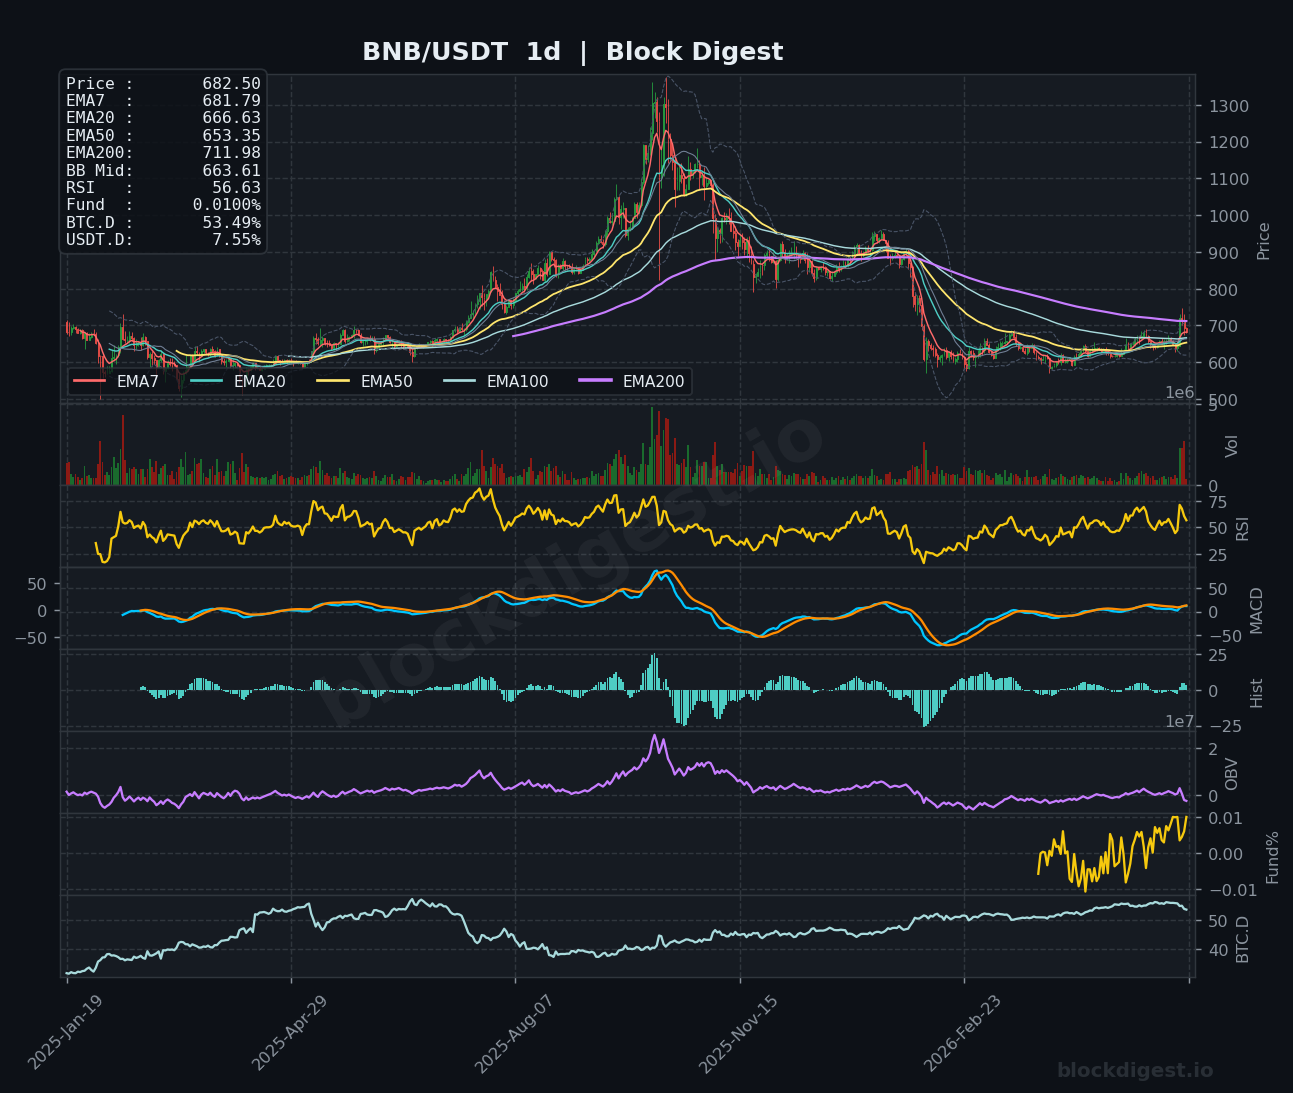
BNB (BNB)
BNB stands out as the relative strength leader among today’s reviewed assets, trading at $682.50 with the daily RSI holding at 56.63 — the only coin in this cohort above the 50 neutral line on that timeframe. Price is above the daily EMA7 ($681.79), EMA20 ($666.63), and EMA50 ($653.35), though it remains below the EMA200 ($711.98), which will serve as major overhead resistance on any continued rally. The 4-hour chart shows price pulling back from a recent spike high near $740, with RSI cooling to 48.17 and MACD beginning to roll over — suggesting a healthy consolidation phase rather than an immediate reversal. Support on the 4-hour is clustered around the $670–$676 zone (EMA20/BB Mid); holding this level keeps the medium-term bullish structure intact, while a break below $655 (4h EMA50) would be cause for concern.
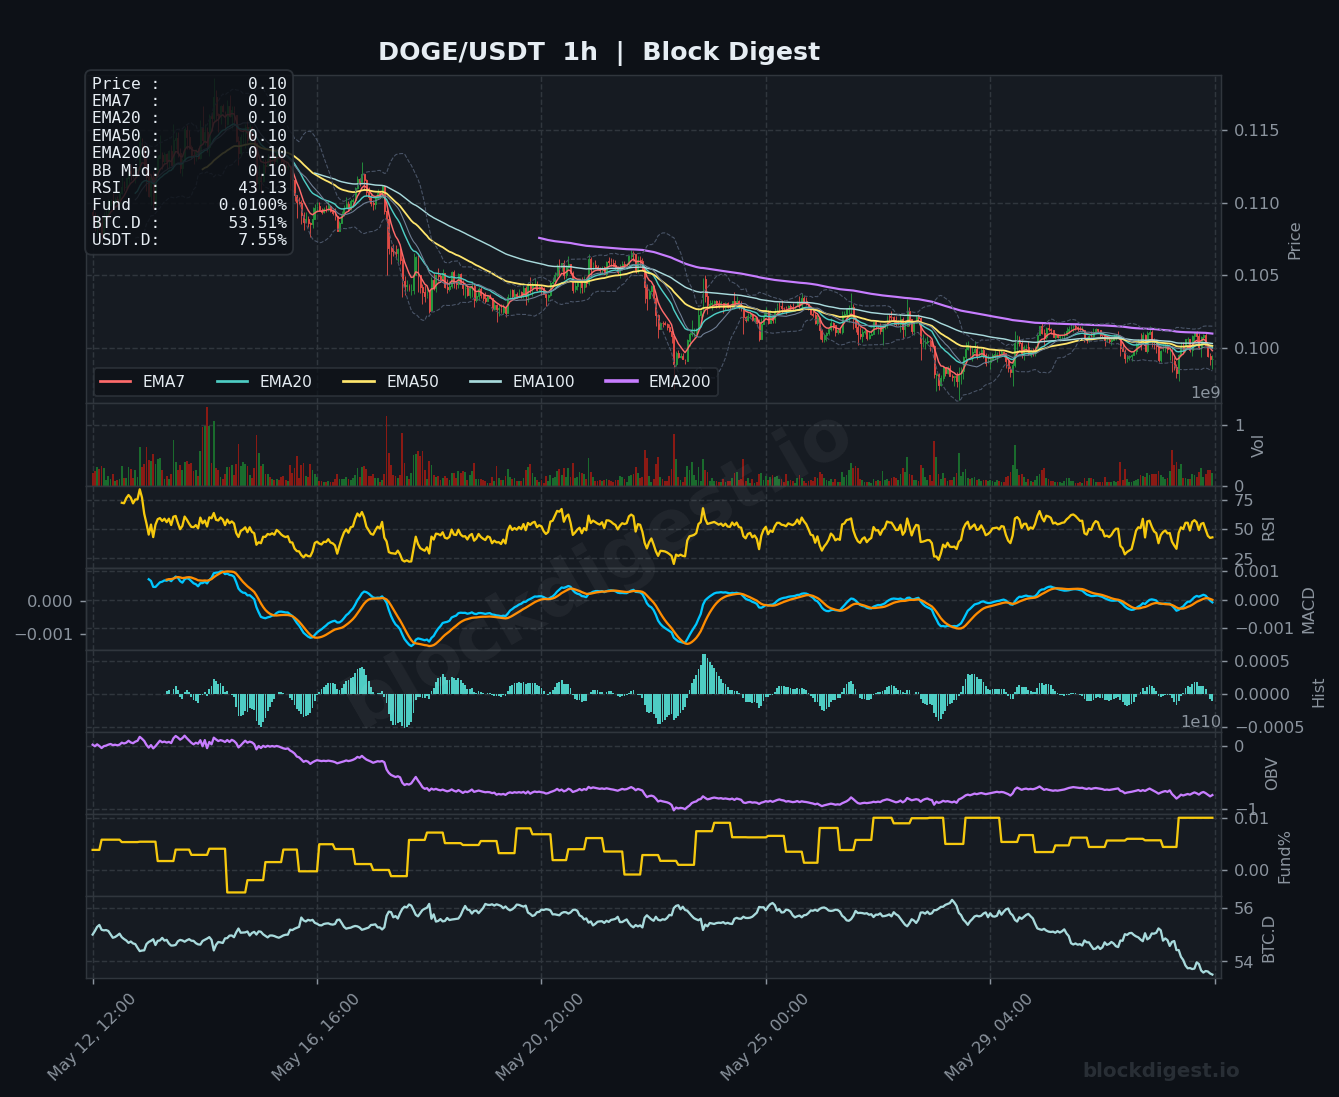
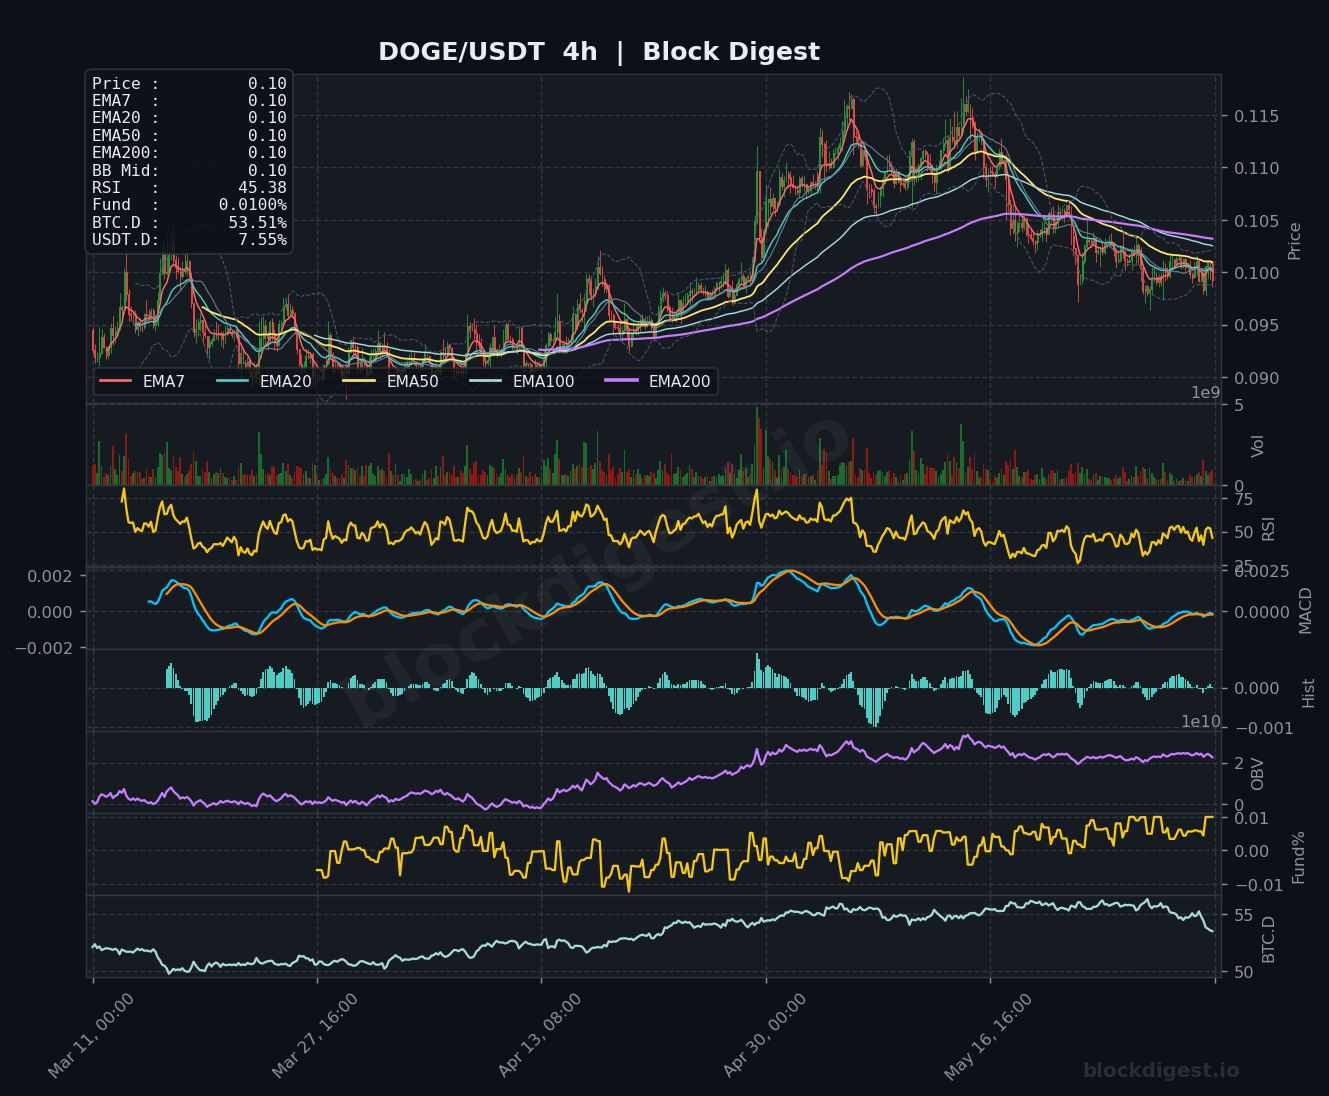
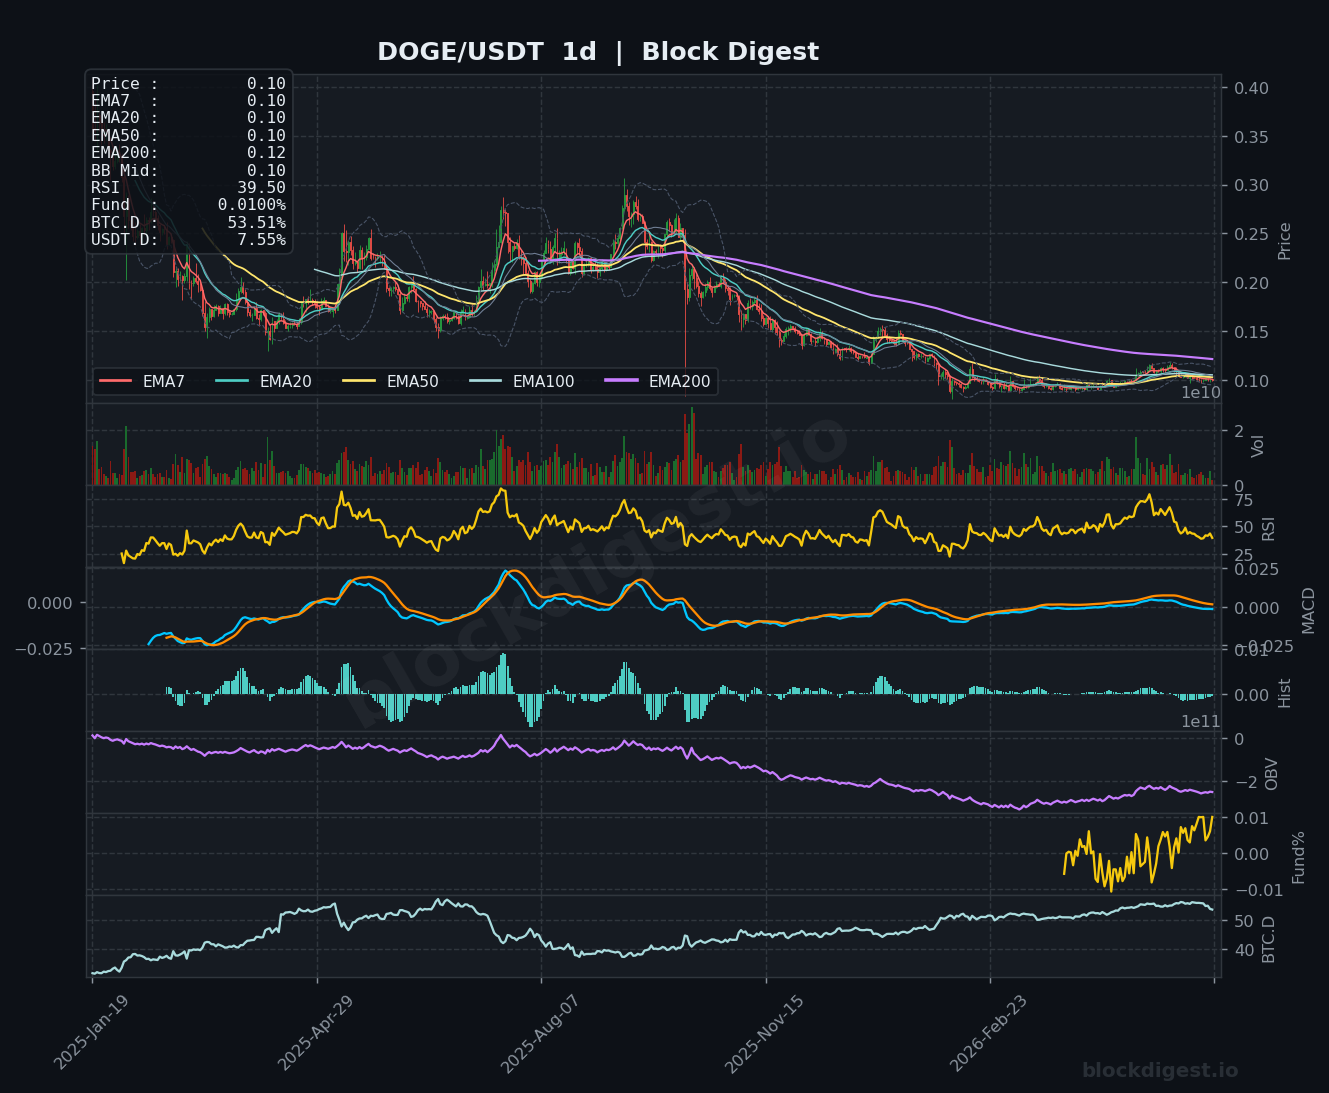
Dogecoin (DOGE)
DOGE is trading at $0.100, with all short-term EMAs (EMA7 through EMA100) compressed tightly around the same $0.10 level on both the 1-hour and 4-hour charts, reflecting a low-energy consolidation after a prolonged downtrend from the $0.25+ highs. The daily RSI reads 39.50 and the MACD histogram has flatlined near zero, indicating that bearish momentum has decelerated but a bullish catalyst is still absent. On the 4-hour chart, RSI at 45.38 shows a mild recovery attempt, yet OBV remains flat-to-declining and the EMA200 ($0.12 daily) provides significant overhead pressure. The $0.098–$0.100 range represents a key structural support zone; a confirmed breakdown below $0.097 would signal renewed selling pressure, while reclaiming $0.105 on volume would be the first constructive sign.
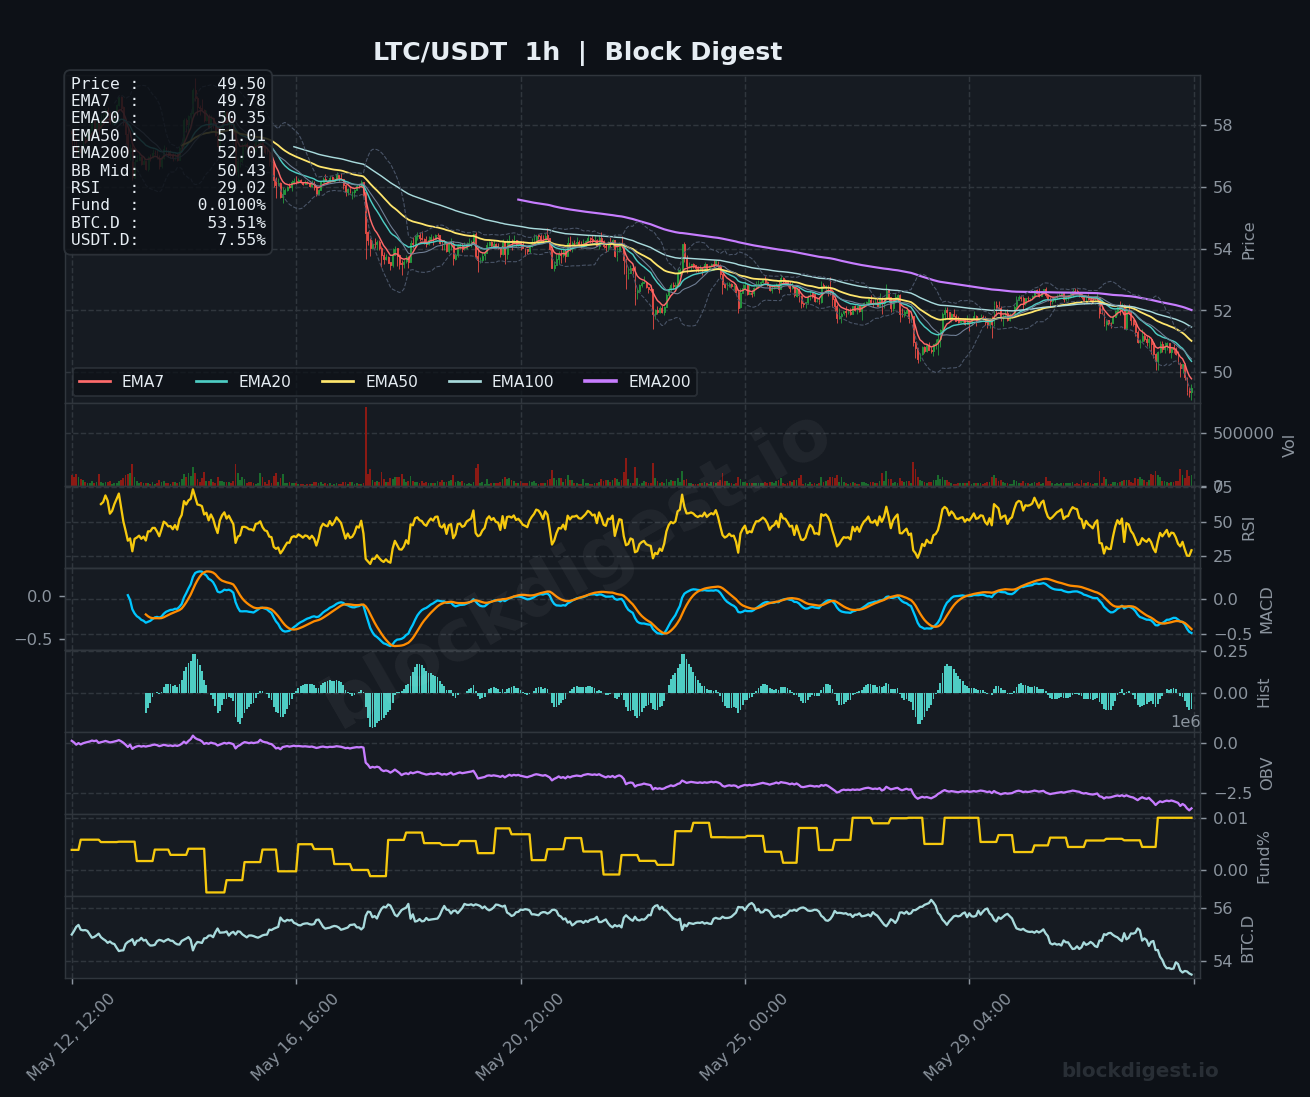
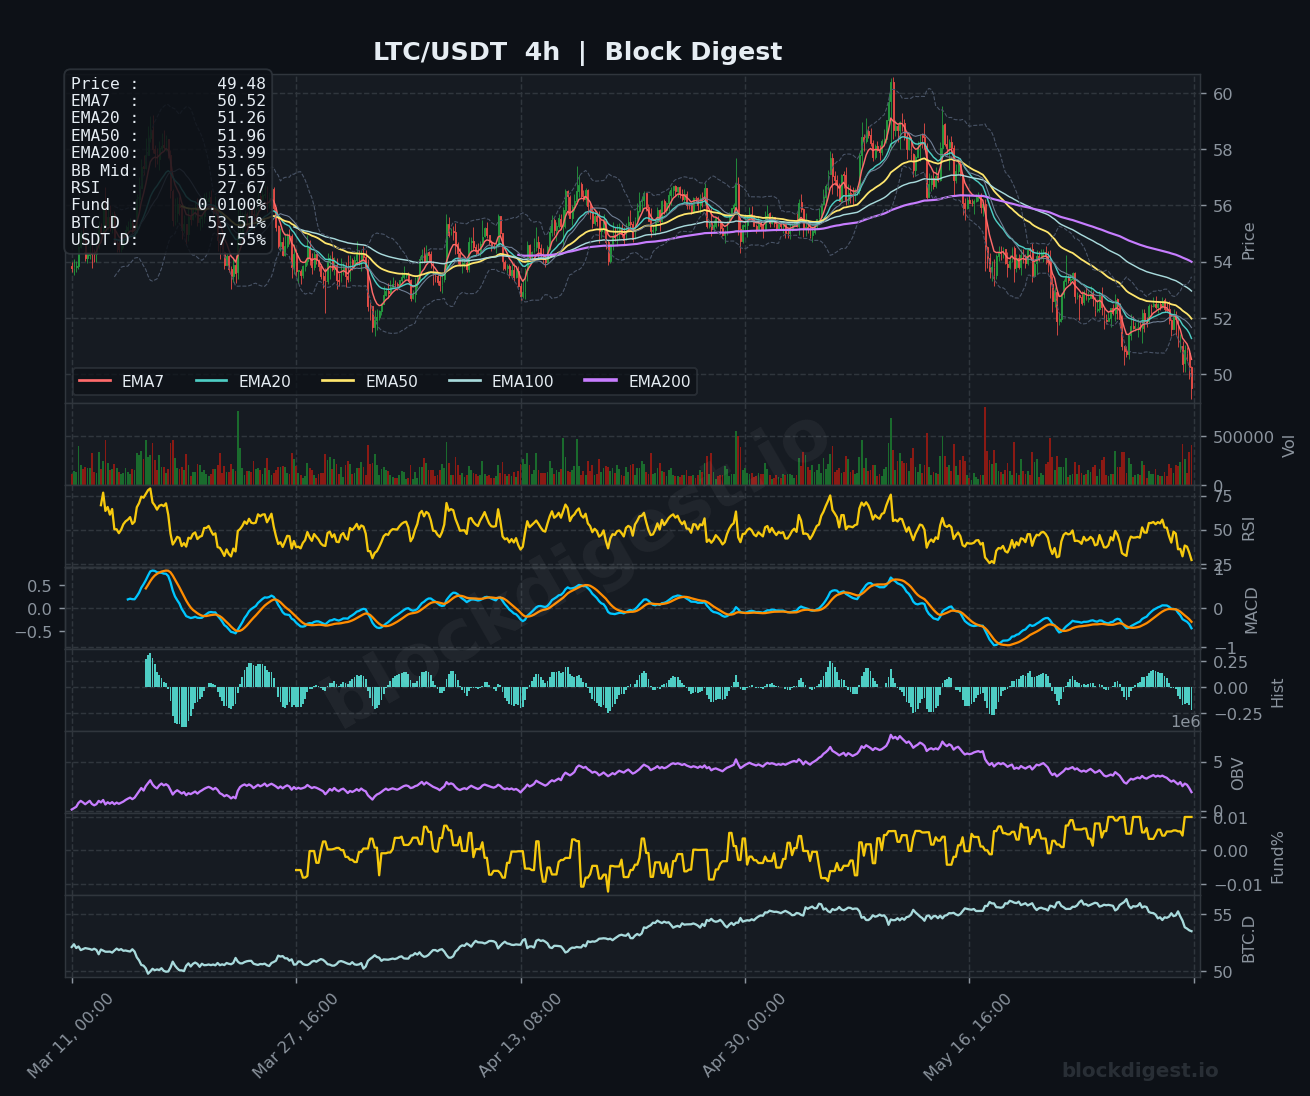
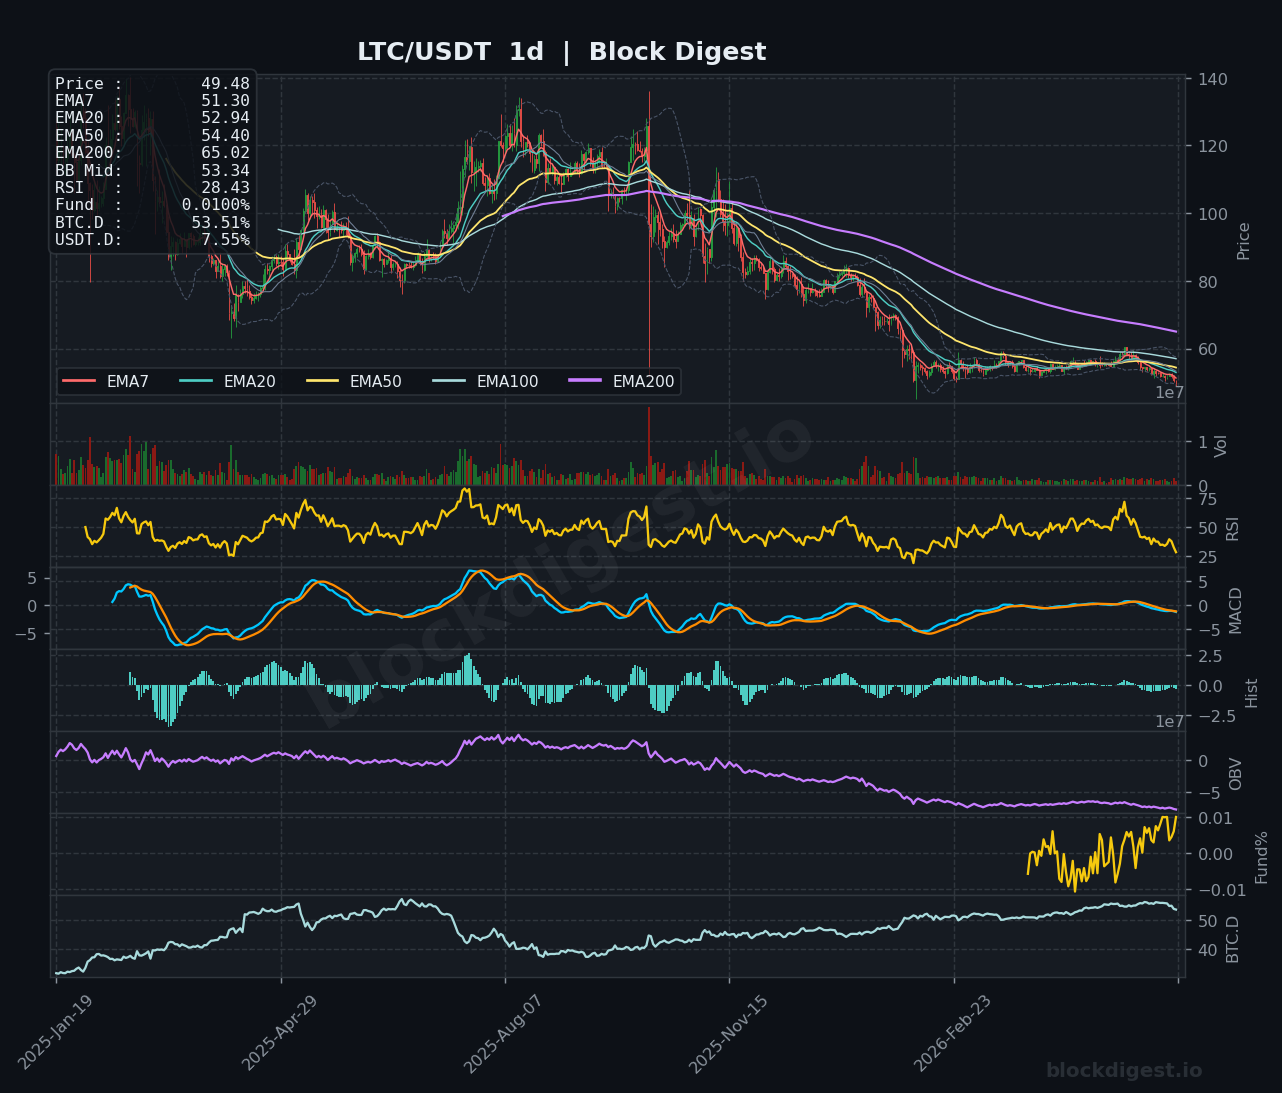
Litecoin (LTC)
LTC is one of the weakest performers in today’s review, trading at $49.48 with a daily RSI of 28.43 — firmly in oversold territory — and price trading below all major EMAs, including EMA7 ($51.30), EMA20 ($52.94), EMA50 ($54.40), and the far-overhead EMA200 ($65.02). The 4-hour RSI has deteriorated to 27.67, also deeply oversold, while the MACD on that timeframe continues to produce negative histogram bars with no sign of a bullish cross materializing. The 1-hour RSI at 29.02 confirms the coin is in an extreme short-term oversold condition, which may invite a technical bounce toward $51–$52, but the trend structure is firmly bearish across all timeframes. Until LTC can recover above the $52–$53 region with volume confirmation, any relief rally should be treated as a counter-trend move within a broader downtrend.
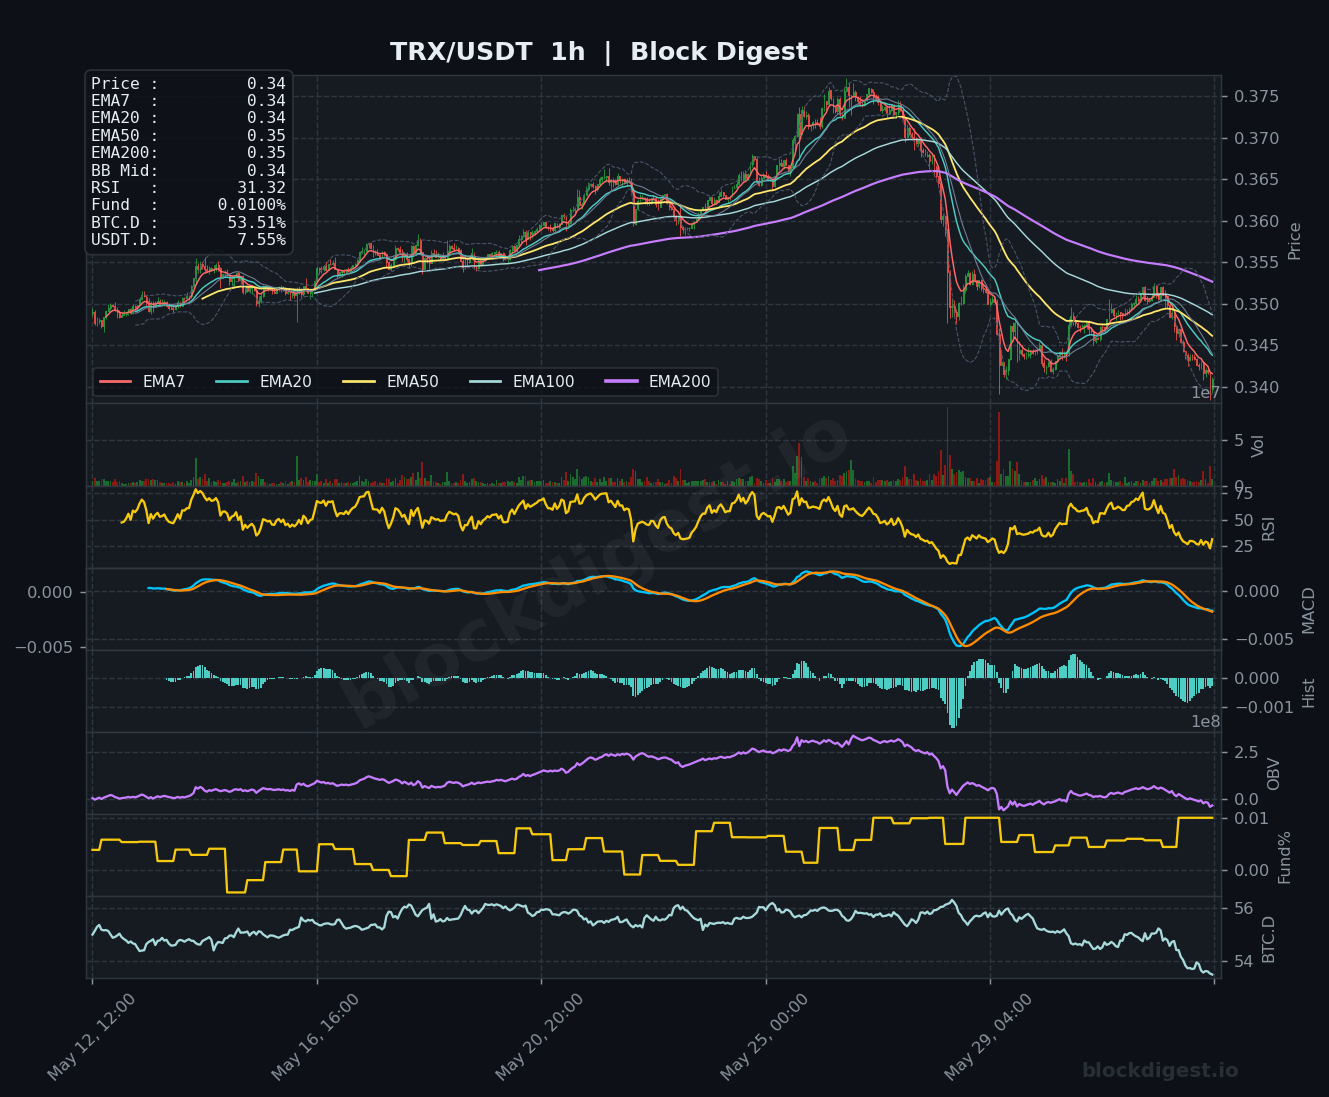
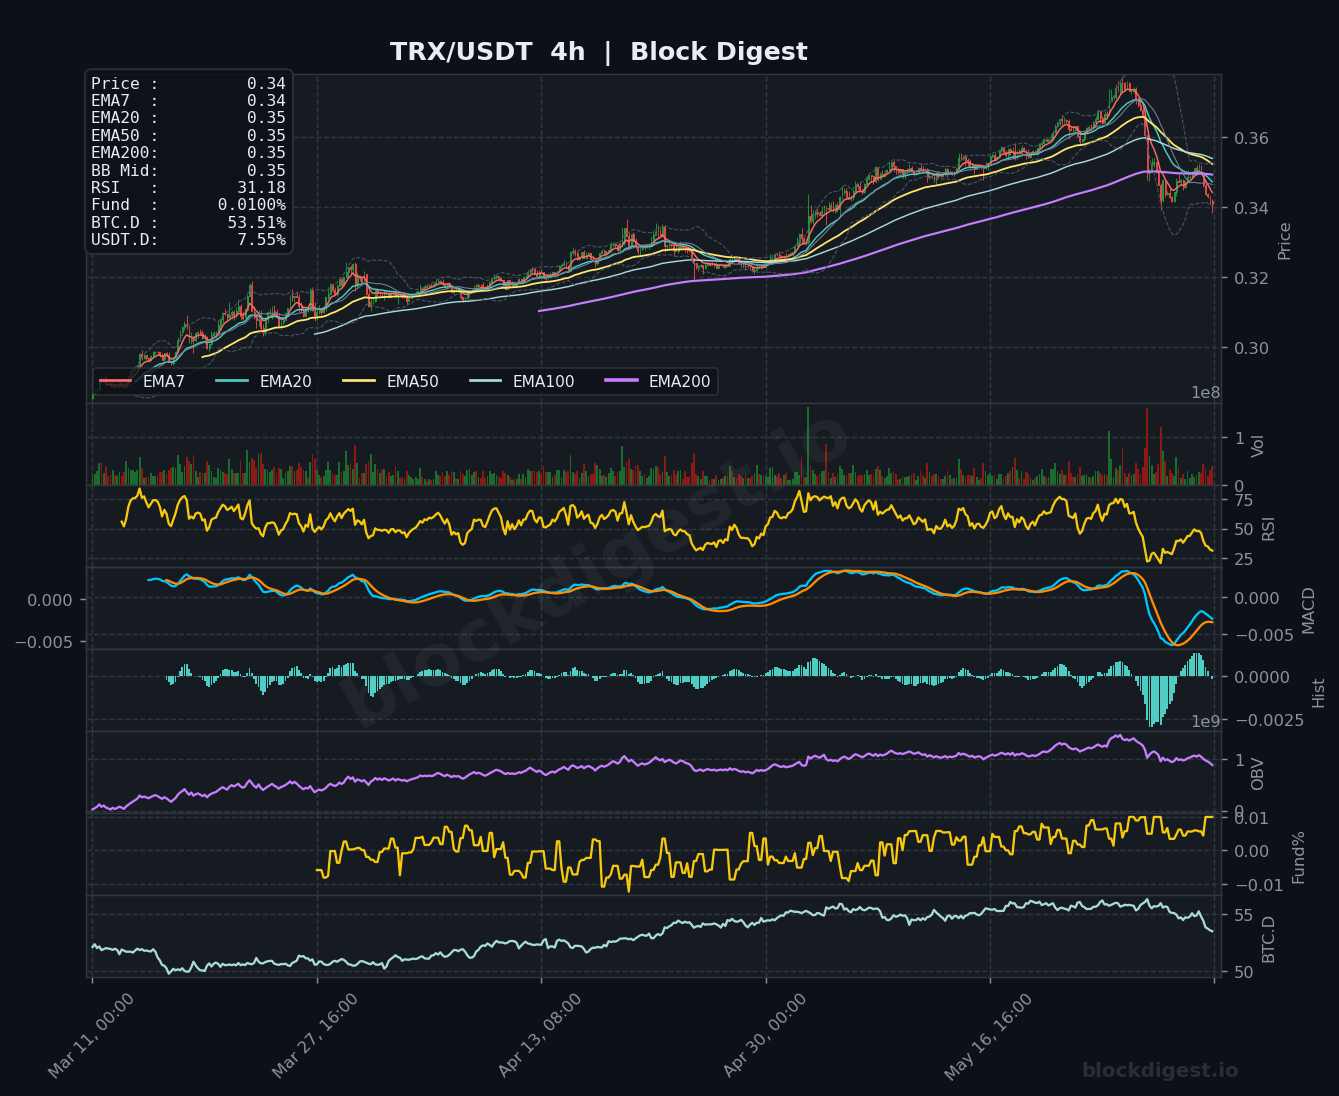
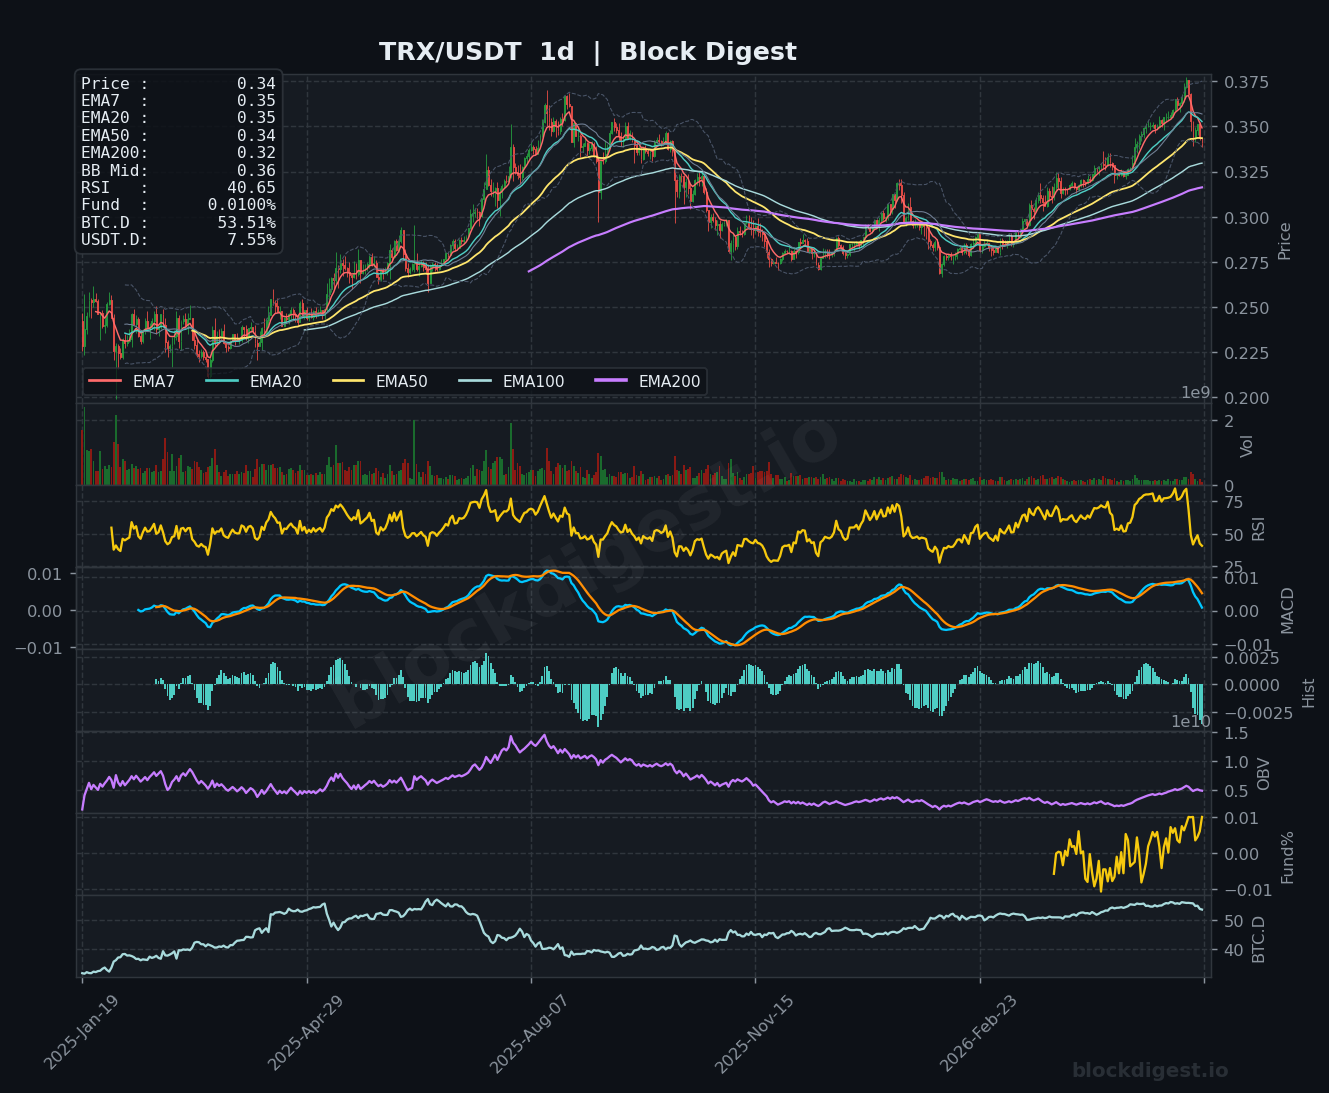
TRON (TRX)
TRX presents a more nuanced picture than most peers — the daily chart shows price at $0.34, with the EMA50 ($0.34) and EMA200 ($0.32) acting as near-term support, and the daily RSI still relatively healthier at 40.65 compared to coins like LTC and SOL. However, the 4-hour chart tells a more cautionary tale: after a sustained multi-month uptrend from the $0.28 range to a recent peak near $0.375, TRX has sharply reversed, with the 4-hour RSI dropping to 31.18 and MACD printing a steep bearish cross with notable histogram expansion to the downside. The 1-hour RSI at 31.32 and declining OBV reinforce the short-term bearish bias following the recent distribution event. Key support is at $0.335–$0.340; a sustained break below $0.330 would negate the longer-term uptrend structure visible on the daily, making that level a critical line in the sand for TRX holders.
Altcoin Outlook
The altcoin space as of June 2, 2026 is broadly under pressure, with BNB the clear outlier displaying meaningful structural strength relative to its peers — it is the only asset in this group maintaining a bullish posture on the daily timeframe above key short- and medium-term EMAs. SOL, XRP, DOGE, and LTC remain mired in established downtrends with little technical evidence of trend reversal, while TRX has recently rolled over from multi-month highs and enters a critical test of support. The combination of elevated USDT dominance at 7.55% and BTC dominance holding near 53.5% suggests the macro environment is not yet conducive to a broad altcoin recovery, and traders should prioritize capital preservation until clearer rotation signals emerge. Watch for USDT.D breaking below 7% and BTC.D declining meaningfully as prerequisite conditions for a sustained altcoin rally; until then, LTC and XRP carry the most immediate downside risk while BNB remains the only asset with a constructive near-term setup.
Disclaimer: This analysis is for informational purposes only and does not constitute financial advice. Cryptocurrency markets are highly volatile and unpredictable. All trading decisions should be made based on your own research and risk tolerance. Block Digest is not responsible for any financial losses incurred as a result of acting on this content.