Bitcoin Daily Analysis: Support at $70K as EMAs Break Bearish
Market Overview
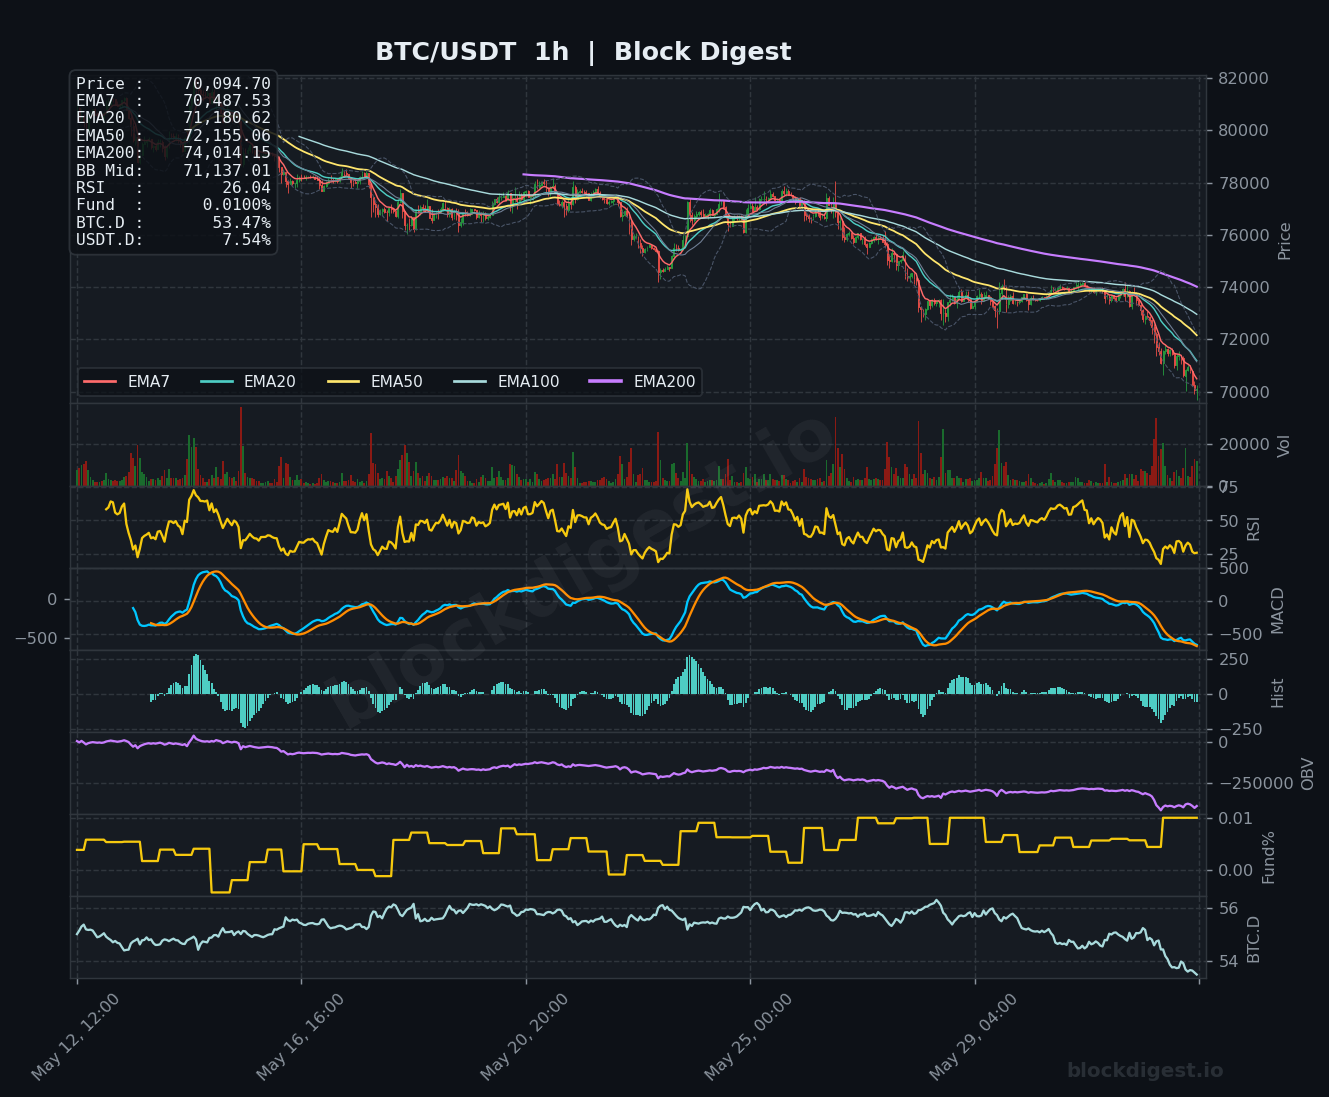
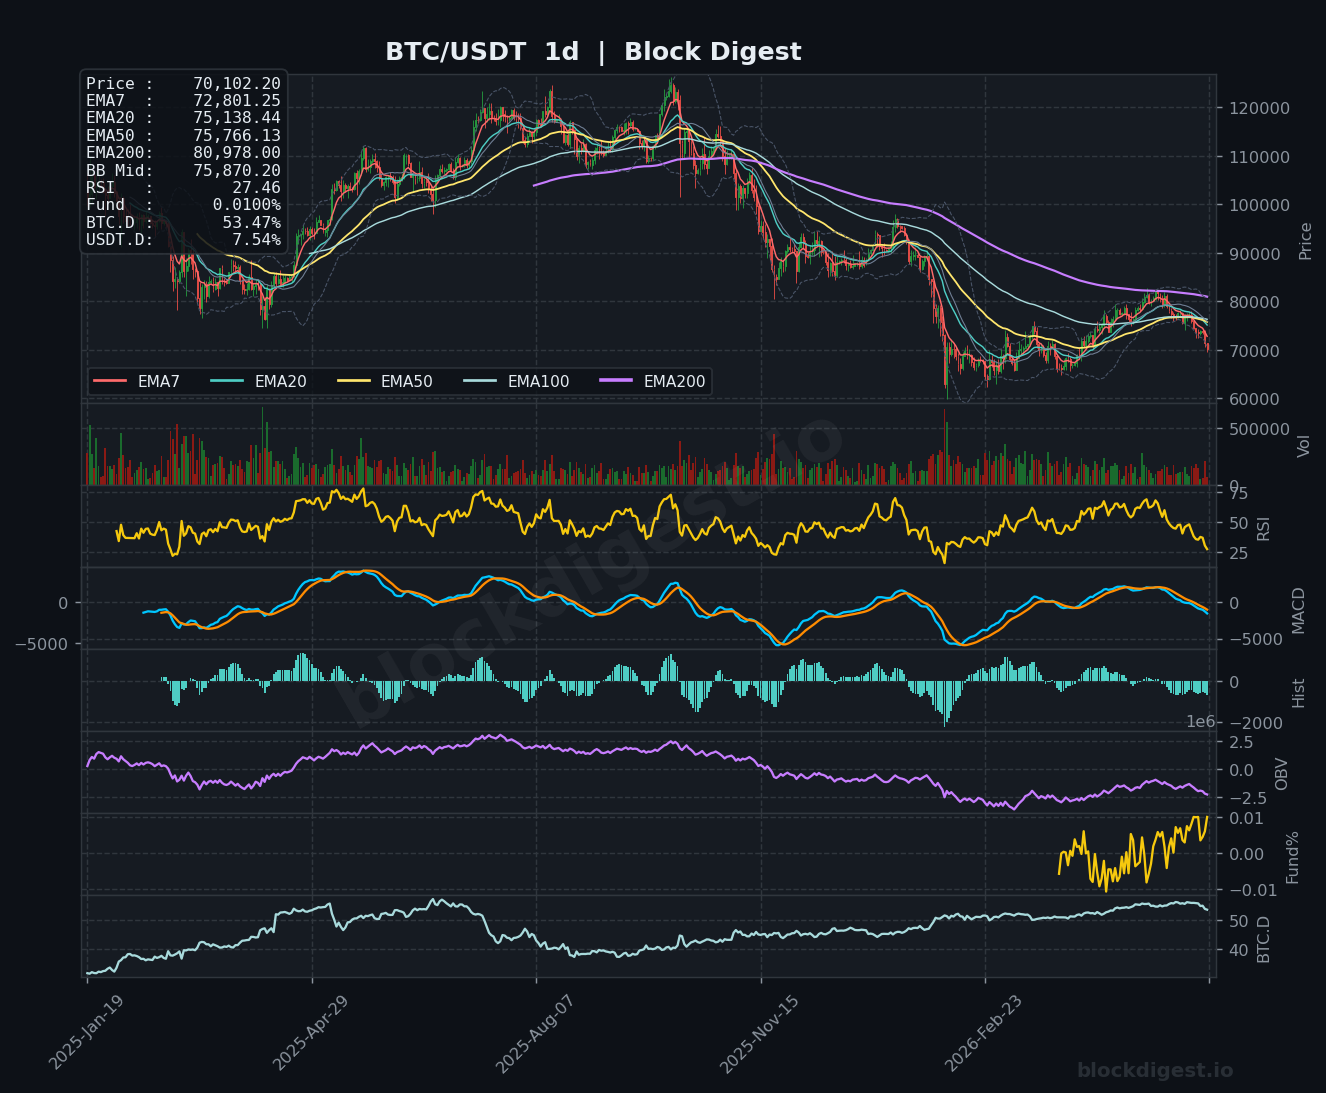
Bitcoin is trading at approximately $70,094–$70,102, pressing against a critical psychological support zone as sellers maintain firm control of price action. On the daily timeframe, BTC has broken decisively below all major EMAs — with the EMA7 at $72,801, EMA20 at $75,138, EMA50 at $75,766, and the EMA200 sitting far above at $80,978 — confirming a deeply bearish structural alignment. Price is currently trading well below the Bollinger Band midline of $75,870, and the lower band is beginning to expand downward, reflecting accelerating volatility to the downside. The dominant daily trend remains unambiguously bearish, with no meaningful recovery attempt yet visible following the reversal from the October 2025 all-time high of $126,210.
Multi-Timeframe Confluence
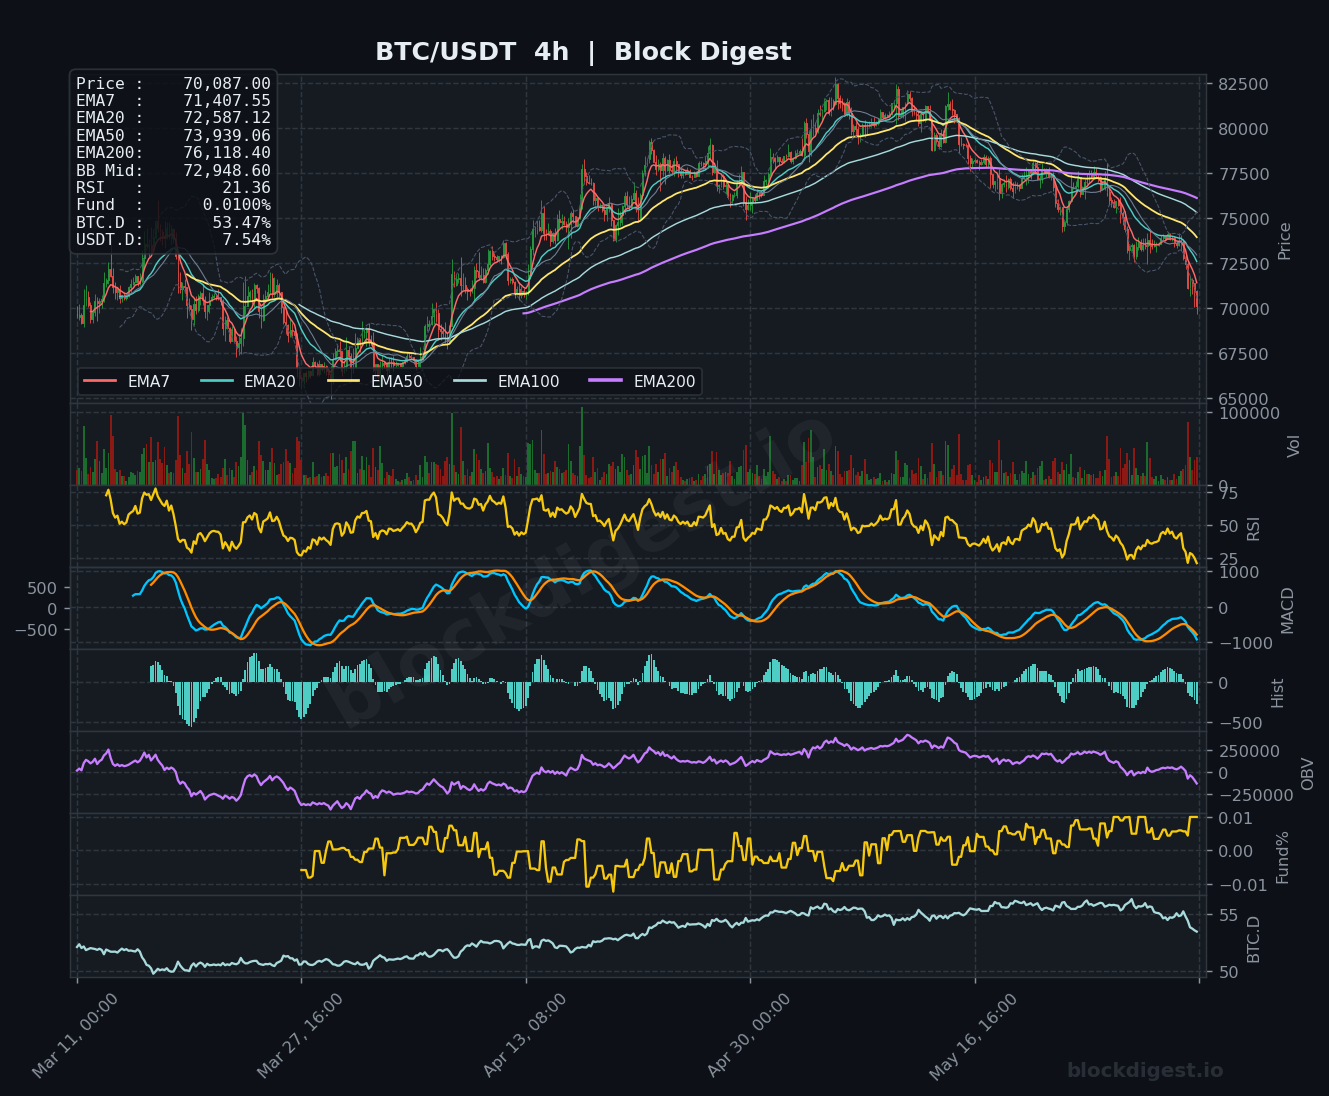
All three timeframes are in rare and damaging alignment — every EMA stack from the 1-hour through the daily is in full bearish order, with shorter-term averages below longer-term ones across the board. On the 4-hour chart, price has collapsed through the EMA200 at $76,118 and is trading approximately $2,000 below the EMA7 at $71,407, underscoring the strength of the current downswing. The 1-hour chart shows price at $70,094, which sits beneath all five EMAs and is approaching the $70,000 psychological level — a zone that held briefly in prior tests but now faces serious pressure. There is no short-term momentum divergence yet on the lower timeframes that would suggest an imminent meaningful relief rally.
Key Levels to Watch
- Resistance: $71,180 — the 1h EMA20, acting as the first overhead barrier and likely area where any dead-cat bounce gets faded; $72,155–$72,587 — the 1h EMA50 and 4h EMA20 confluence zone, a significant area sellers would need to defend; $73,939 — the 4h EMA50, a level that would need to be reclaimed on a closing basis before any structural recovery case could be made.
- Support: $70,000 — major round-number psychological support and a high-volume reference level that the market is actively testing; $68,500–$69,000 — estimated lower Bollinger Band region on the daily chart where mean-reversion buyers may attempt entries; $65,000–$66,000 — a deeper structural support zone visible on the daily, representing a prior consolidation base from early 2025.
Momentum & On-Chain Signals
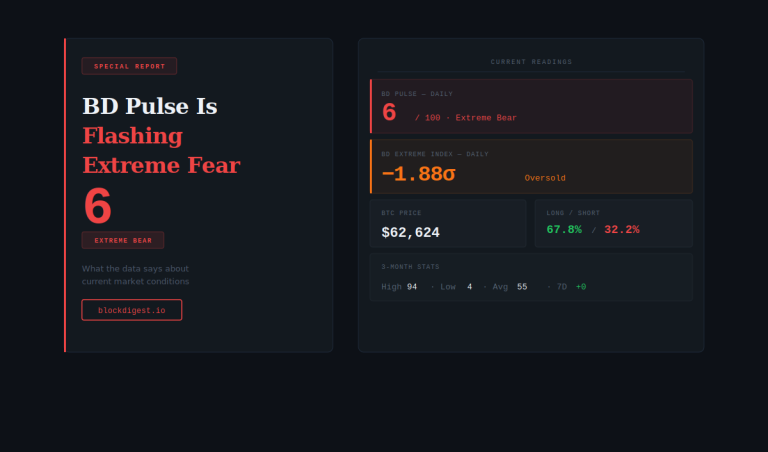
RSI readings are deeply oversold across all timeframes — 26.04 on the 1-hour, 21.36 on the 4-hour, and 27.46 on the daily — placing price in extreme oversold territory not frequently sustained for extended periods, though oversold conditions can persist in trending bear markets. The MACD on both the 4-hour and daily timeframes shows the signal and MACD lines deeply negative with histogram bars still expanding to the downside, indicating no crossover is imminent. OBV on the daily chart has been in a persistent downtrend, confirming that this sell-off is volume-backed distribution rather than a low-liquidity drift, aligning with the reported $3.45 billion in ETF net outflows over 11 sessions. Funding rates remain marginally positive at 0.01%, suggesting some long-side stubbornness that, if squeezed, could accelerate the move toward $68,500.
BTC Dominance & Market Sentiment
BTC dominance sits at 53.47% and, per the 4-hour chart, has been declining steadily — a counterintuitive signal that might suggest some capital rotation into altcoins, though more likely reflects broad market de-risking rather than a healthy risk-on rotation. USDT dominance at 7.54% is elevated, consistent with significant capital sitting on the sidelines amid the fear-dominant environment highlighted by record ETF outflows and Strategy’s symbolic first-ever Bitcoin sale. Together, these readings suggest institutional and retail participants are reducing crypto exposure broadly, with no clear evidence of rotation back into BTC in the near term.
Risk Scenarios
- Bullish case: A decisive hourly close back above $71,180 (1h EMA20) accompanied by a reversal in ETF flow data and a funding rate spike into negative territory (suggesting forced short liquidations) could trigger a relief rally targeting the $73,000–$73,939 range. Sustained reclamation of the $72,500 area on the 4-hour with improving OBV would be the minimum requirement to consider a structural shift in momentum.
- Bearish case: A confirmed daily close below $70,000 with continued high-volume selling would open the path toward $68,500 and potentially the $65,000–$66,000 structural support region. Continued ETF outflows, further institutional selling, and a funding rate flip sharply negative amid cascading liquidations would reinforce this scenario.
Outlook
The technical picture as of June 2, 2026 is unambiguously bearish across all timeframes, with price testing the critical $70,000 level under the weight of deeply negative momentum, persistent distribution volume, and a deteriorating macro-sentiment backdrop. The confluence of record ETF outflows, Strategy’s symbolic end to its “never-sell” policy, and fully bearish EMA stacks on every timeframe provides little near-term reason for optimism without a definitive catalyst. The primary trigger to watch in the next 24–48 hours is whether $70,000 holds as a daily closing support — a failure here would constitute a significant technical breakdown with measurable downside toward $65,000. Until price reclaims at least the 1-hour EMA50 at $72,155 on meaningful volume, the path of least resistance remains lower, and any bounce should be treated as a potential selling opportunity rather than a trend reversal.
Disclaimer: This analysis is for informational purposes only and does not constitute financial advice. Cryptocurrency markets are highly volatile and unpredictable. All trading decisions should be made based on your own research and risk tolerance. Block Digest is not responsible for any financial losses incurred as a result of acting on this content.