Ethereum Daily Analysis: ETH at $2,000 with all major EMAs above price
Market Overview
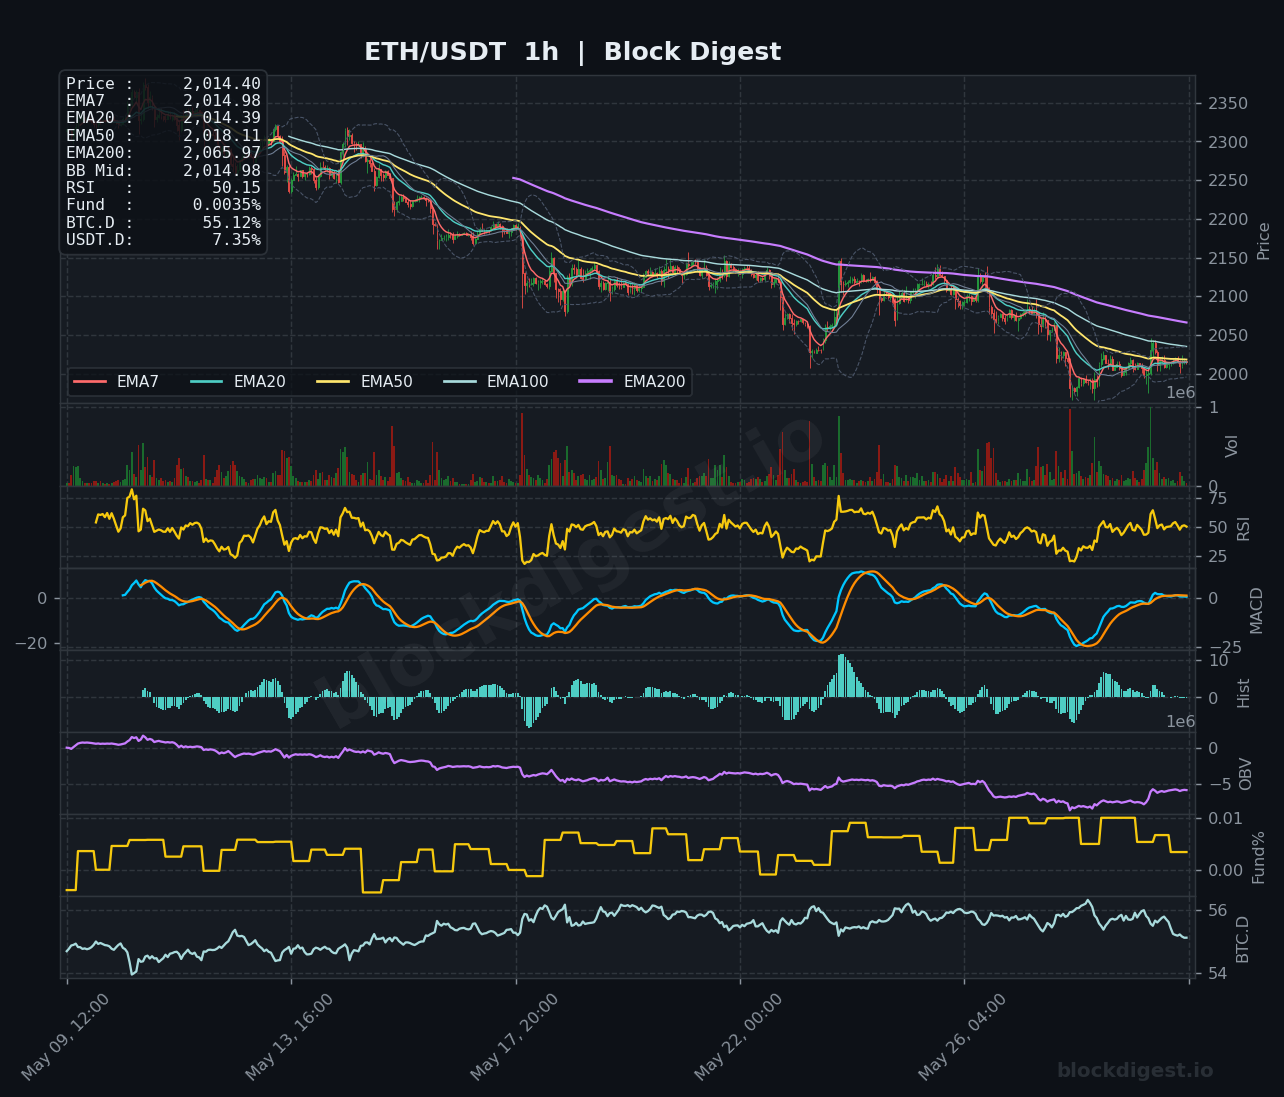
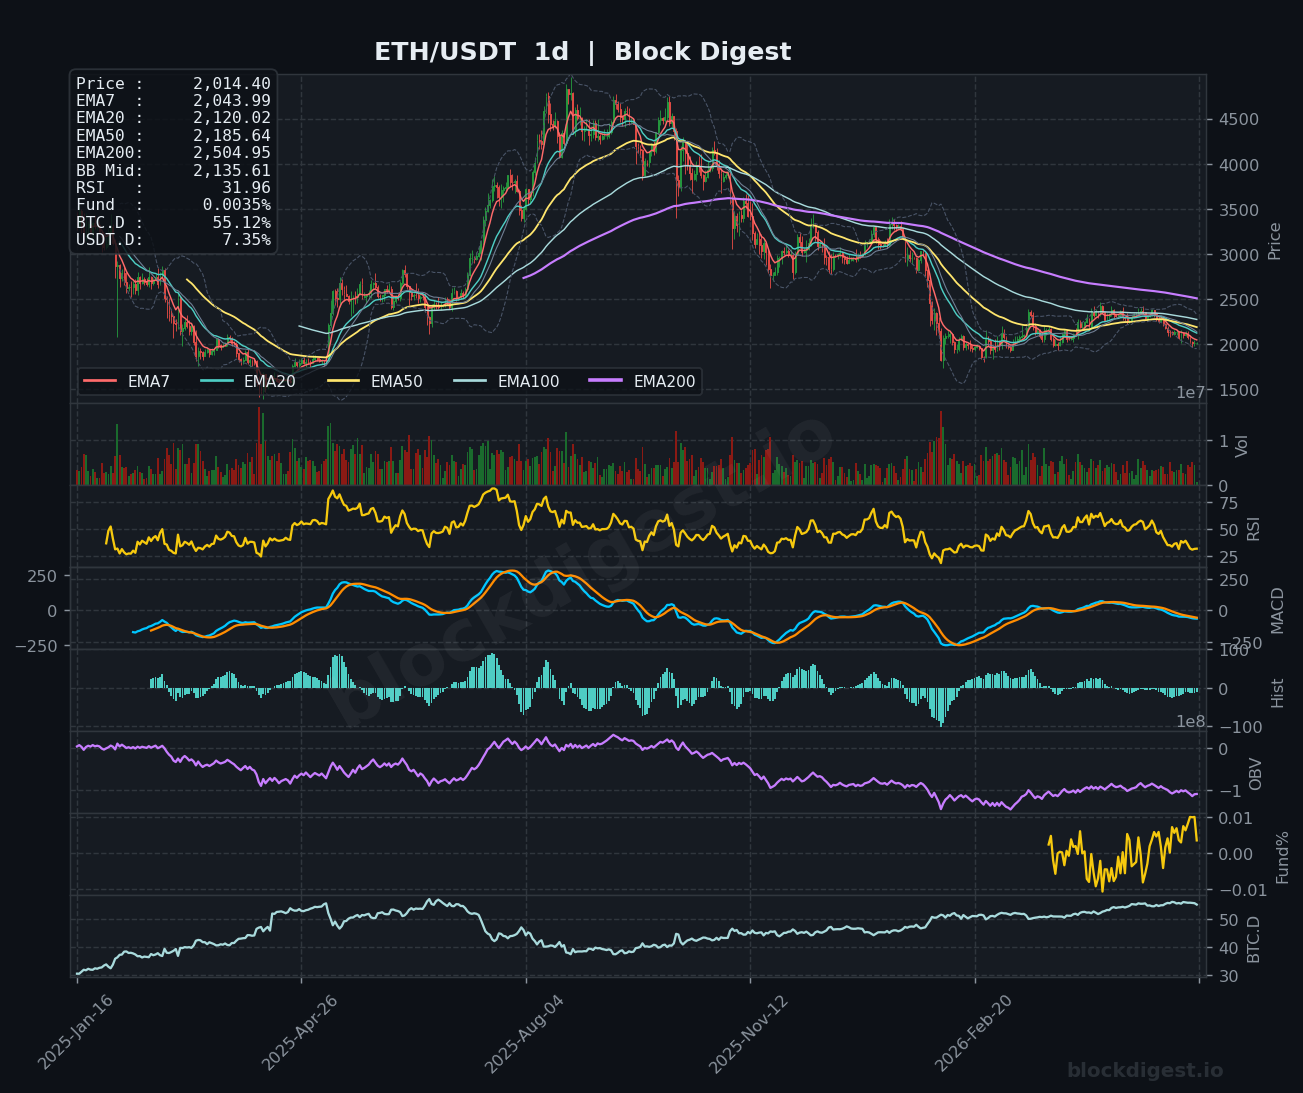
ETH/USDT is currently trading at $2,014.40, hovering precariously at the psychologically critical $2,000 threshold after an extended multi-month downtrend from the August 2025 all-time high of $4,953. On the daily timeframe, price is trading well below all major EMAs — the EMA7 at $2,043.99, EMA20 at $2,120.02, EMA50 at $2,185.64, and the EMA200 sitting far overhead at $2,504.95 — confirming an entrenched bearish market structure. The Bollinger Band midline on the daily sits at $2,135.61, with price pressed firmly against the lower band, indicating sustained selling pressure. The broader structure remains decisively bearish, and the recent breach of $2,000 referenced in market news underscores the severity of the current drawdown.
Multi-Timeframe Confluence
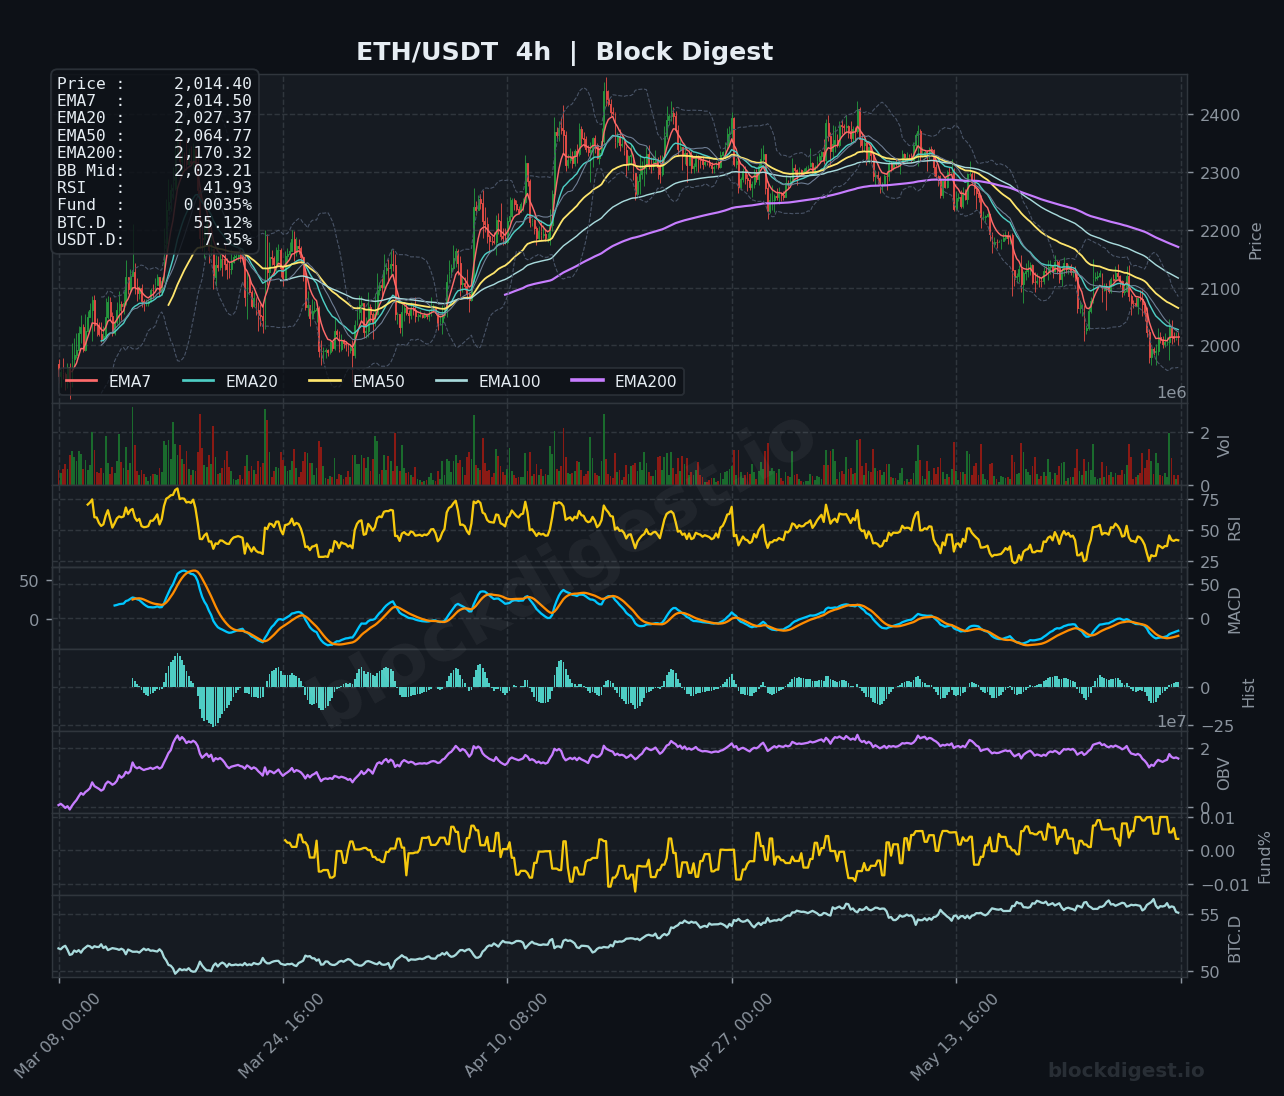
Across all three timeframes, the bearish alignment is consistent and reinforcing. On the 1-hour chart, price is sandwiched below the EMA50 ($2,018.11) and EMA200 ($2,065.97), with short-term EMAs (EMA7 at $2,014.98, EMA20 at $2,014.39) essentially flat and converged around current price, suggesting short-term indecision rather than any meaningful recovery. The 4-hour chart paints an equally grim picture, with price below all key EMAs — EMA7 at $2,014.50, EMA20 at $2,027.37, EMA50 at $2,064.77, and EMA200 at $2,170.32 — all in a descending formation since mid-April. There is no meaningful divergence between timeframes; all three confirm that any intraday bounces are occurring within a structurally bearish higher-timeframe trend, with no credible signs of trend reversal yet.
Key Levels to Watch
- Resistance: $2,064.77 — 4H EMA50, the first meaningful overhead barrier where sellers have repeatedly reasserted control during recent bounce attempts
- Resistance: $2,120.02 — Daily EMA20, a critical medium-term recovery target that would need to be reclaimed to suggest any structural improvement
- Resistance: $2,170.32 — 4H EMA200, representing the broader macro resistance zone; a sustained reclaim would signal a meaningful shift in trend
- Support: $2,000.00 — Major psychological support currently being tested; a clean daily close below this level would be a significant bearish signal
- Support: ~$1,960–$1,970 — Lower Bollinger Band region on the daily chart, the next technical reference if $2,000 gives way
- Support: ~$1,800–$1,850 — Structural support dating back to early 2025 consolidation, representing the next significant demand zone on a broader breakdown
Momentum & On-Chain Signals
The daily RSI reading of 31.96 places ETH in deeply oversold territory, approaching but not yet at the traditional 30-level threshold — a zone that historically has preceded at minimum short-term relief rallies. On the 4-hour timeframe, RSI reads 41.93, reflecting weak momentum without being oversold, which is notable because it suggests limited downside exhaustion at this intermediate level. The 1-hour RSI at 50.15 is neutral, consistent with the short-term price consolidation observed in the $2,000–$2,020 range. The MACD on the daily remains in bearish territory with the histogram showing persistent negative values, while the 4-hour MACD lines are converging near zero — a potential early sign of momentum deceleration, though no confirmed bullish crossover has occurred. OBV on the daily has been trending significantly lower since the late 2025 peak, confirming sustained distribution rather than accumulation at current levels, which undermines the credibility of any near-term recovery thesis.
BTC Dominance & Market Sentiment
BTC Dominance currently stands at 55.12%, elevated and still showing a gradual upward trend visible on both the 1-hour and 4-hour BTC.D panels, indicating continued capital rotation away from altcoins and into Bitcoin. USDT Dominance at 7.35% remains relatively elevated, reflecting a meaningful portion of market participants maintaining defensive cash positions — a signal of risk-off sentiment that weighs disproportionately on ETH and the broader altcoin market. Until BTC.D shows a decisive rollover, ETH is likely to continue underperforming on a relative basis, regardless of any nominal price stabilization near $2,000.
Risk Scenarios
- Bullish case: A confirmed daily close above $2,064 (4H EMA50), followed by a reclaim of the $2,120 daily EMA20, would suggest short-term bearish exhaustion and open a path toward the $2,170–$2,200 resistance cluster; this scenario would be further supported by a reversal in BTC.D and a surge in OBV.
- Bearish case: A clean daily close below $2,000 on elevated volume would confirm a structural breakdown, with the next meaningful downside targets at $1,960 (lower Bollinger Band) and ultimately $1,800–$1,850, particularly if BTC.D continues to climb and broader risk-off sentiment persists.
Outlook
ETH is at a critical inflection point as it tests the $2,000 psychological floor, with the weight of evidence across all timeframes remaining bearish. The near-term bias leans cautiously to the downside given the consistent EMA stacking against price, persistent OBV distribution, and an elevated BTC.D, though the daily RSI approaching oversold territory warrants close attention for potential short-covering bounces. The key triggers to watch in the next 24–48 hours are a confirmed close above or below $2,000 on meaningful volume, and any shift in the 4-hour MACD toward a bullish crossover near the zero line. A sustained move above $2,064 would be the minimum requirement to revise the short-term thesis toward neutral; until then, rallies should be treated as relief within a broader downtrend rather than signs of genuine trend reversal.
Disclaimer: This analysis is for informational purposes only and does not constitute financial advice. Cryptocurrency markets are highly volatile and unpredictable. All trading decisions should be made based on your own research and risk tolerance. Block Digest is not responsible for any financial losses incurred as a result of acting on this content.