Altcoin Daily Analysis — April 28, 2026
Altcoin Daily Roundup – April 28, 2026
Market Context
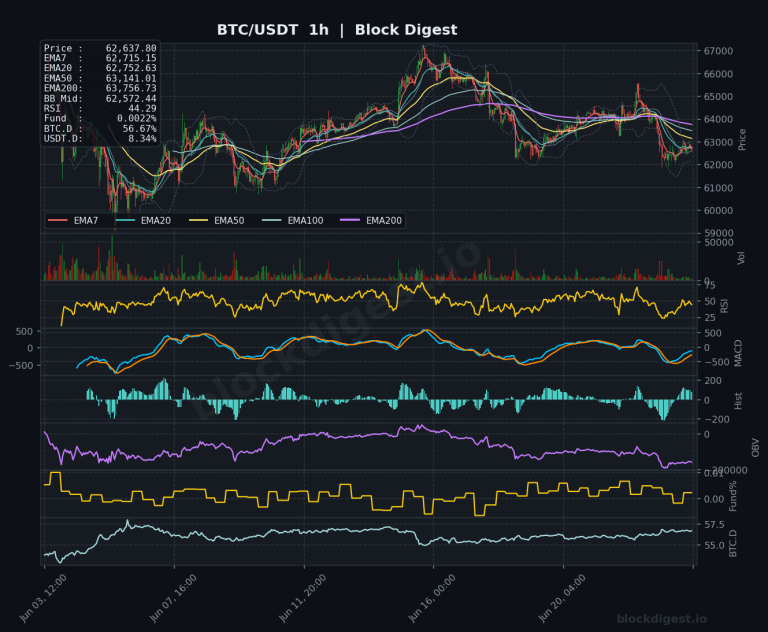
The altcoin market exhibits mixed signals on April 28, 2026, with Bitcoin dominance sitting at 54.5% across most charts, suggesting moderate competition for capital between BTC and altcoins. USDT dominance registers at 7.17%, indicating relatively stable risk appetite in crypto markets rather than a flight to stablecoins. Trading volumes remain moderate across major altcoins, with no exceptional spikes suggesting cautious positioning ahead of potential macro catalysts.
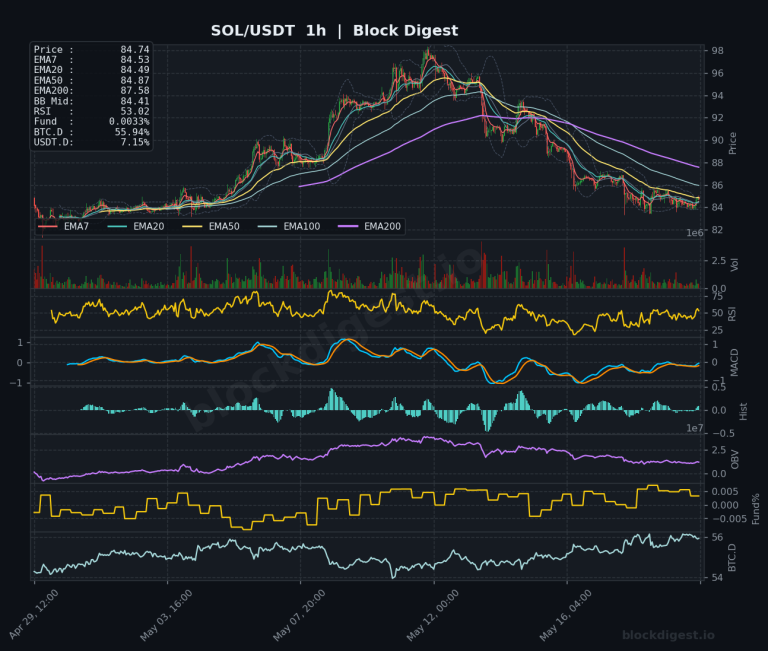
Solana (SOL)
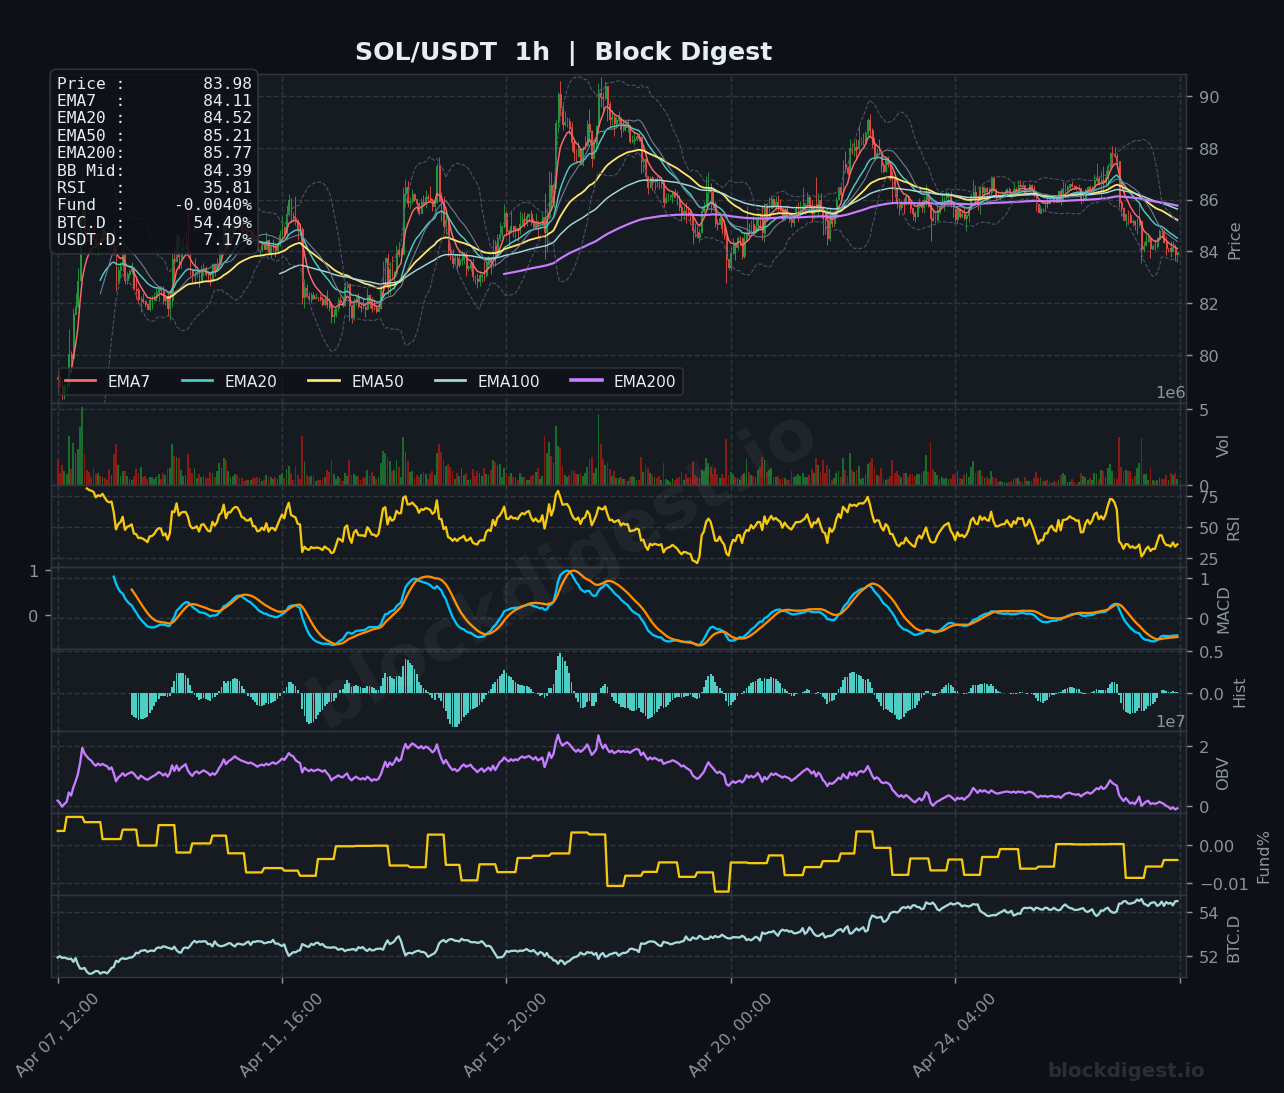
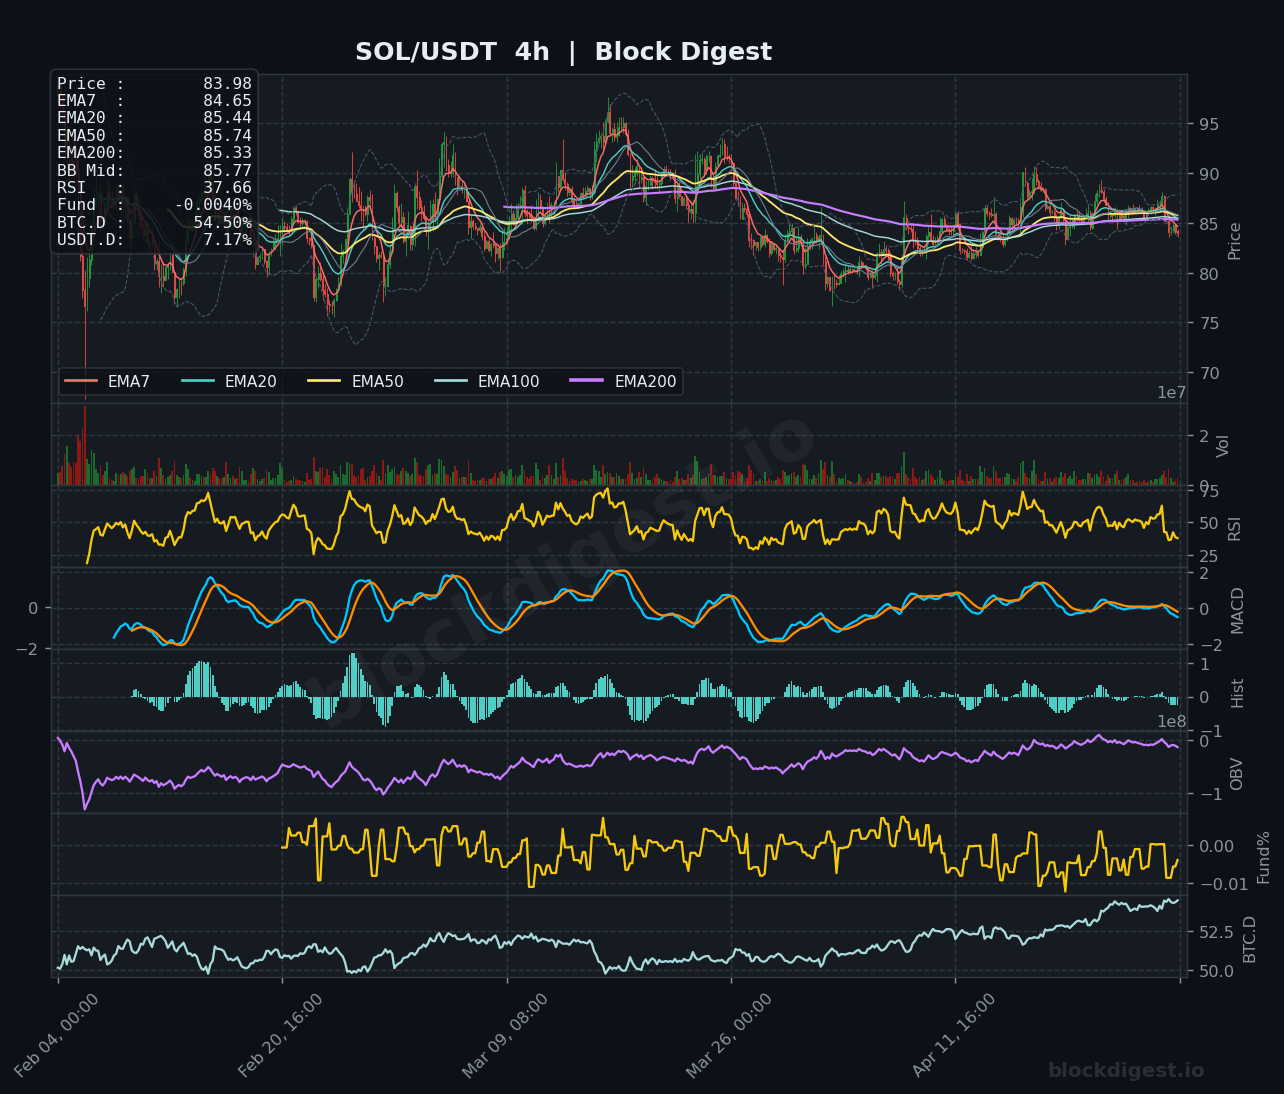
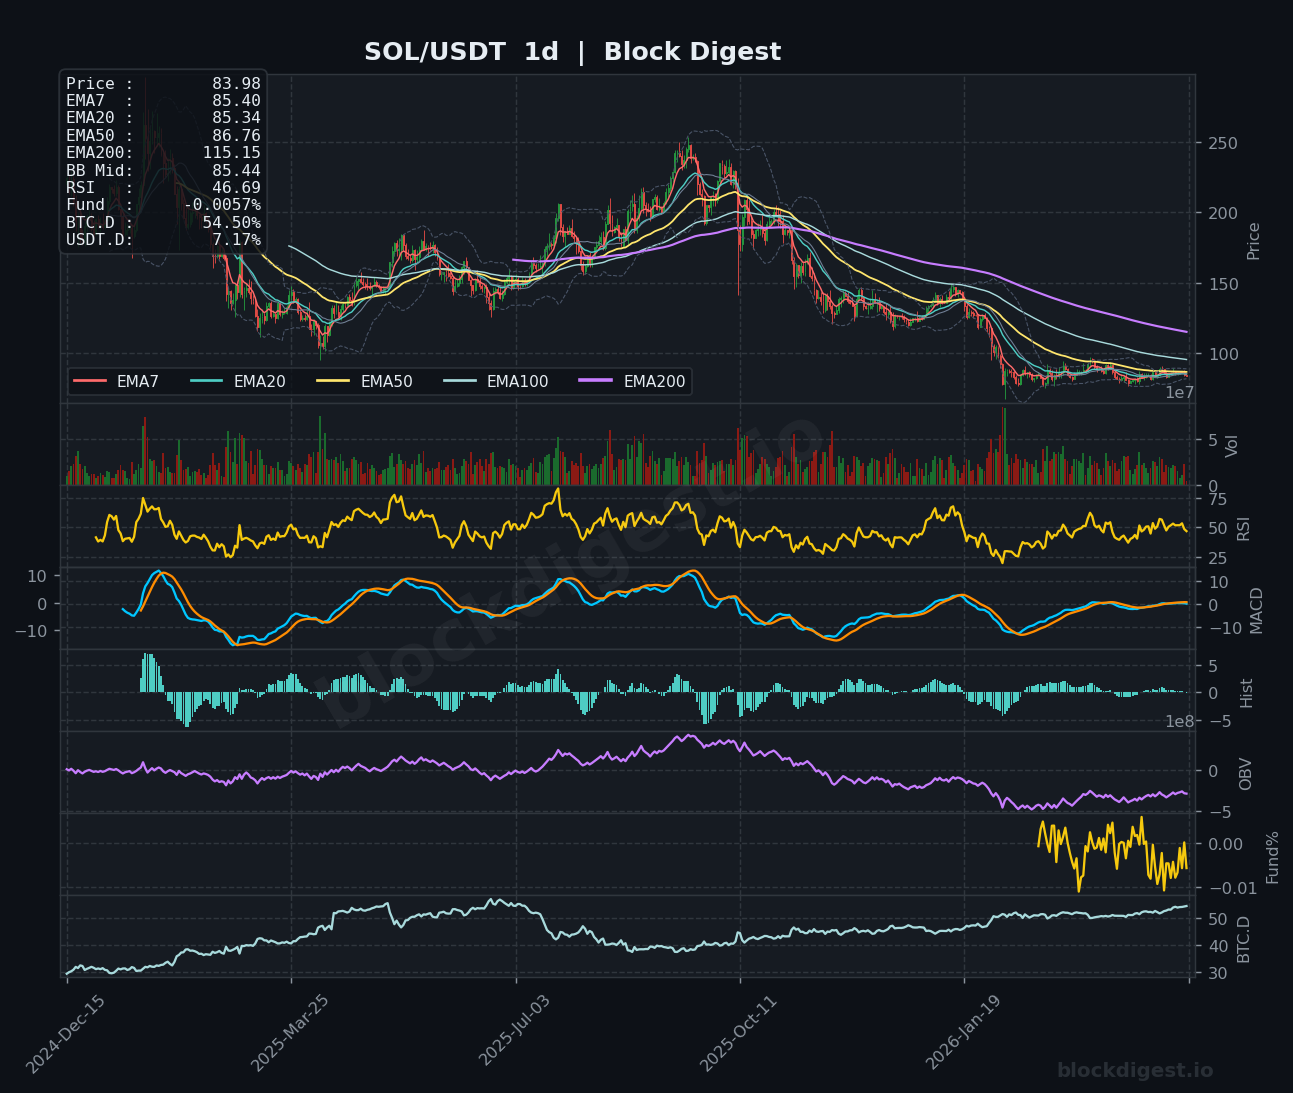
Solana trades at $83.98, positioned below its key moving averages with the EMA7 at $84.11, EMA20 at $84.52, and EMA50 at $85.21, indicating short-term bearish pressure. The 1-hour chart shows price trading beneath all major EMAs with RSI at 35.81, suggesting oversold conditions that could trigger a relief bounce. However, the daily timeframe reveals a more concerning picture with price well below the EMA200 at $115.15, confirming the sustained downtrend from higher levels. MACD remains negative across timeframes, though the histogram shows decreasing bearish momentum on the 1-hour chart. Immediate resistance sits at $84-85, while support appears around $83, with a break below potentially accelerating losses toward $80.
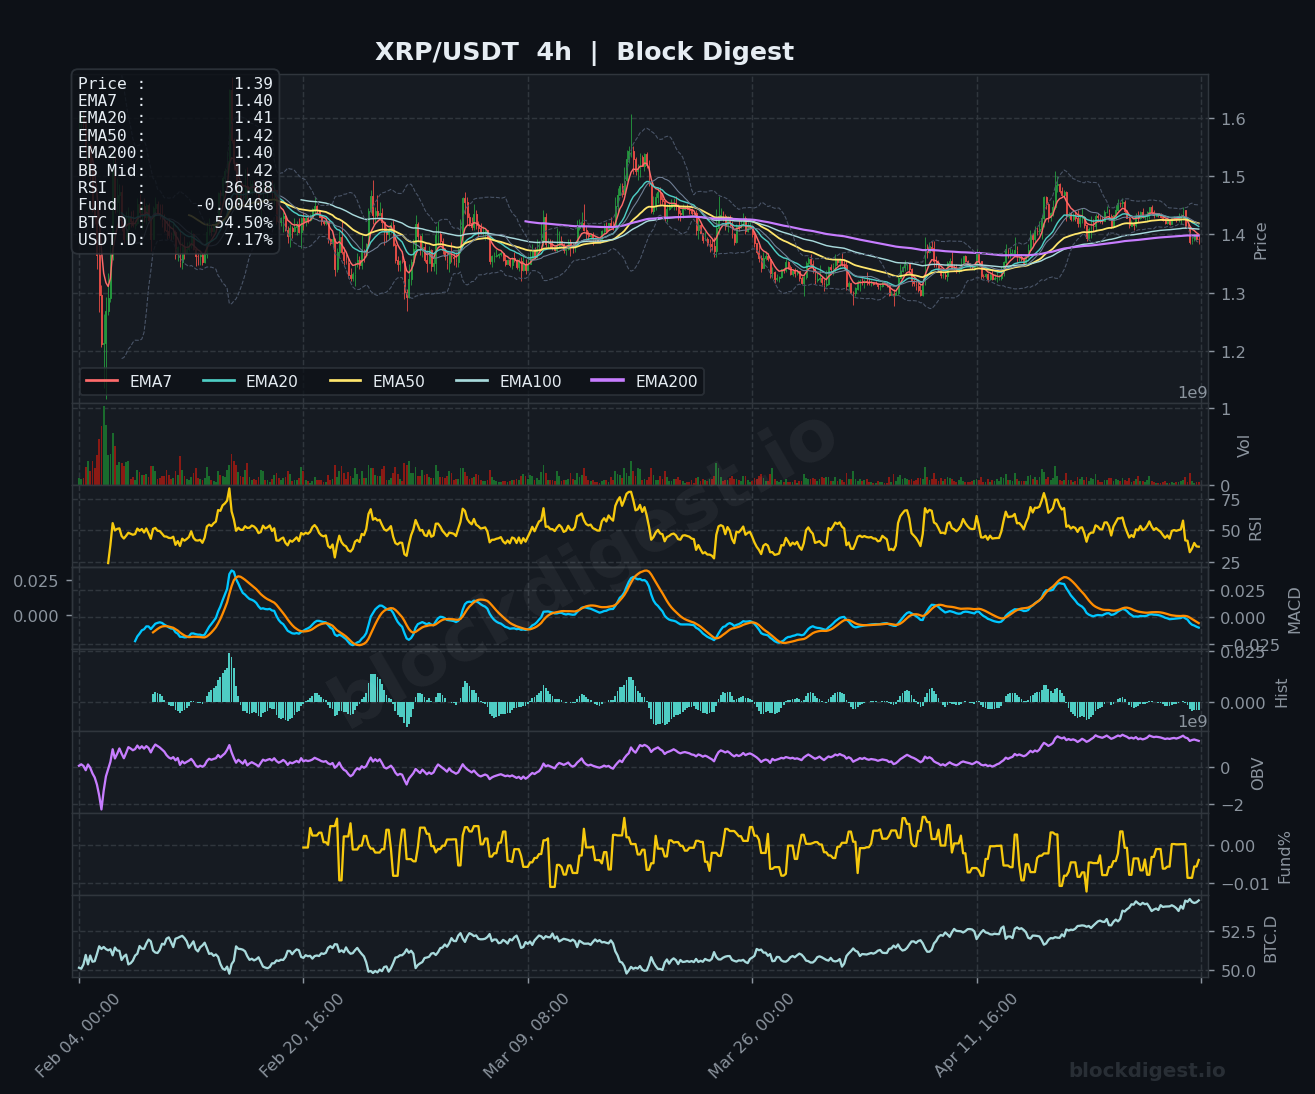
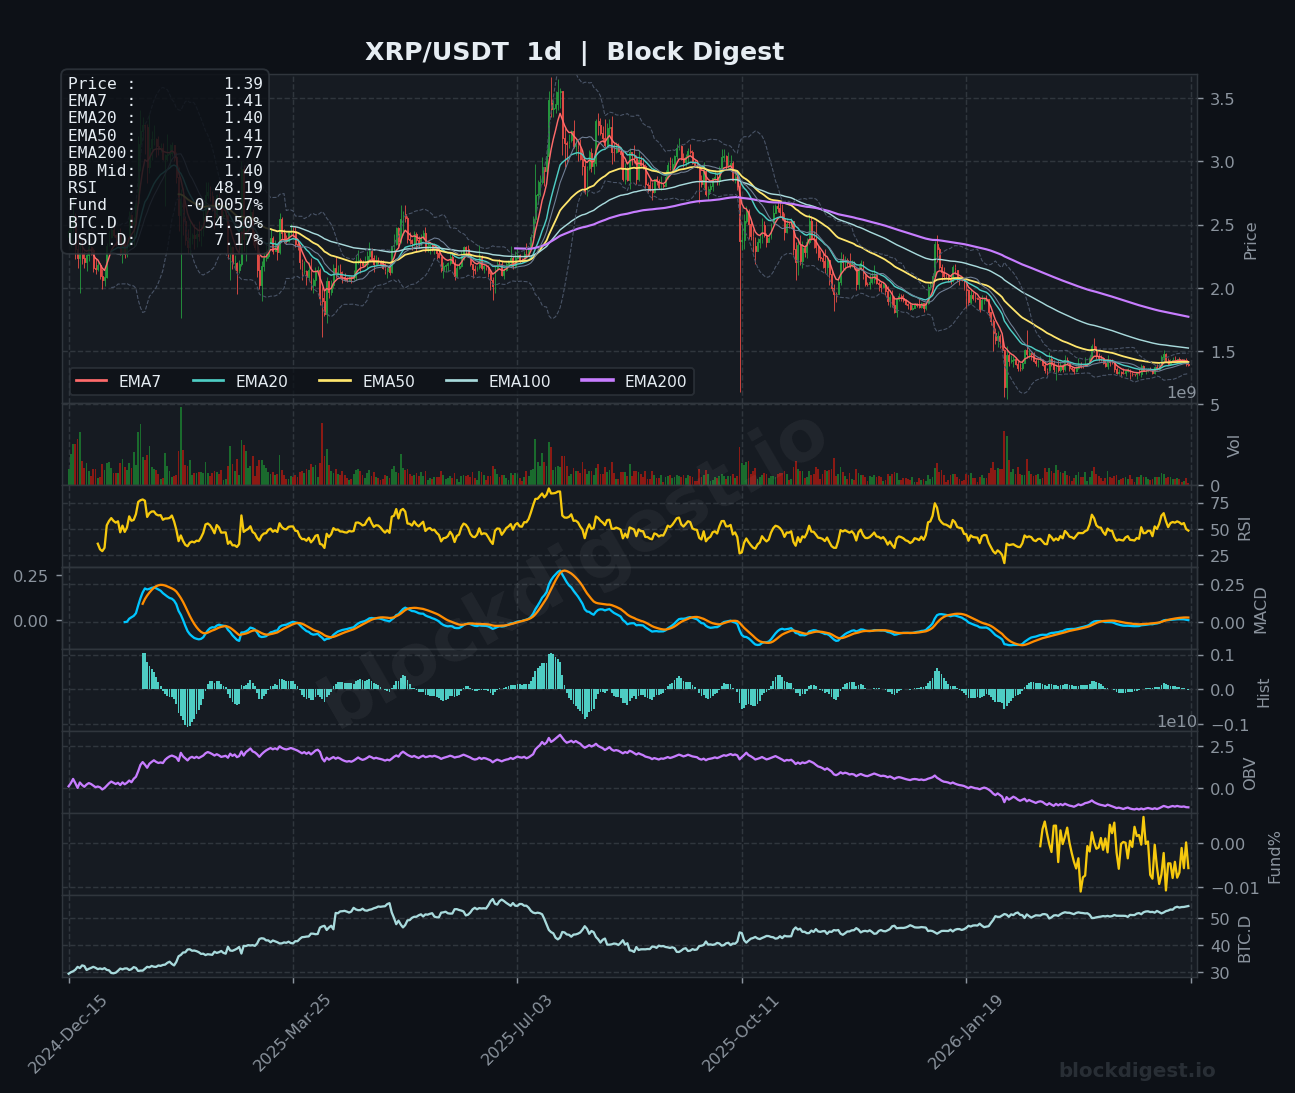
XRP (XRP)
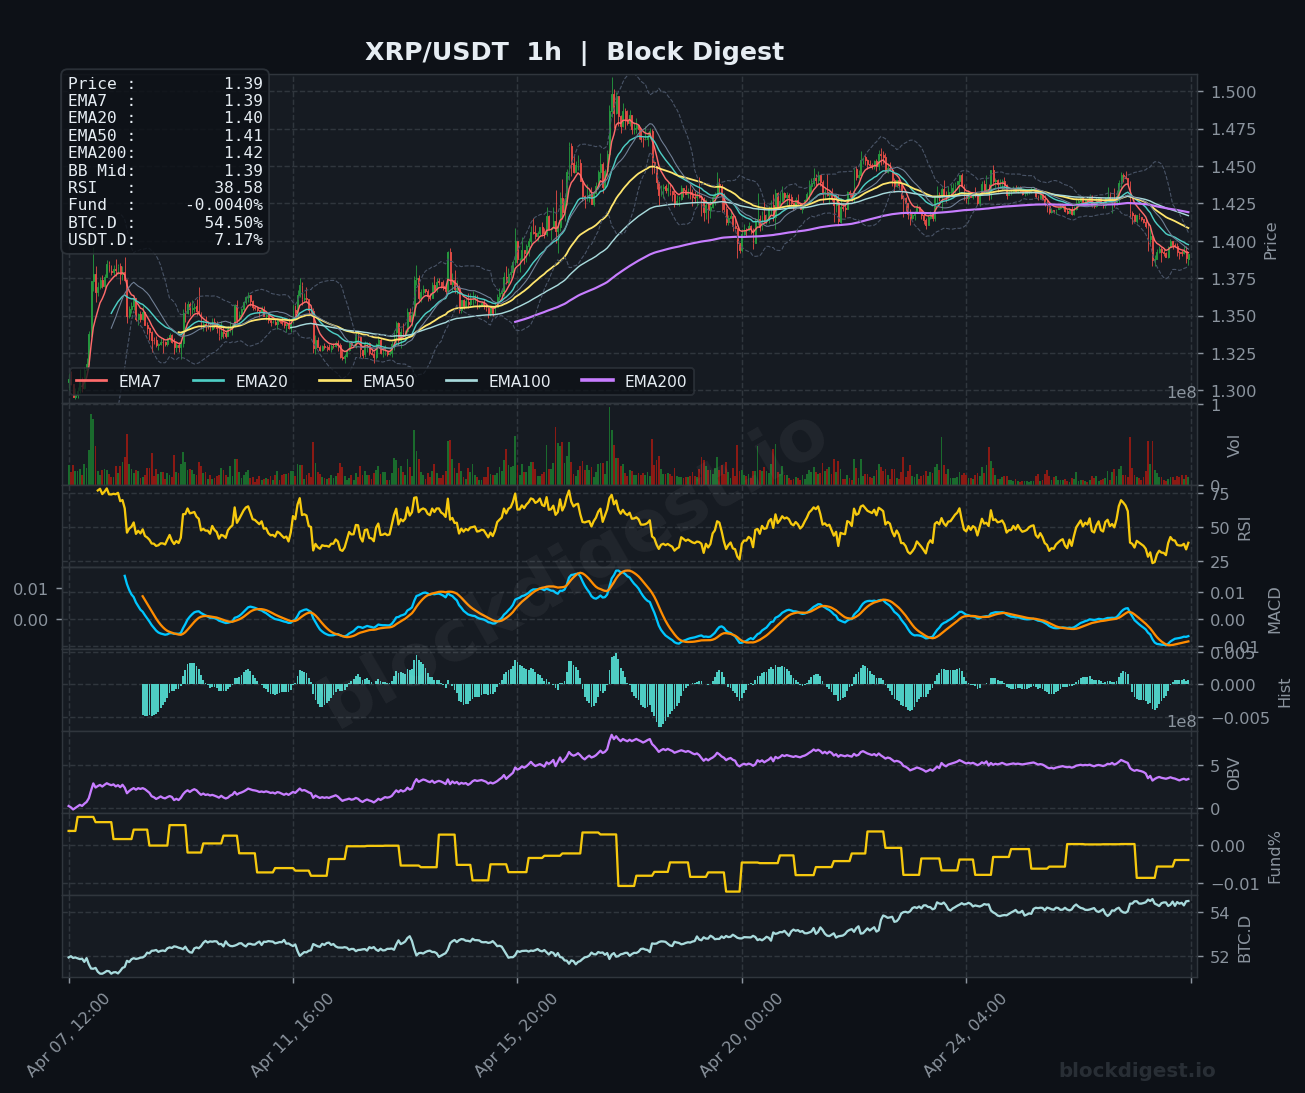
XRP currently trades at $1.39, exhibiting relative stability near its short-term moving averages with EMA7 at $1.39 and EMA20 at $1.40. The 1-hour chart shows RSI at 38.58, positioned in neutral-to-oversold territory with MACD trending negative but flattening, suggesting bearish momentum may be exhausting. The 4-hour timeframe presents a more constructive view with price consolidating near the $1.40 level and all major EMAs converging, indicating a potential breakout setup. On the daily chart, XRP remains in a pronounced downtrend from levels above $3.50 earlier in the cycle, trading well below the EMA200 at $1.77. The current price action suggests XRP is attempting to establish a base around $1.39-$1.40, with a break above $1.42 potentially triggering short-term bullish momentum toward $1.45-$1.47.
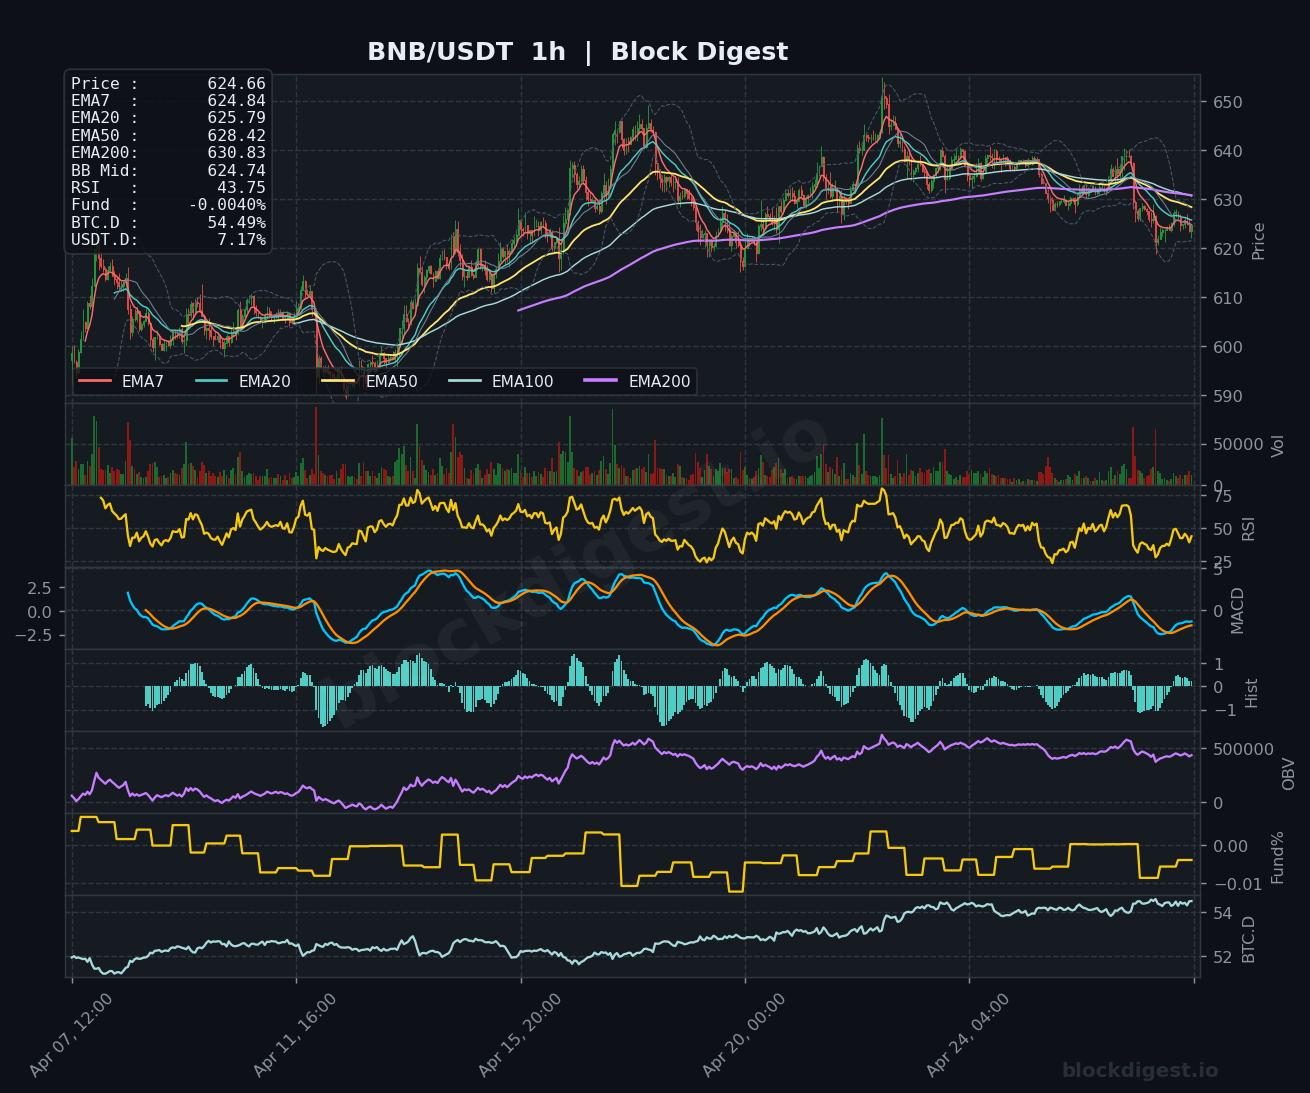
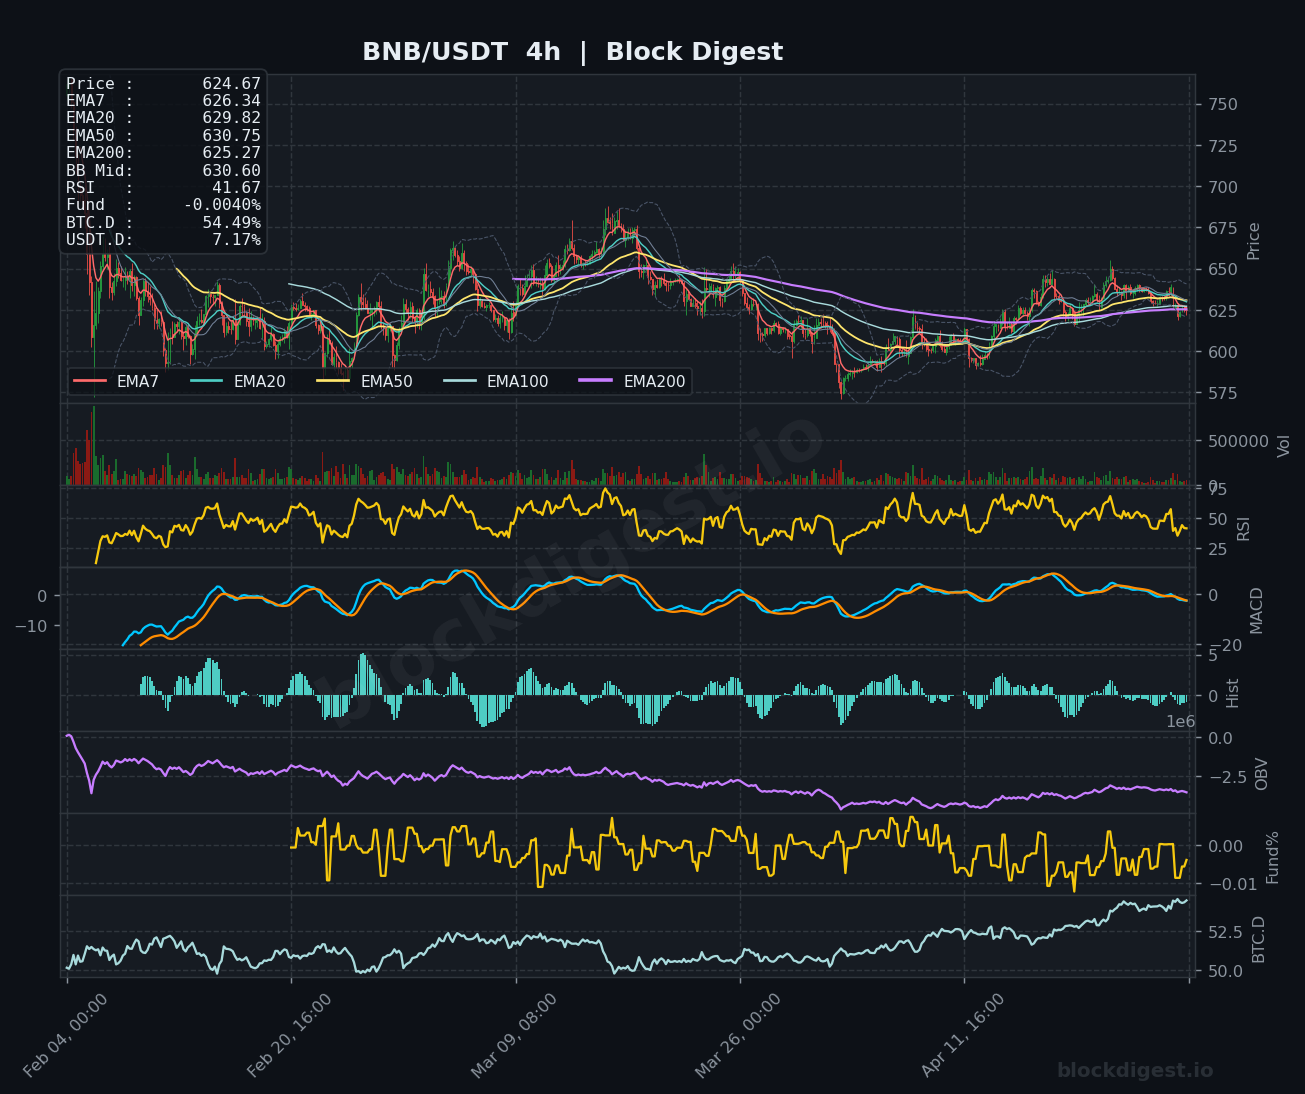
BNB (BNB)
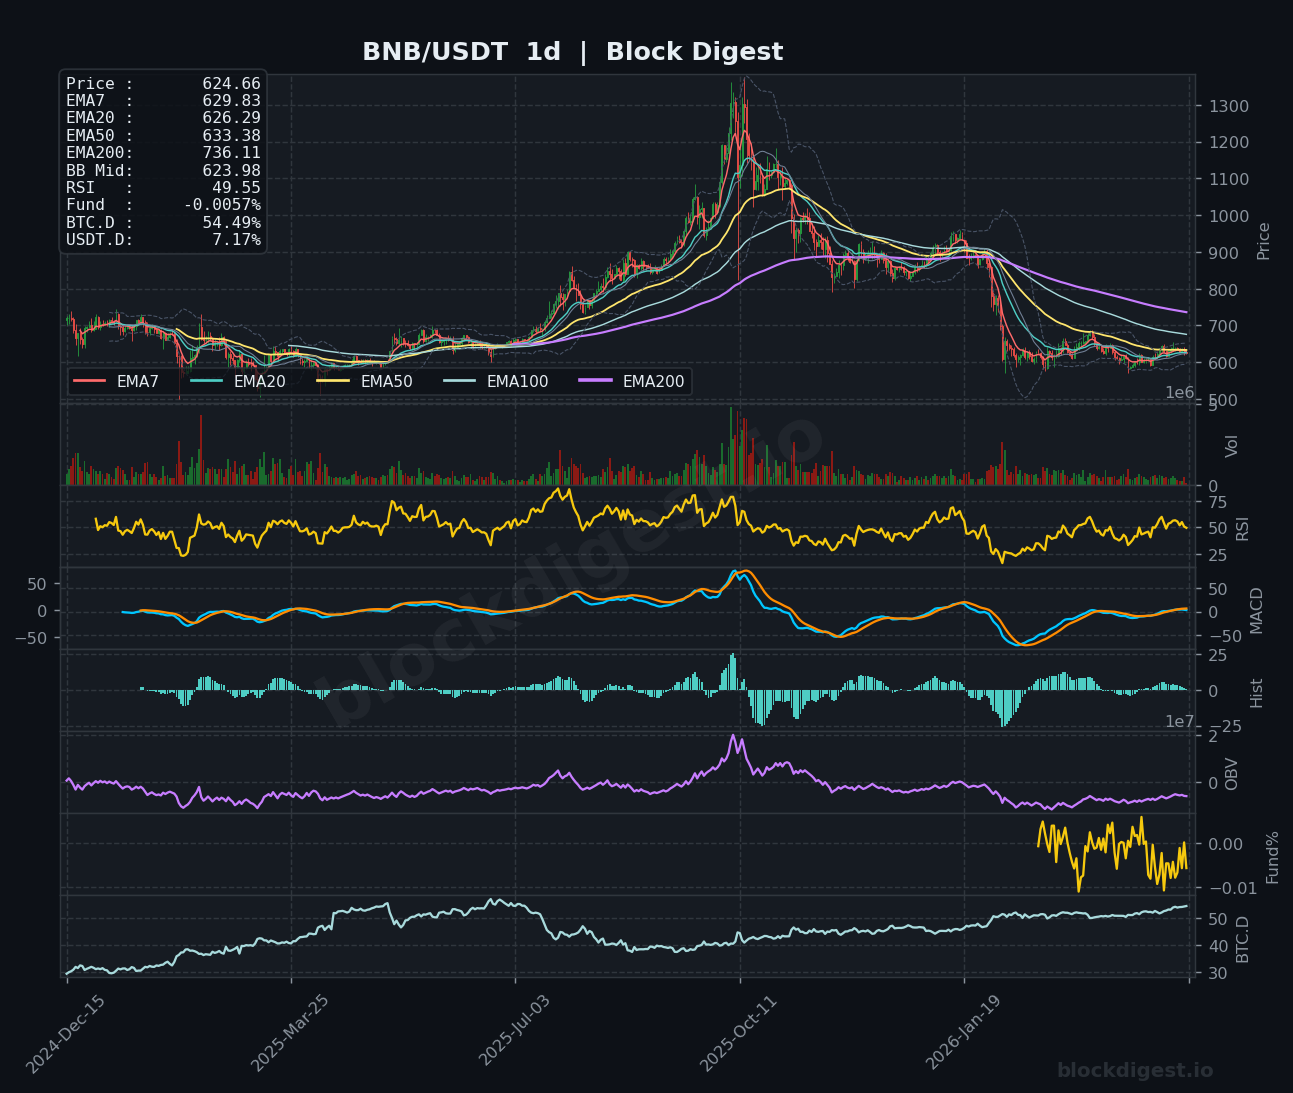
BNB trades at $624.66, showing resilience with price hovering near its short-term moving averages as EMA7 sits at $624.84 and EMA20 at $625.79. The 1-hour RSI reads 43.75, indicating neutral momentum with room for upward movement before overbought conditions. The 4-hour chart reveals price consolidating between $620-630 with MACD showing decreasing bearish divergence, suggesting accumulation at current levels. However, the daily timeframe shows BNB in a significant correction from highs above $1,300, currently trading below the EMA200 at $736.11. The OBV (On-Balance Volume) has been declining on the daily chart, indicating persistent distribution despite recent price stability. Key support exists at $620, while resistance stands at $630-635, with a decisive break above potentially targeting $650.
Dogecoin (DOGE)
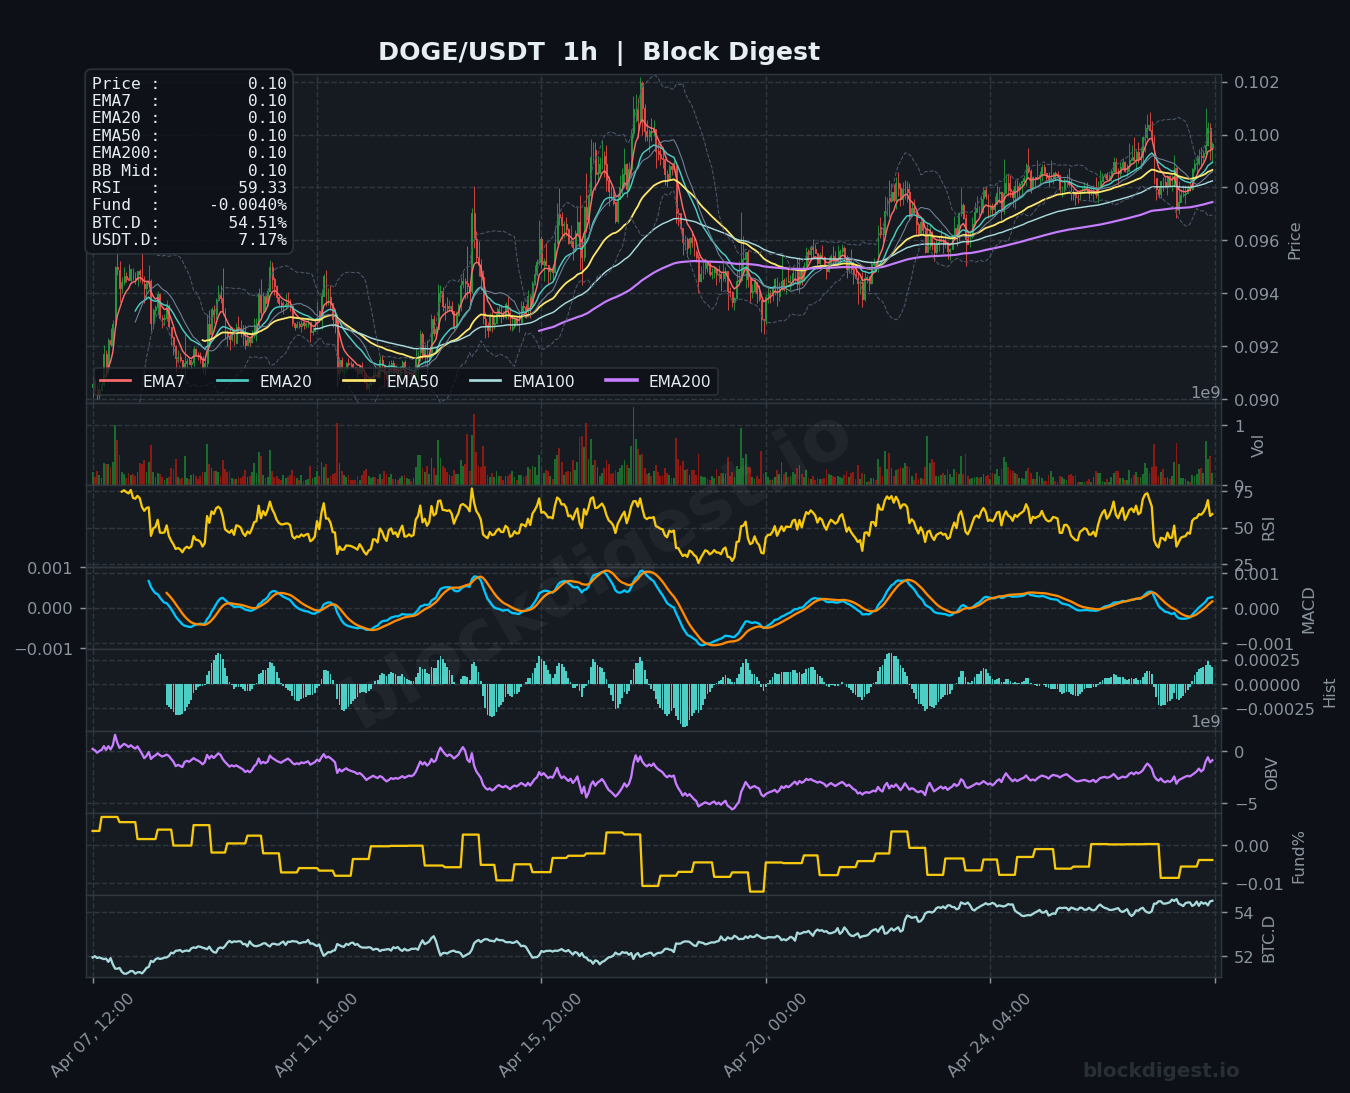
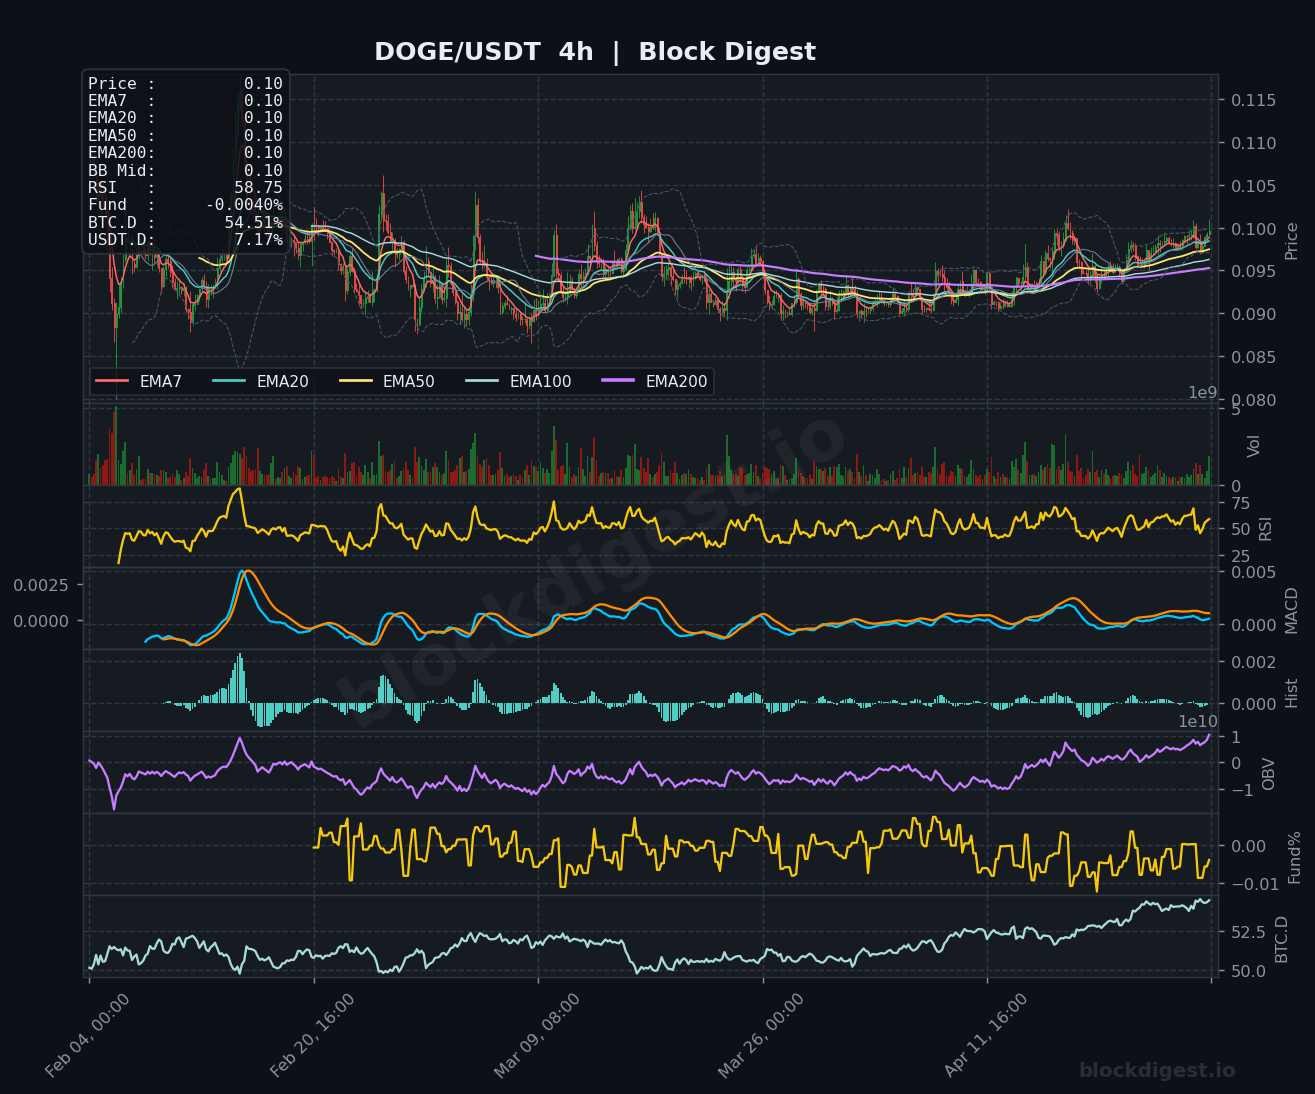
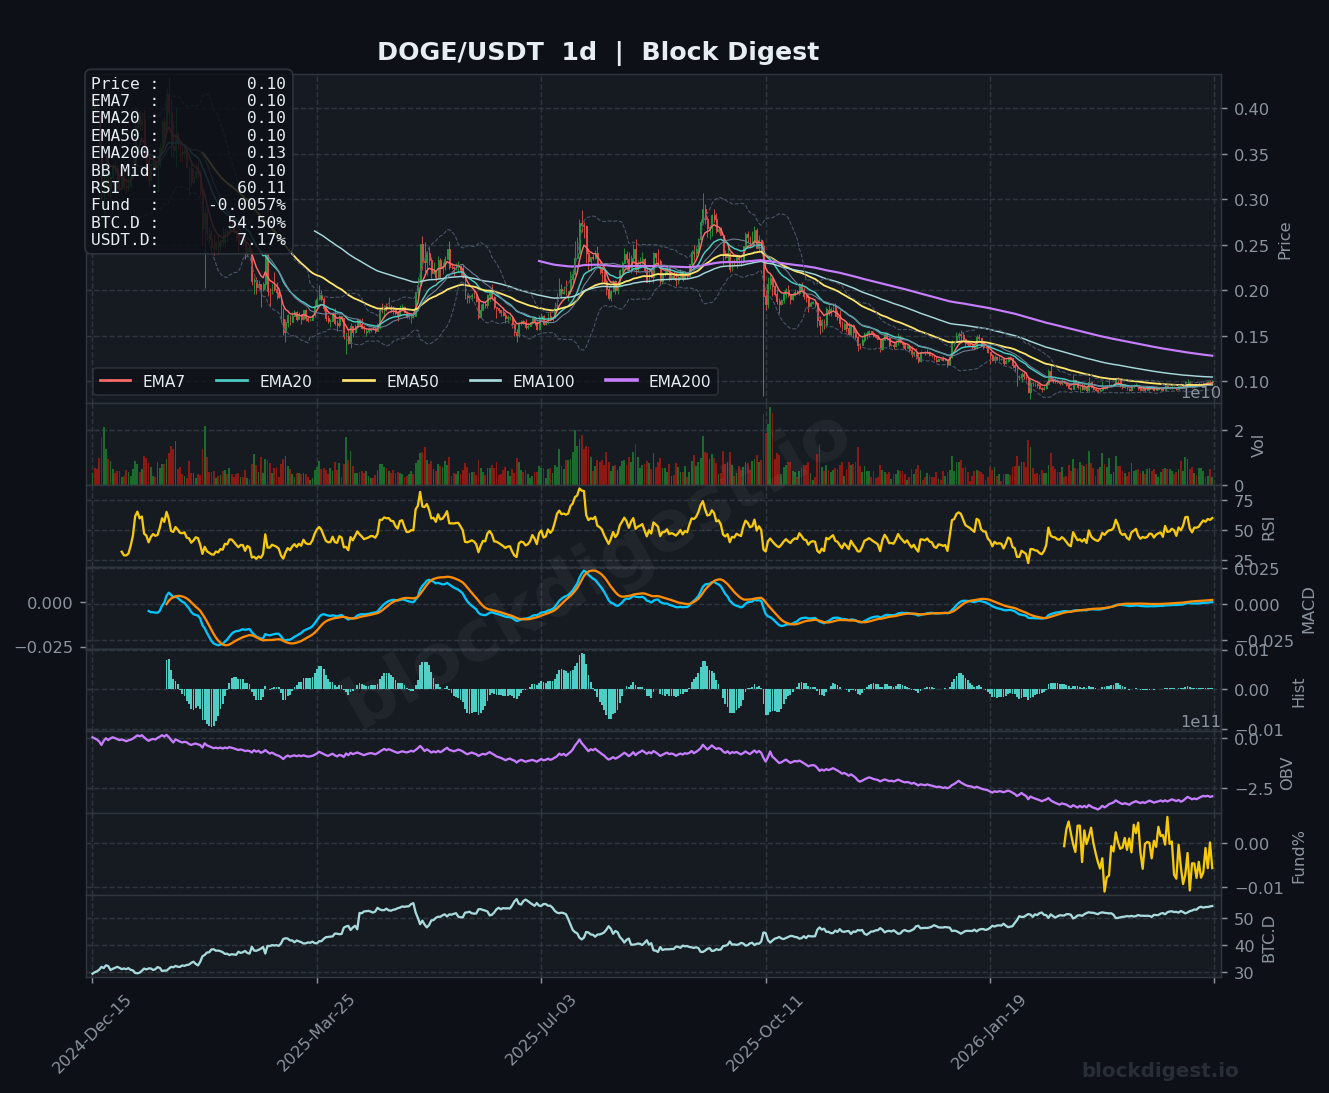
Dogecoin trades at $0.10, positioned right at the convergence of multiple EMAs with EMA7, EMA20, and EMA50 all clustering around the $0.10 level. The 1-hour chart shows RSI at 59.33, indicating neutral-to-bullish momentum with MACD recently crossing positive, suggesting emerging buying pressure. The 4-hour timeframe confirms this constructive setup with price breaking above the EMA200 at $0.10 and all shorter-term averages aligning in bullish formation. On the daily chart, DOGE has experienced a severe correction from levels above $0.30, but recent price action suggests a potential bottoming formation around current levels. The RSI on the daily sits at 60.11, showing renewed strength, while OBV has stabilized after prolonged decline. Immediate resistance stands at $0.101-0.102, with support at $0.098, making DOGE one of the more interesting setups among major altcoins.
Litecoin (LTC)
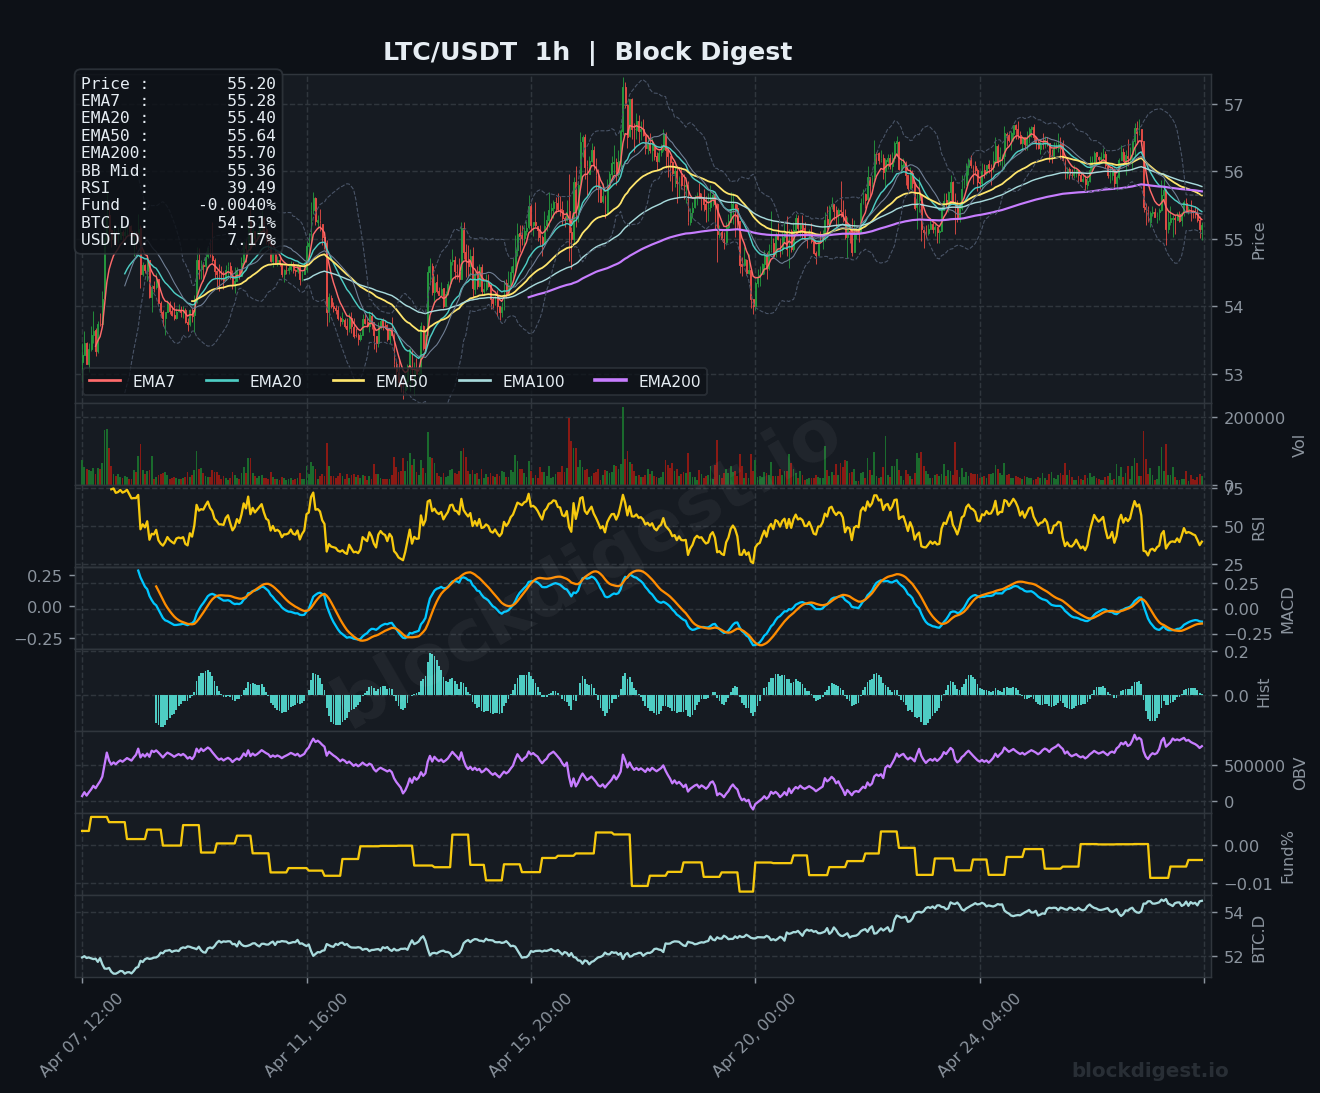
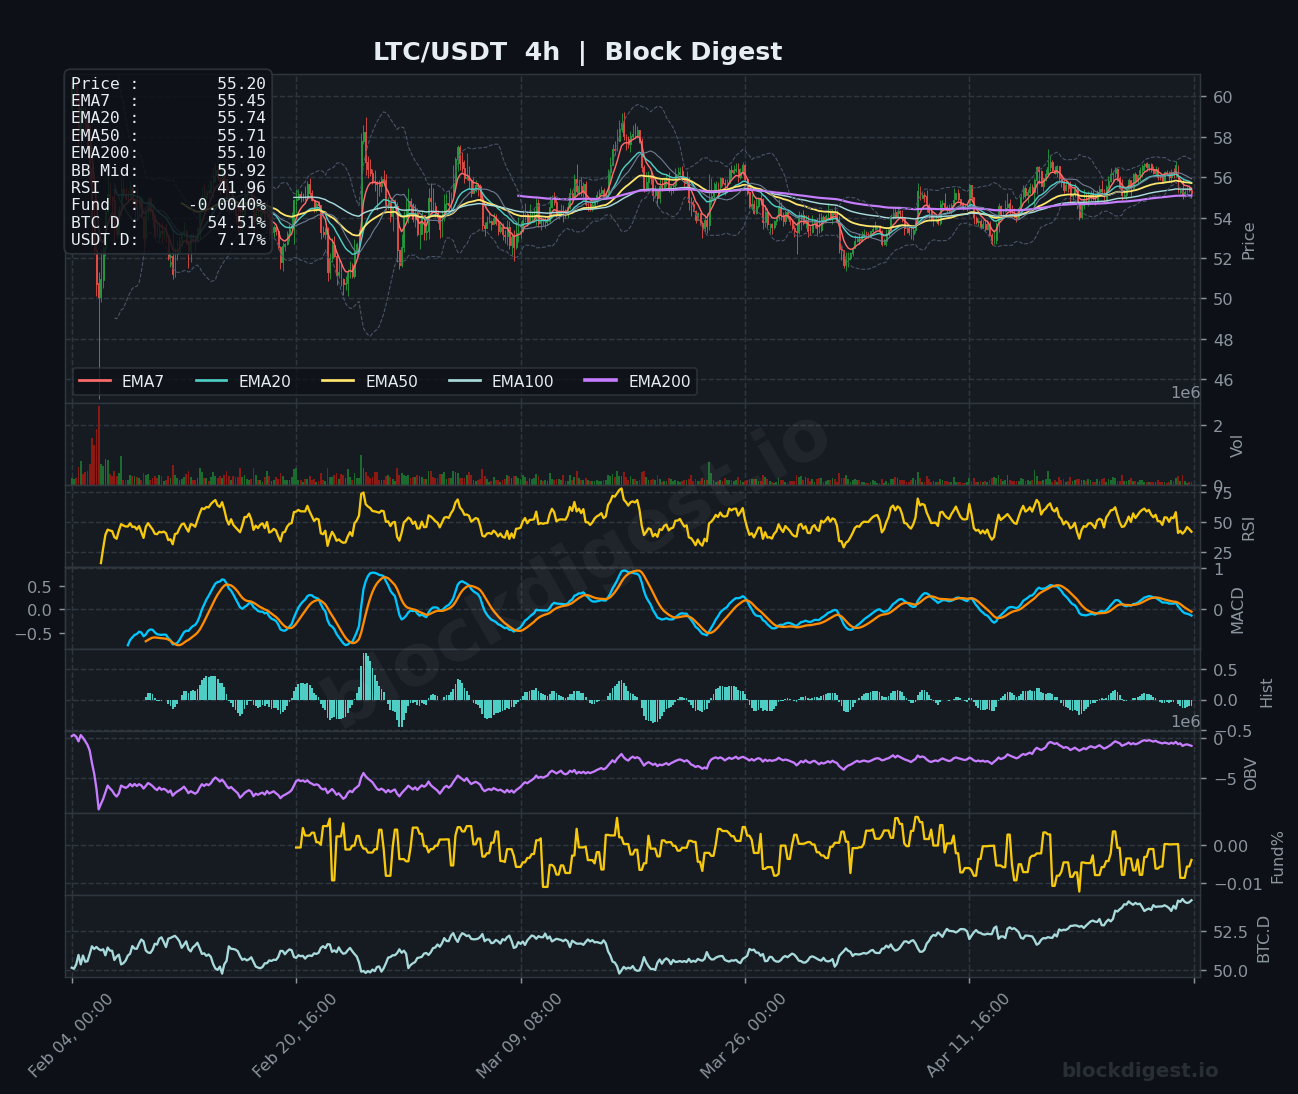
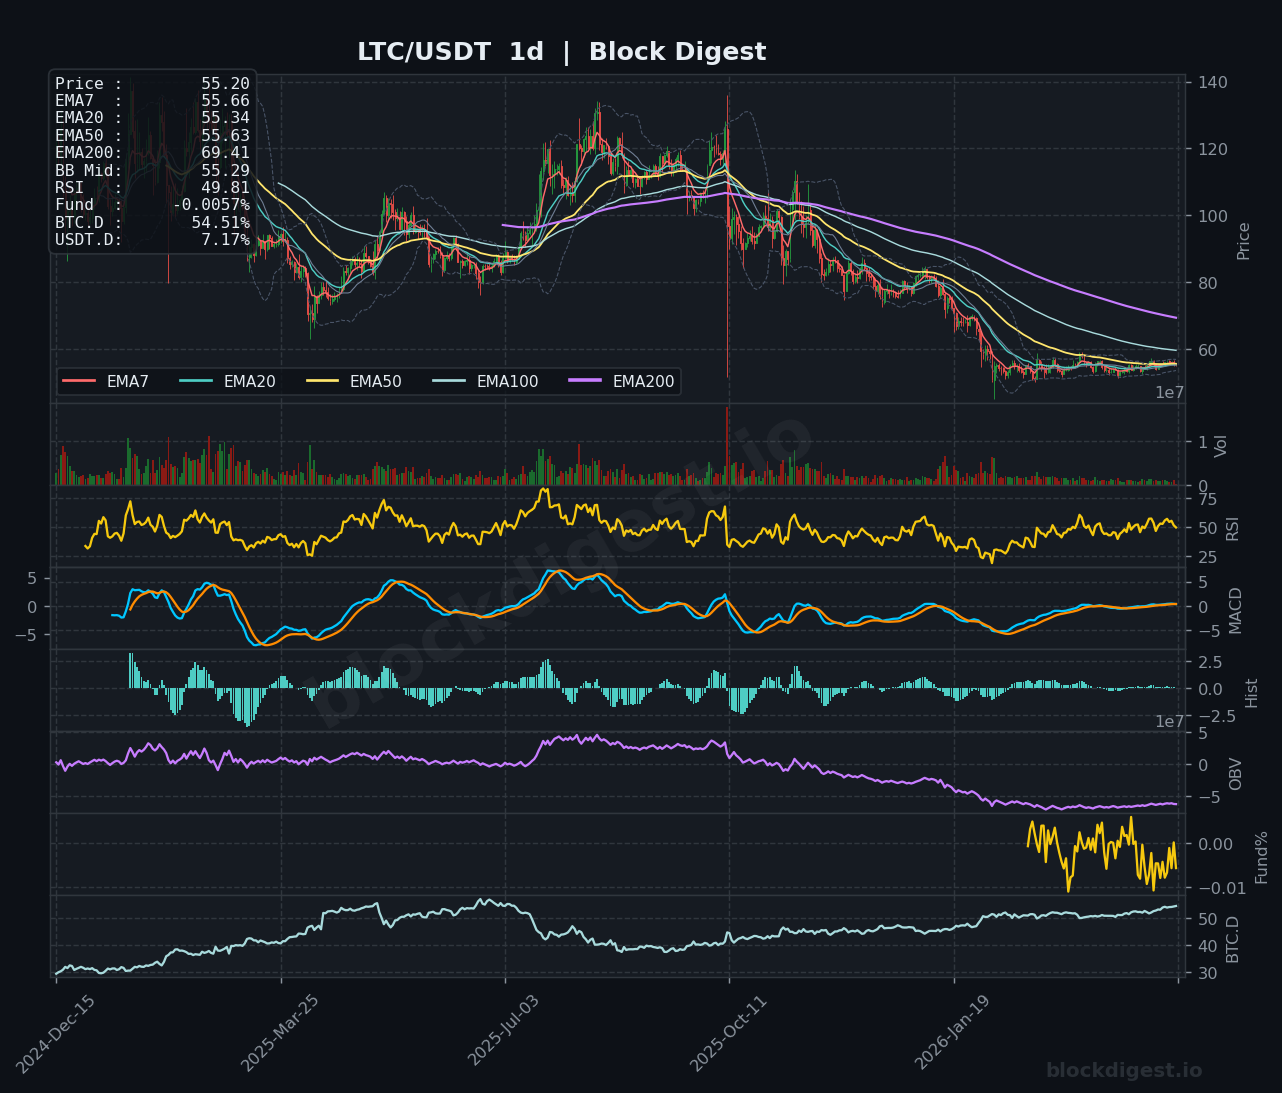
Litecoin currently trades at $55.20, positioned slightly below its immediate moving averages with EMA7 at $55.28 and EMA20 at $55.40. The 1-hour RSI reads 39.49, indicating neutral momentum with slight bearish bias, while MACD shows negative but flattening histogram bars suggesting waning selling pressure. The 4-hour chart presents a range-bound structure between $54-57 with price oscillating around the EMA cluster near $55.50. On the daily timeframe, LTC remains in a pronounced downtrend from peaks above $140, trading well below the EMA200 at $69.41. The recent price action shows repeated tests of the $55 support level, which has held multiple times, suggesting accumulation interest at current valuations. A break above $56 could trigger short-term bullish momentum toward $57-58, while failure to hold $55 risks accelerated losses toward $53.
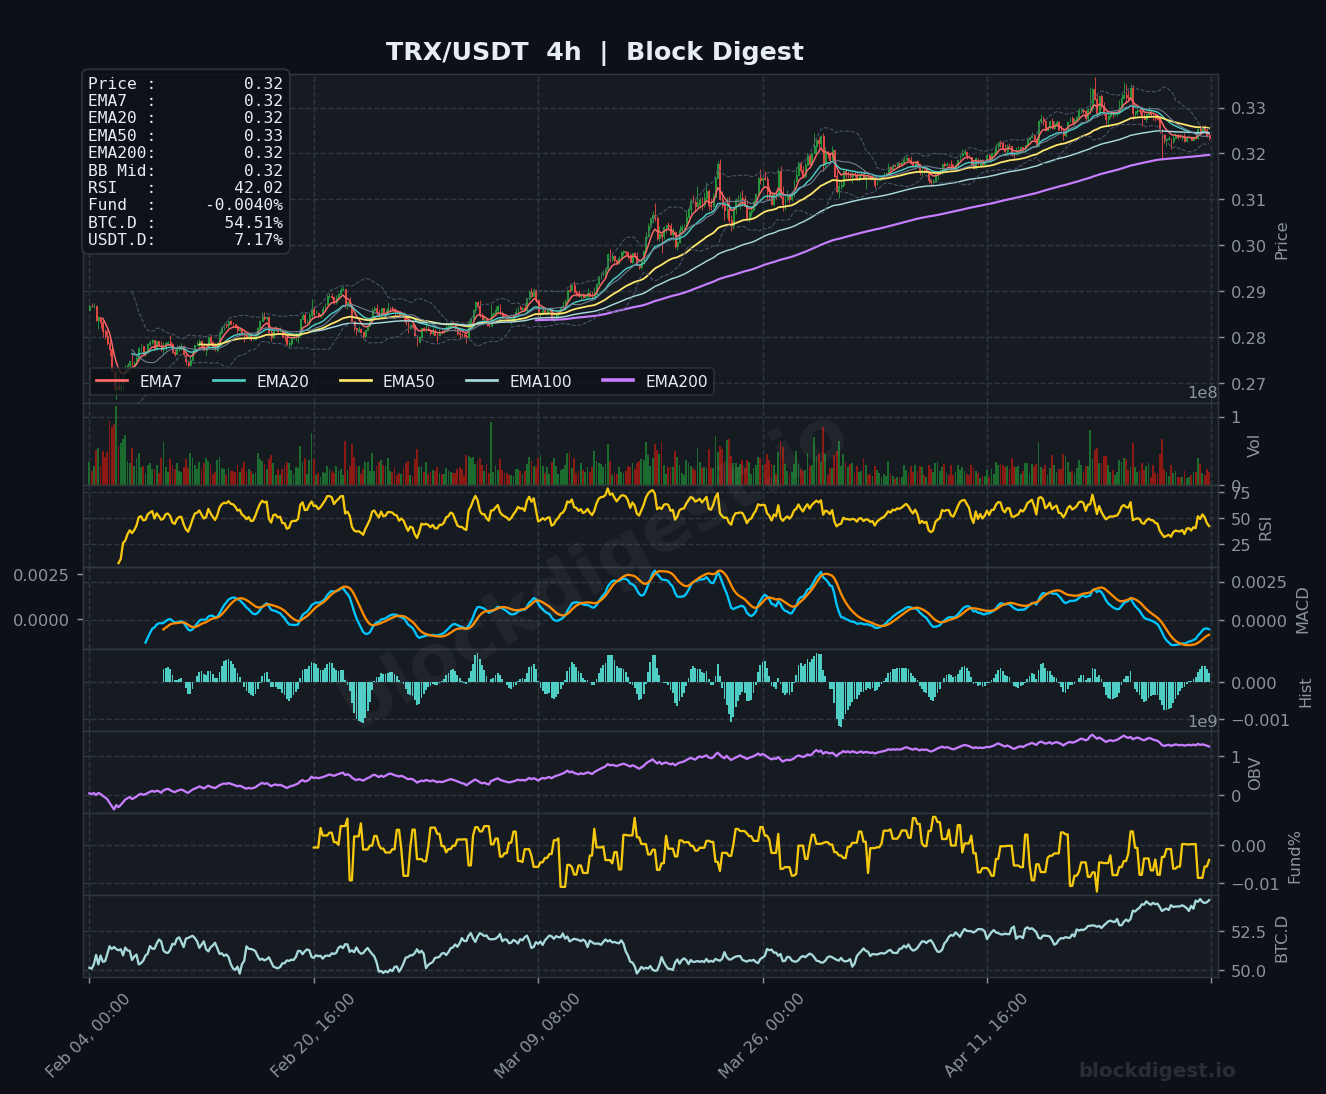
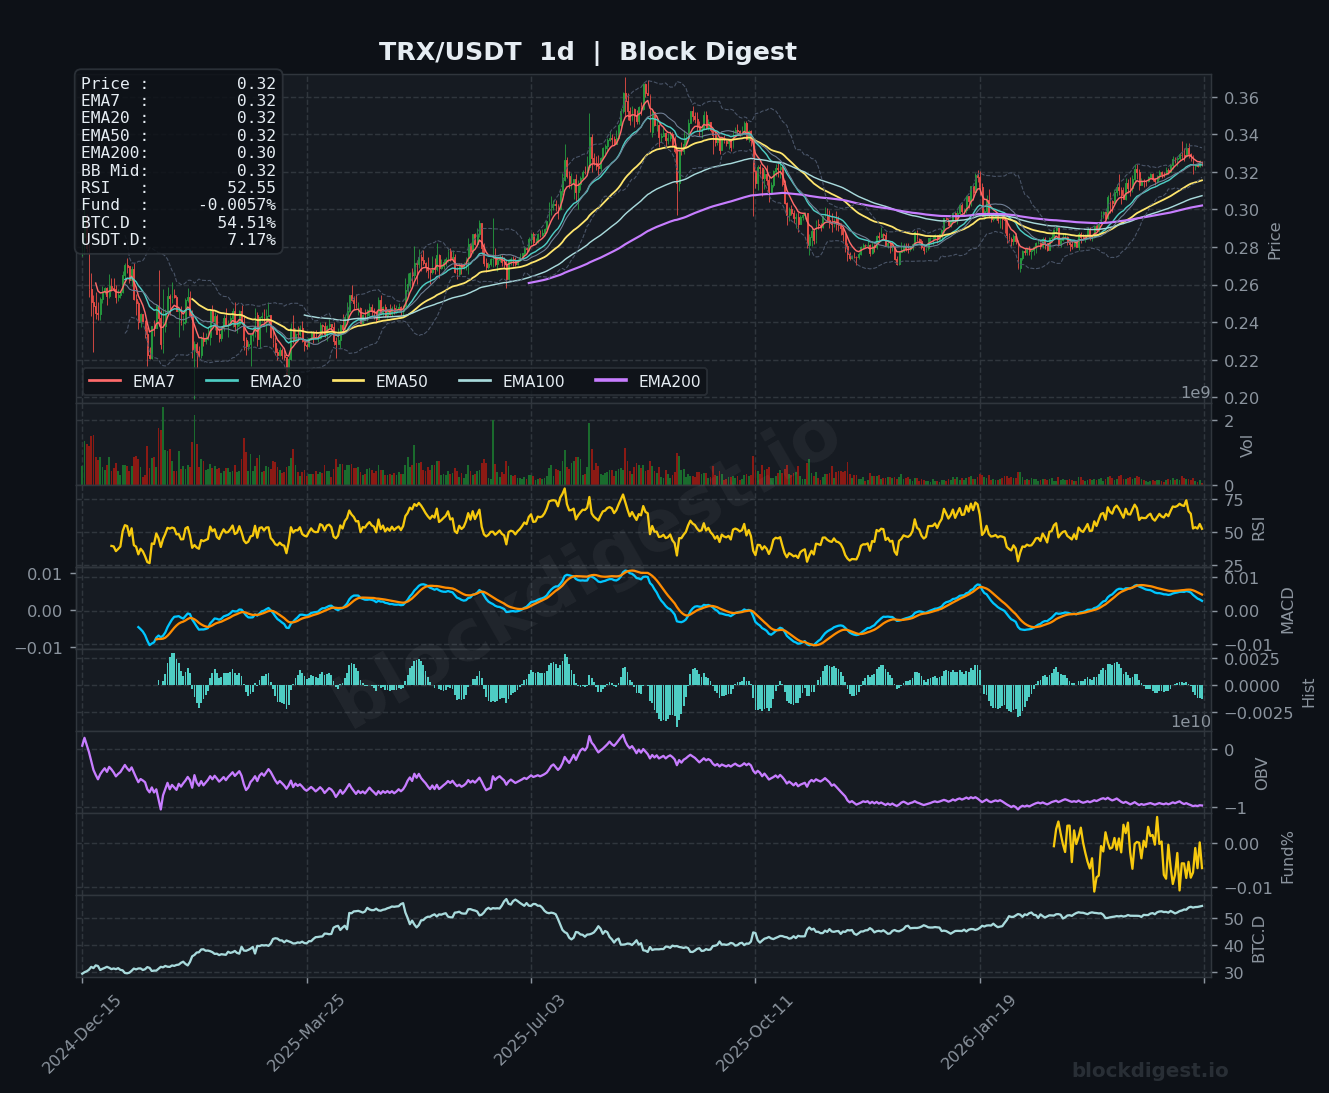
TRON (TRX)
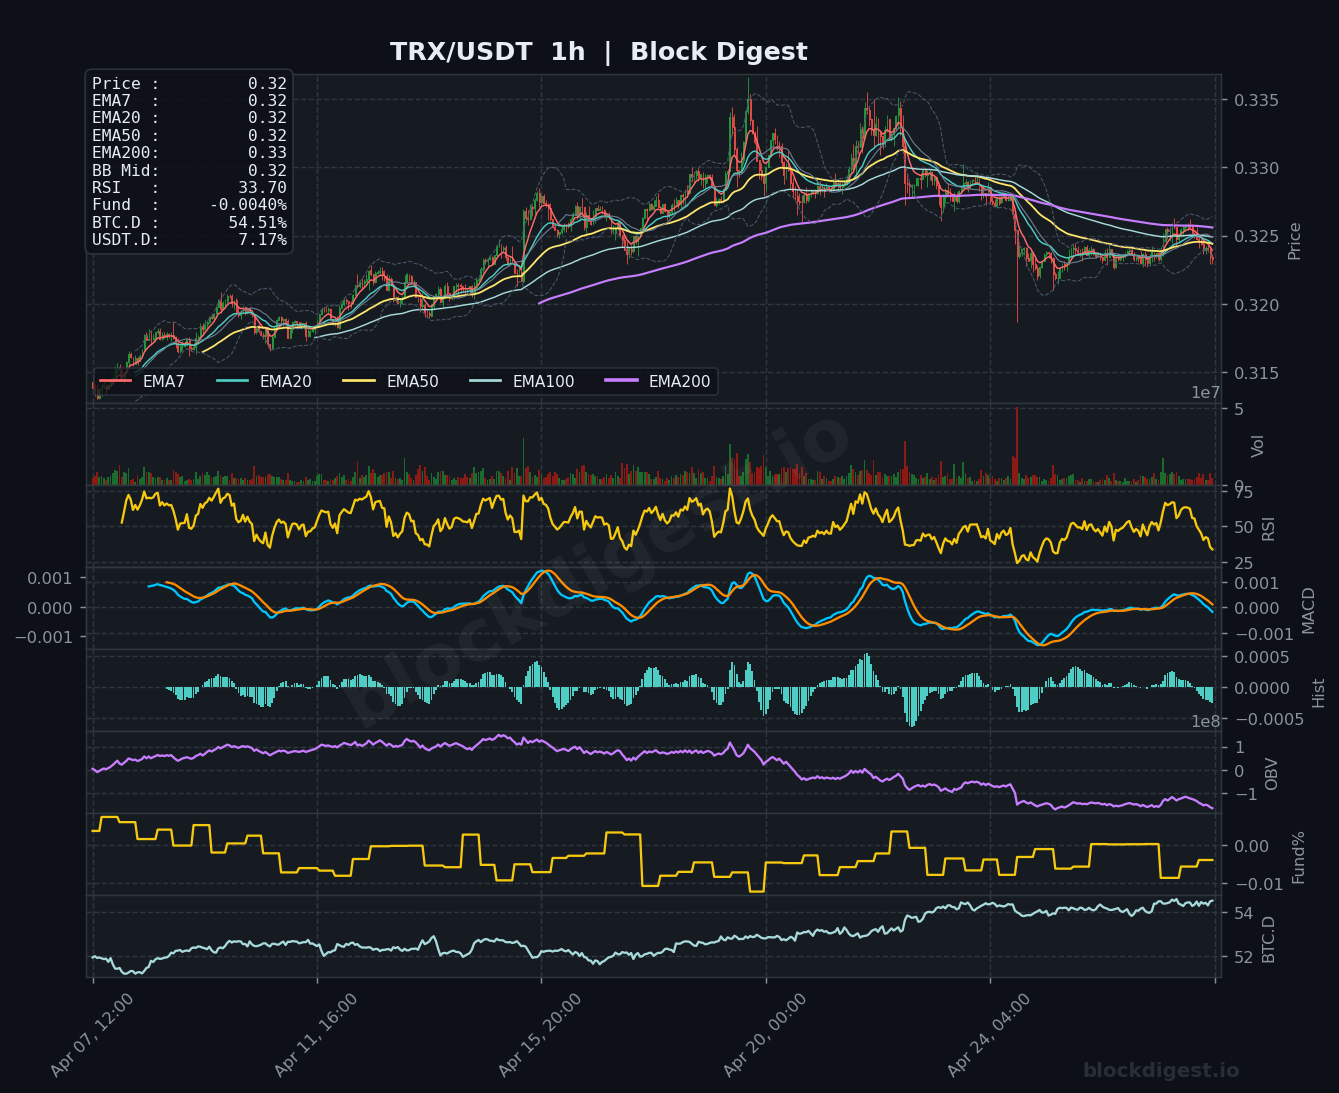
TRON trades at $0.32, positioned just below its short-term moving averages with EMA7 at $0.32 and EMA20 at $0.32, indicating price consolidation. The 1-hour chart shows RSI at 33.70, suggesting oversold conditions with potential for relief bounce, though MACD remains negative indicating persistent bearish pressure. The 4-hour timeframe reveals TRX in a corrective phase from recent highs near $0.335, with price testing support at the EMA50 level around $0.32. On the daily chart, TRX demonstrates relative strength compared to other altcoins, maintaining proximity to its EMA cluster and showing a more constructive trend structure. The RSI on the daily reads 52.55, indicating neutral momentum with room for upside, while OBV has been relatively stable. Key support sits at $0.318-0.320, while resistance stands at $0.325-0.327, with TRX showing one of the tighter consolidation patterns among major altcoins.
Altcoin Outlook
The altcoin market on April 28, 2026, presents a fragmented landscape with individual coins showing varying degrees of strength and weakness. DOGE and TRX demonstrate the most constructive technical setups with bullish momentum indicators and tight consolidation patterns suggesting potential upside breakouts. Conversely, SOL and LTC exhibit more pronounced weakness, trading below key moving averages with bearish momentum that may require further base-building before sustainable rallies. XRP and BNB occupy middle ground with consolidation structures that could break either direction depending on broader market catalysts. The key conditions to watch include Bitcoin’s ability to maintain current levels (critical for altcoin stability), any significant changes in USDT dominance (currently stable at 7.17%), and whether individual altcoins can reclaim their respective EMA200 levels on daily charts, which would signal meaningful trend reversals from current corrective phases.
Disclaimer: This analysis is for informational purposes only and does not constitute financial advice. Cryptocurrency markets are highly volatile and unpredictable. All trading decisions should be made based on your own research and risk tolerance. Block Digest is not responsible for any financial losses incurred as a result of acting on this content.
Charts