BTC Daily Analysis — April 28, 2026
Market Overview
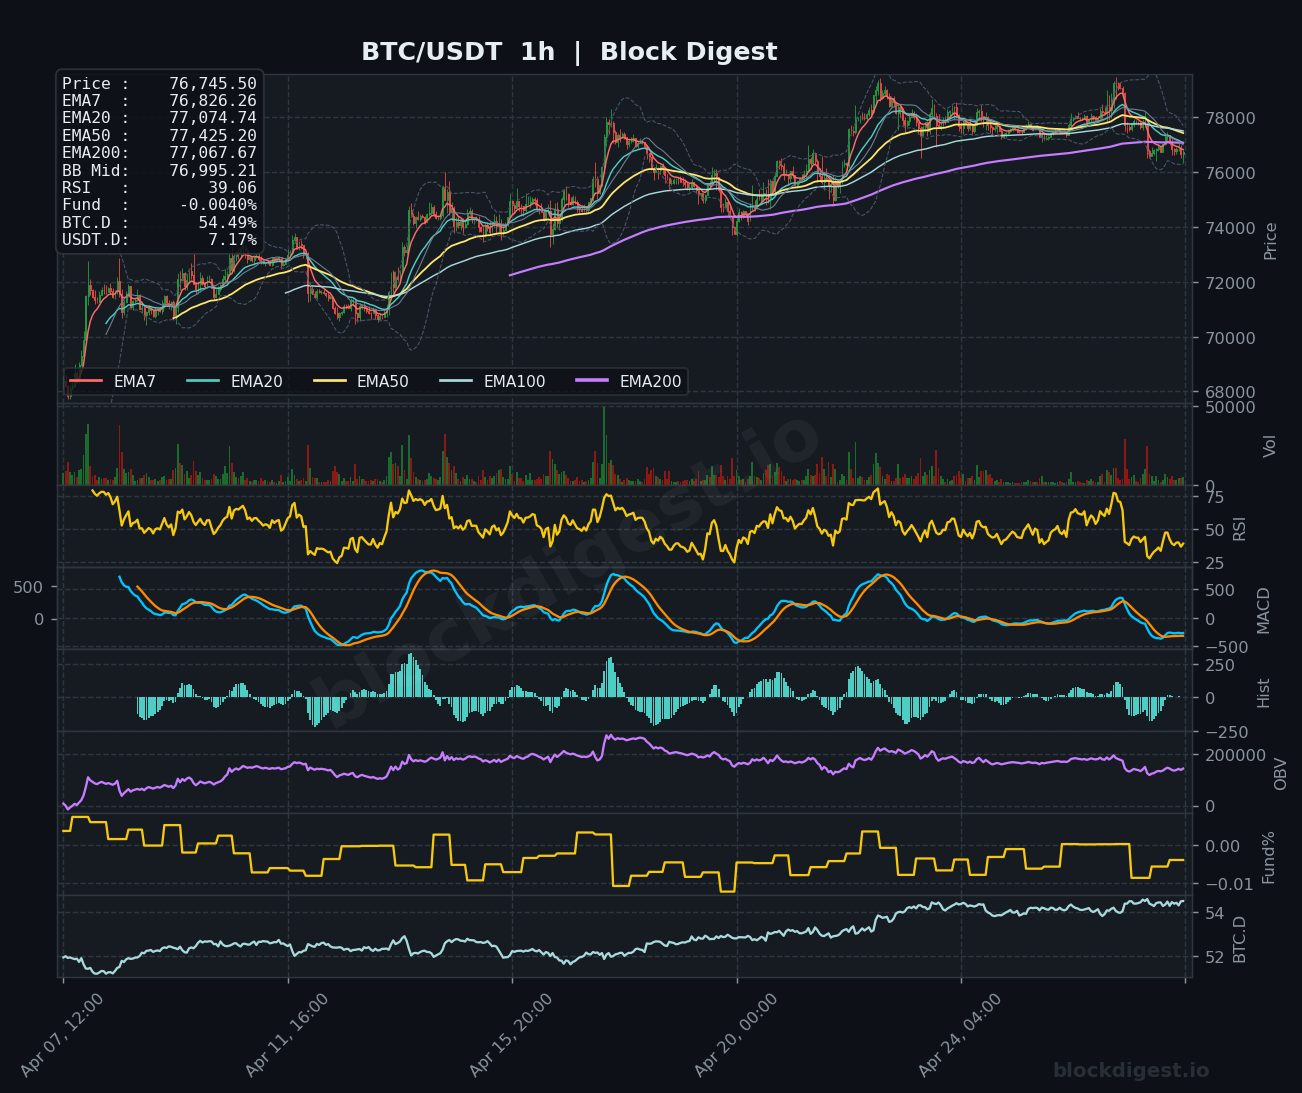
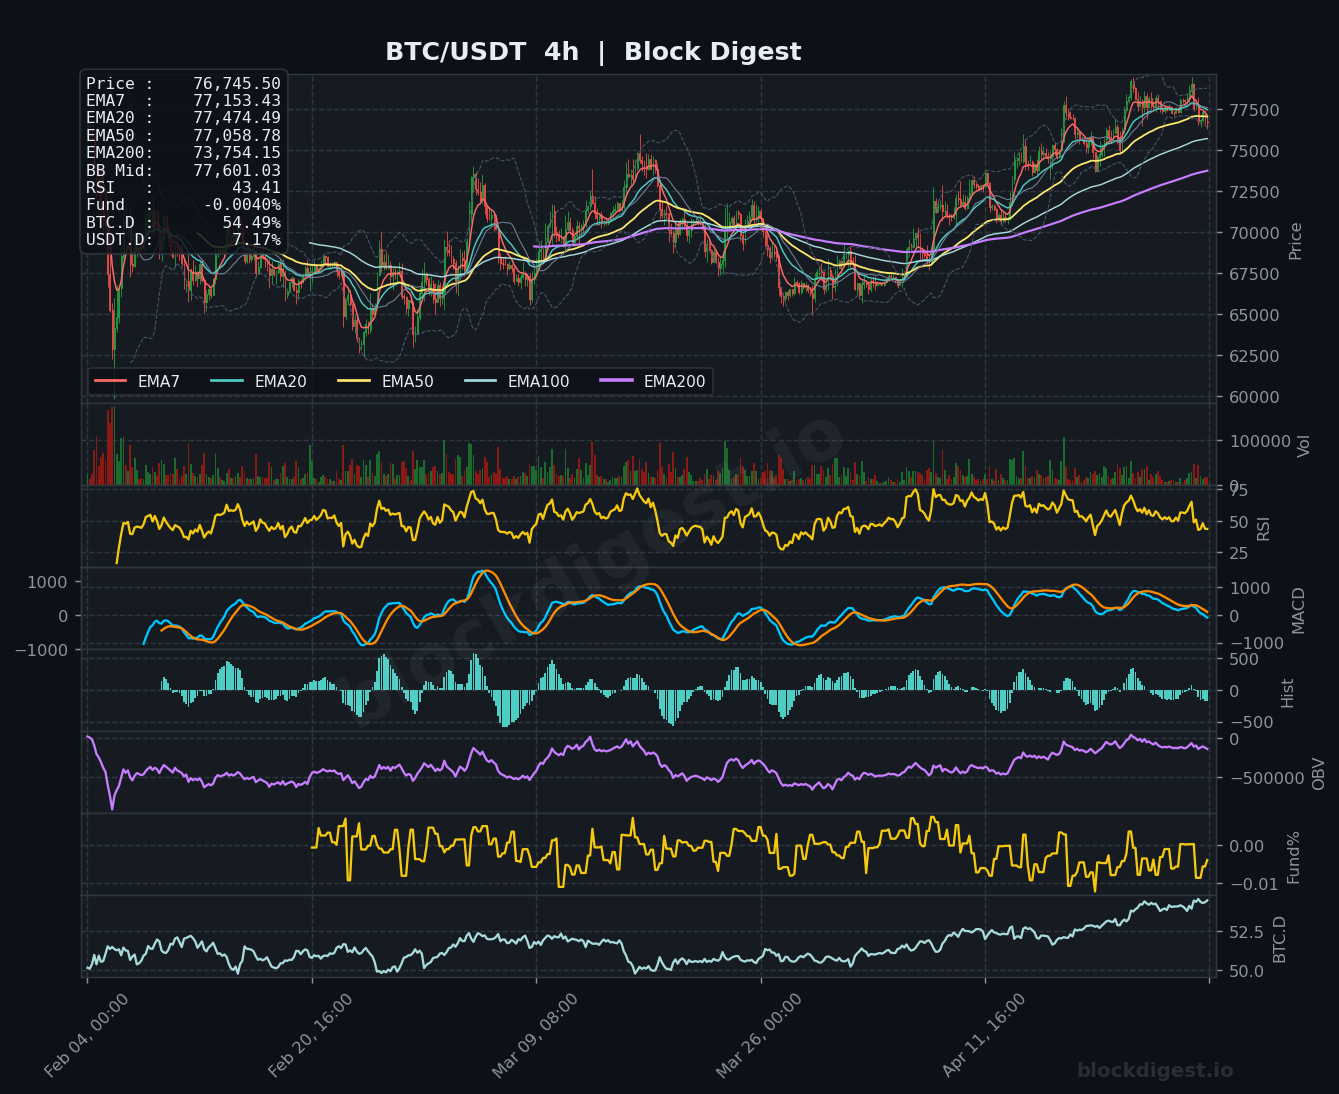
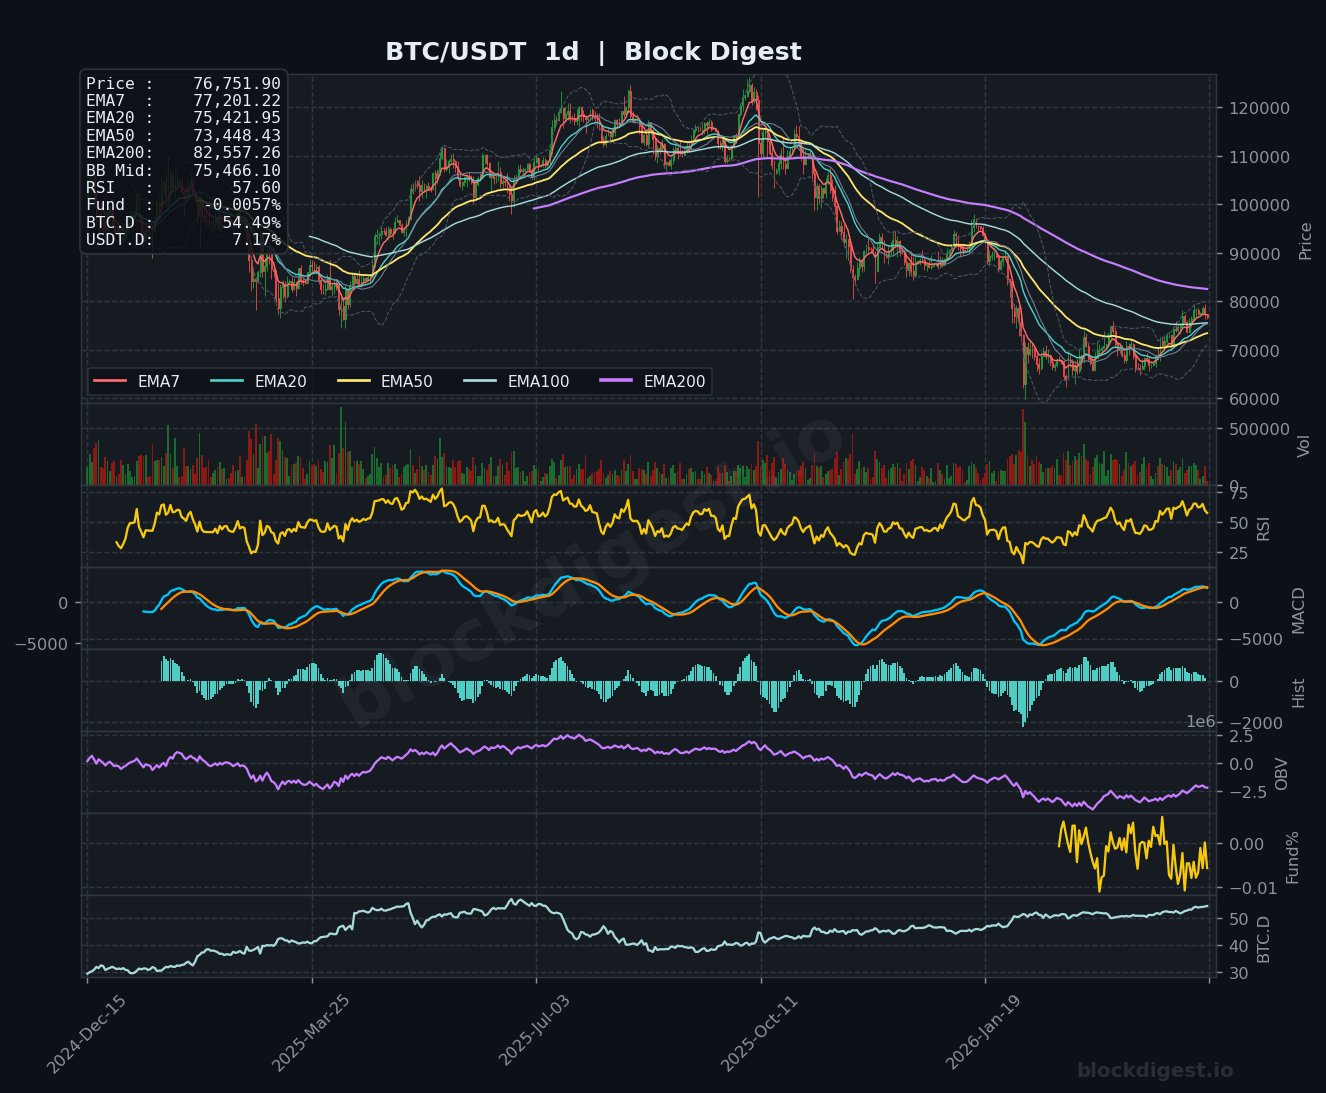
Bitcoin is trading at $76,745, exhibiting signs of weakness as price action has breached below multiple short-term exponential moving averages on the hourly timeframe. The current price sits below the EMA7 ($76,826), EMA20 ($77,074), EMA50 ($77,425), and EMA200 ($77,067), indicating immediate bearish pressure. On the daily chart, BTC remains structurally compromised below the EMA200 ($82,557) while hovering near the lower boundary of a descending Bollinger Band formation. The 4-hour timeframe shows price compressed below the EMA50 ($77,058), suggesting consolidation near critical support with diminishing bullish momentum across multiple timeframes.
Multi-Timeframe Confluence
The alignment across timeframes reveals a concerning deterioration in market structure. While the daily chart shows BTC attempting to stabilize after a prolonged downtrend from the $120,000 region, the 4-hour and 1-hour charts display fresh weakness with price consistently rejected at declining moving averages. The EMA200 on the 1-hour chart at $77,067 has converged with the 4-hour EMA20 at $77,474, creating a dense resistance cluster between $77,000-$77,500 that has effectively capped recent recovery attempts. The daily EMA50 at $73,448 represents a critical medium-term support level that, if breached, would confirm continuation of the broader downtrend. Short-term momentum is clearly diverging from any potential daily timeframe recovery, suggesting bears maintain control over immediate price action.
Key Levels to Watch
Resistance:
- $77,425 – EMA50 on the 1-hour chart and Bollinger Band midpoint, representing immediate overhead resistance where sellers have consistently emerged
- $78,000 – Psychological round number and approximate location of recent swing highs visible on the 4-hour chart, confluence with multiple declining EMAs
- $82,557 – Daily EMA200, the most significant resistance level that would need to be reclaimed to signal any meaningful trend reversal
Support:
- $76,500 – Current price zone and lower Bollinger Band on the 1-hour chart, immediate support where buying has temporarily materialized
- $73,448 – Daily EMA50, critical medium-term support that has been tested multiple times and represents a make-or-break level for maintaining any recovery structure
- $69,000 – Previous consolidation zone visible on the daily chart, representing a major support area where significant accumulation occurred
Momentum & On-Chain Signals
Momentum indicators present a unified bearish picture across timeframes. The RSI on the 1-hour chart reads 39.06, indicating oversold conditions but without clear bullish divergence. The 4-hour RSI at 43.41 confirms weakening momentum, while the daily RSI at 57.60 suggests room for further downside before reaching oversold territory. MACD on both the 1-hour and 4-hour charts shows bearish histograms with the signal lines in negative territory and no imminent bullish crossover visible. The MACD histogram on the daily chart has recently turned negative, confirming deteriorating momentum on higher timeframes. On-Balance Volume (OBV) across all timeframes shows declining accumulation patterns, suggesting that distribution continues to dominate. The funding rate at -0.0040% indicates a slightly negative basis, with shorts paying longs, though the magnitude remains modest and doesn’t signal extreme positioning.
BTC Dominance & Market Sentiment
Bitcoin dominance stands at 54.49%, maintaining elevated levels that typically suggest capital concentration in BTC relative to altcoins during periods of uncertainty. USDT dominance at 7.17% remains relatively stable, indicating neither extreme risk-on nor risk-off positioning in the broader crypto market. The combination of elevated BTC.D with sideways price action suggests a defensive market posture where participants prefer Bitcoin’s relative safety while remaining cautious about deploying significant capital into risk assets. This dynamic typically precedes either a decisive BTC breakout or a broader market correction.
Risk Scenarios
Bullish case: A decisive reclaim of $77,425 with sustained trading above the 1-hour EMA50 and Bollinger Band midpoint would invalidate immediate bearish structure and open the door toward testing $78,000-$79,000. Confirmation would require RSI breaking above 50 on the 4-hour chart with bullish MACD crossover and increasing volume, potentially targeting the daily EMA100 zone around $75,466 initially before challenging higher resistance.
Bearish case: Failure to hold $76,500 with a decisive break below would expose the $73,448 daily EMA50 support, likely triggering accelerated selling toward $72,000 and potentially the $69,000 consolidation zone. Confirmation would come from RSI on the daily chart breaking below 50, MACD histogram expanding negatively, and OBV continuing its distribution pattern with increasing volume on down moves.
Outlook
Bitcoin is at a critical juncture with price compressed between immediate support at $76,500 and resistance confluence around $77,425. The technical structure favors bears in the short term given the consistent rejection at declining moving averages and deteriorating momentum across timeframes. The next 24-48 hours will likely determine whether BTC can establish a higher low and rebuild bullish structure or whether another leg down toward the daily EMA50 at $73,448 materializes. Traders should watch for volume expansion and RSI divergences as potential early warning signals for directional resolution. A break and hold above $77,500 with supporting momentum would be required to shift the immediate bias, while failure at current levels keeps $73,000-$74,000 firmly in play as the next downside target.
Disclaimer: This analysis is for informational purposes only and does not constitute financial advice. Cryptocurrency markets are highly volatile and unpredictable. All trading decisions should be made based on your own research and risk tolerance. Block Digest is not responsible for any financial losses incurred as a result of acting on this content.
Charts