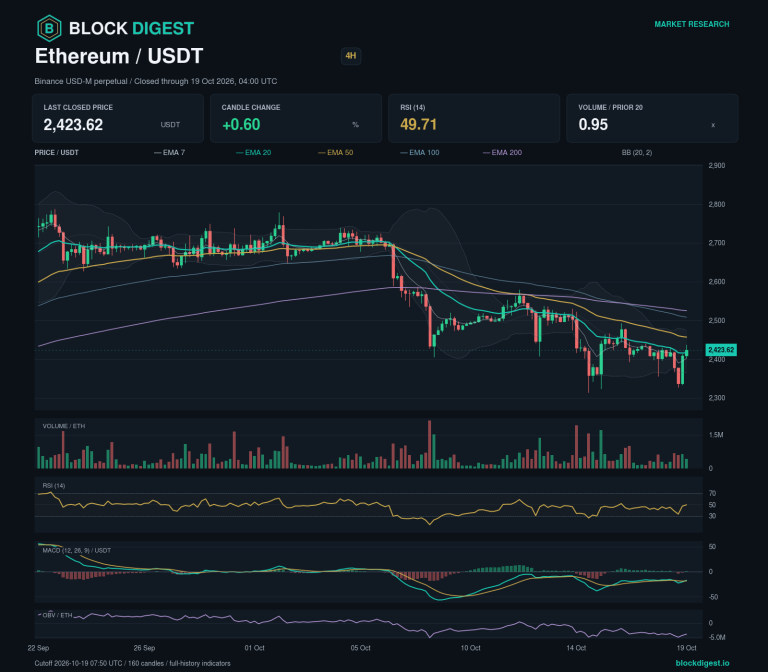
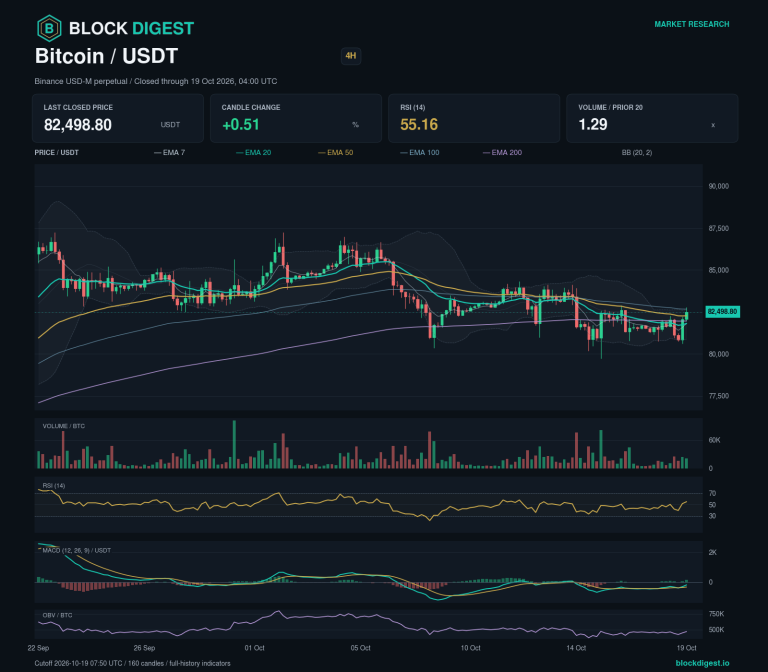
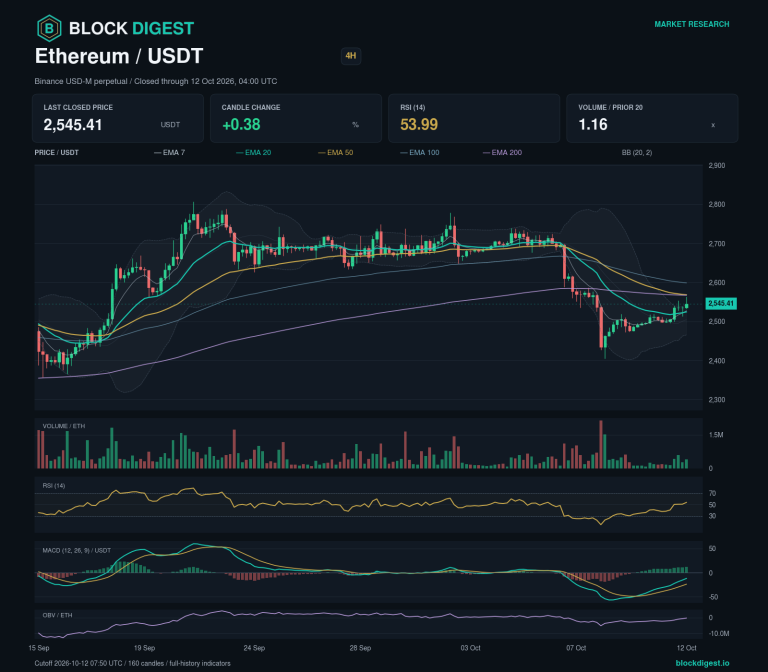
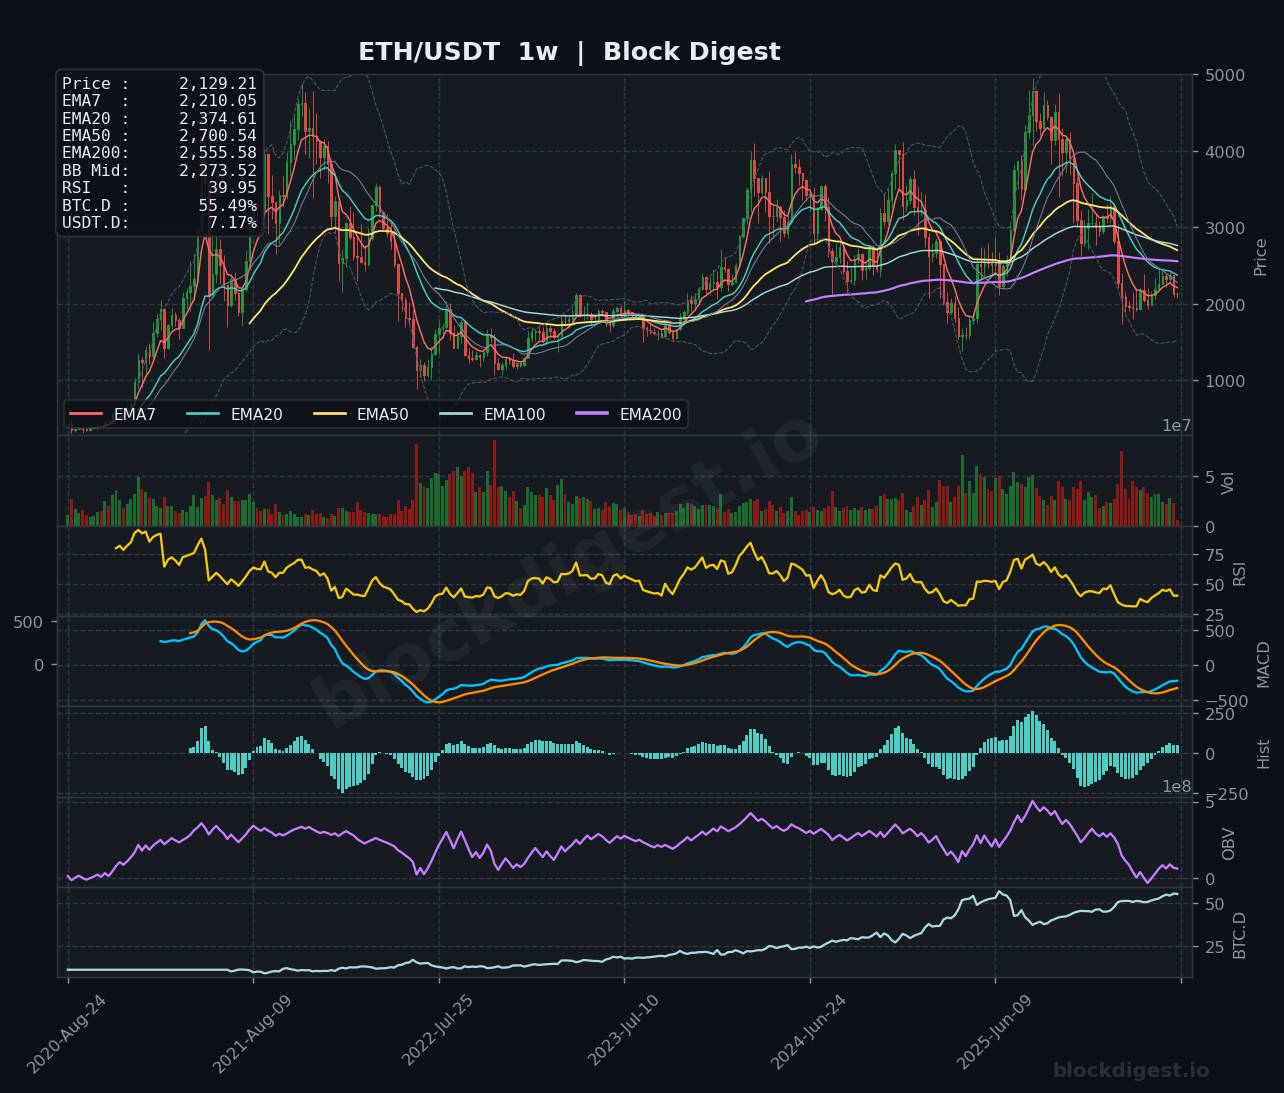
Ethereum closed the week at $2,129, marking another session of sustained weakness as the asset trades deeply below all key moving averages. The weekly candle formed a bearish continuation pattern with price rejecting the EMA7 ($2,210) and closing near session lows, extending the downtrend that began from the February peak near $5,100. This marks the lowest weekly close since early April, with ETH now down over 58% from its 2025 highs. The weekly structure remains firmly bearish as price consolidates below the critical $2,200-$2,400 resistance zone, with sellers maintaining control across all observable timeframes.
Higher Timeframe Structure
The weekly chart reveals complete bearish EMA alignment with price trading below all major moving averages: EMA7 at $2,210, EMA20 at $2,375, EMA50 at $2,701, EMA100 at $2,278, and EMA200 at $2,356. Ethereum is currently testing the lower Bollinger Band at $2,274 while the mid-band sits at $2,274, indicating extreme oversold conditions on the weekly timeframe. The macro trend remains decisively bearish following the breakdown from the multi-month consolidation range between $2,800-$3,500 that held through late 2025 and early 2026. Price action suggests ETH is in a structural downtrend with no significant weekly support until the $1,800-$1,900 zone, which marked a major accumulation area in mid-2025.
Multi-Timeframe Confluence
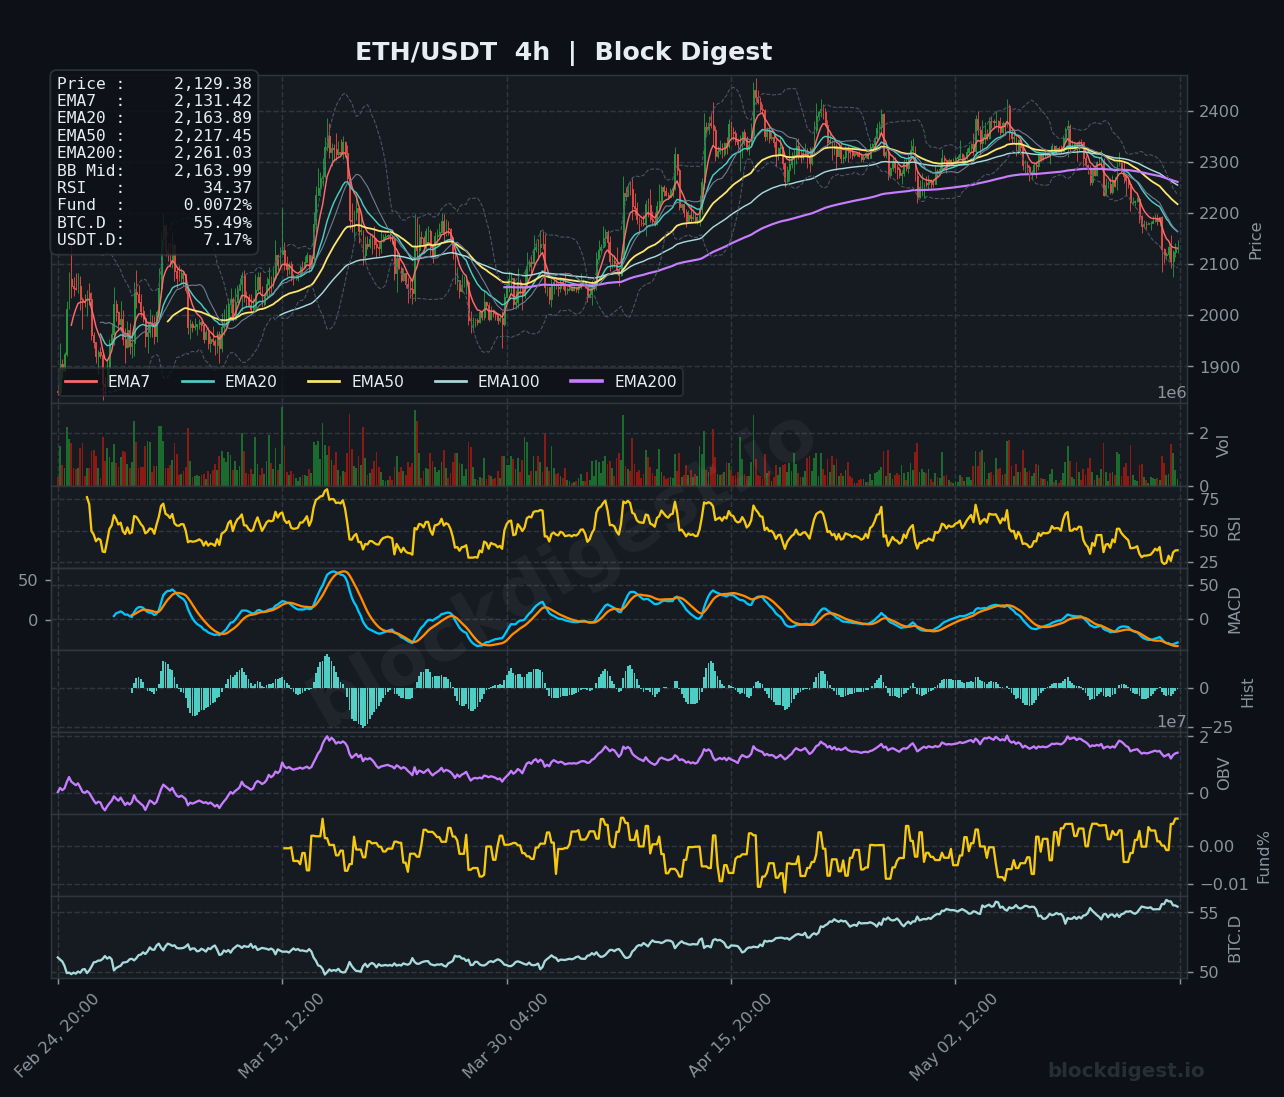
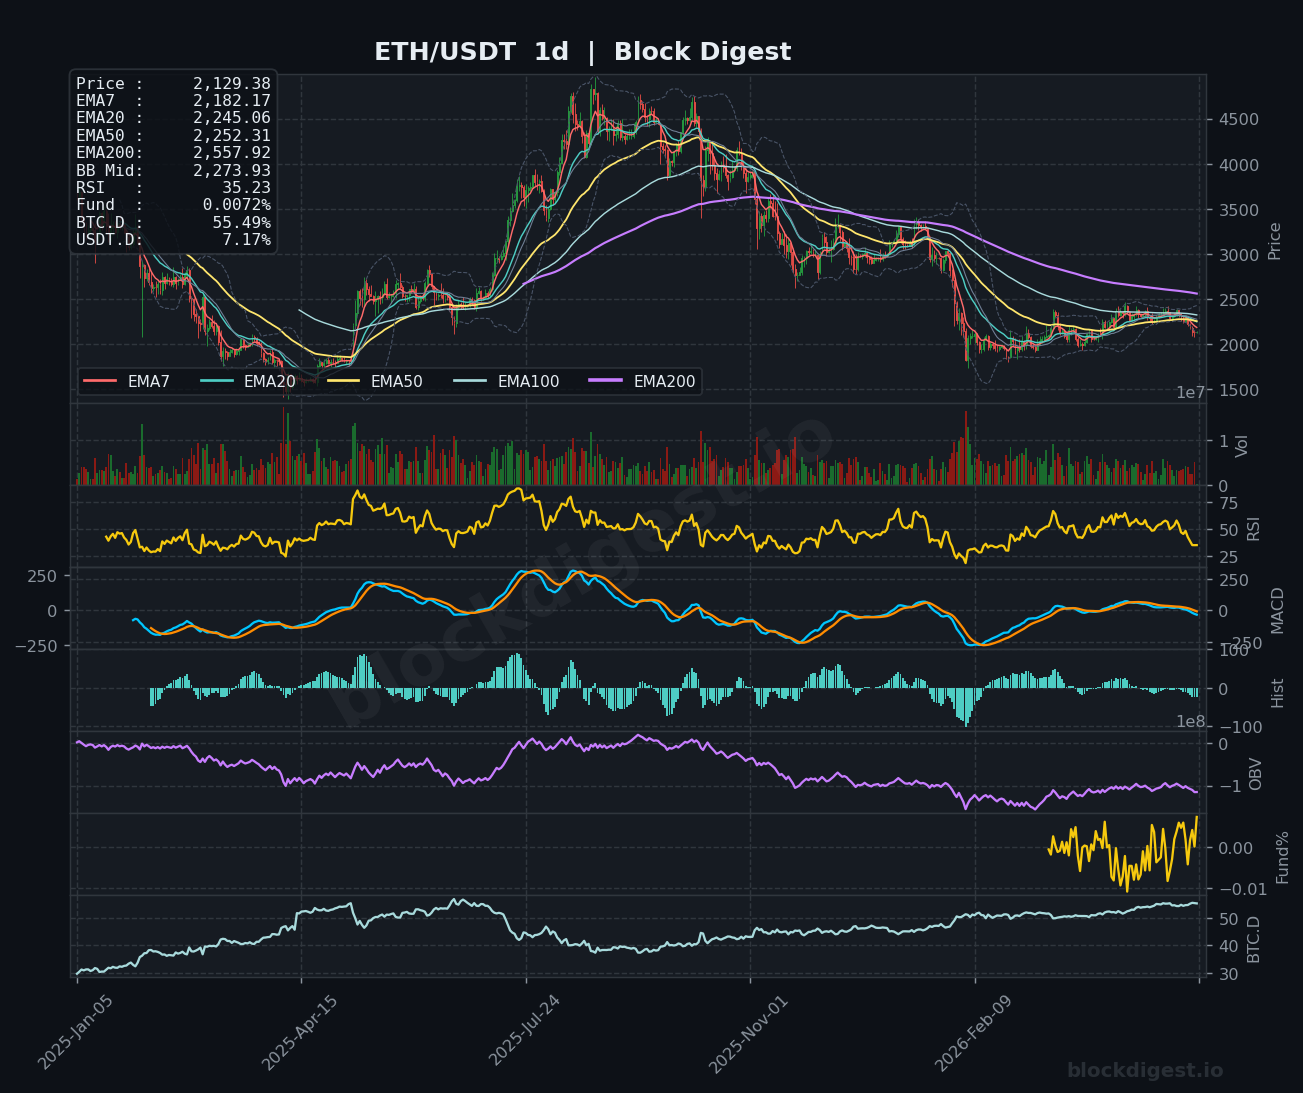
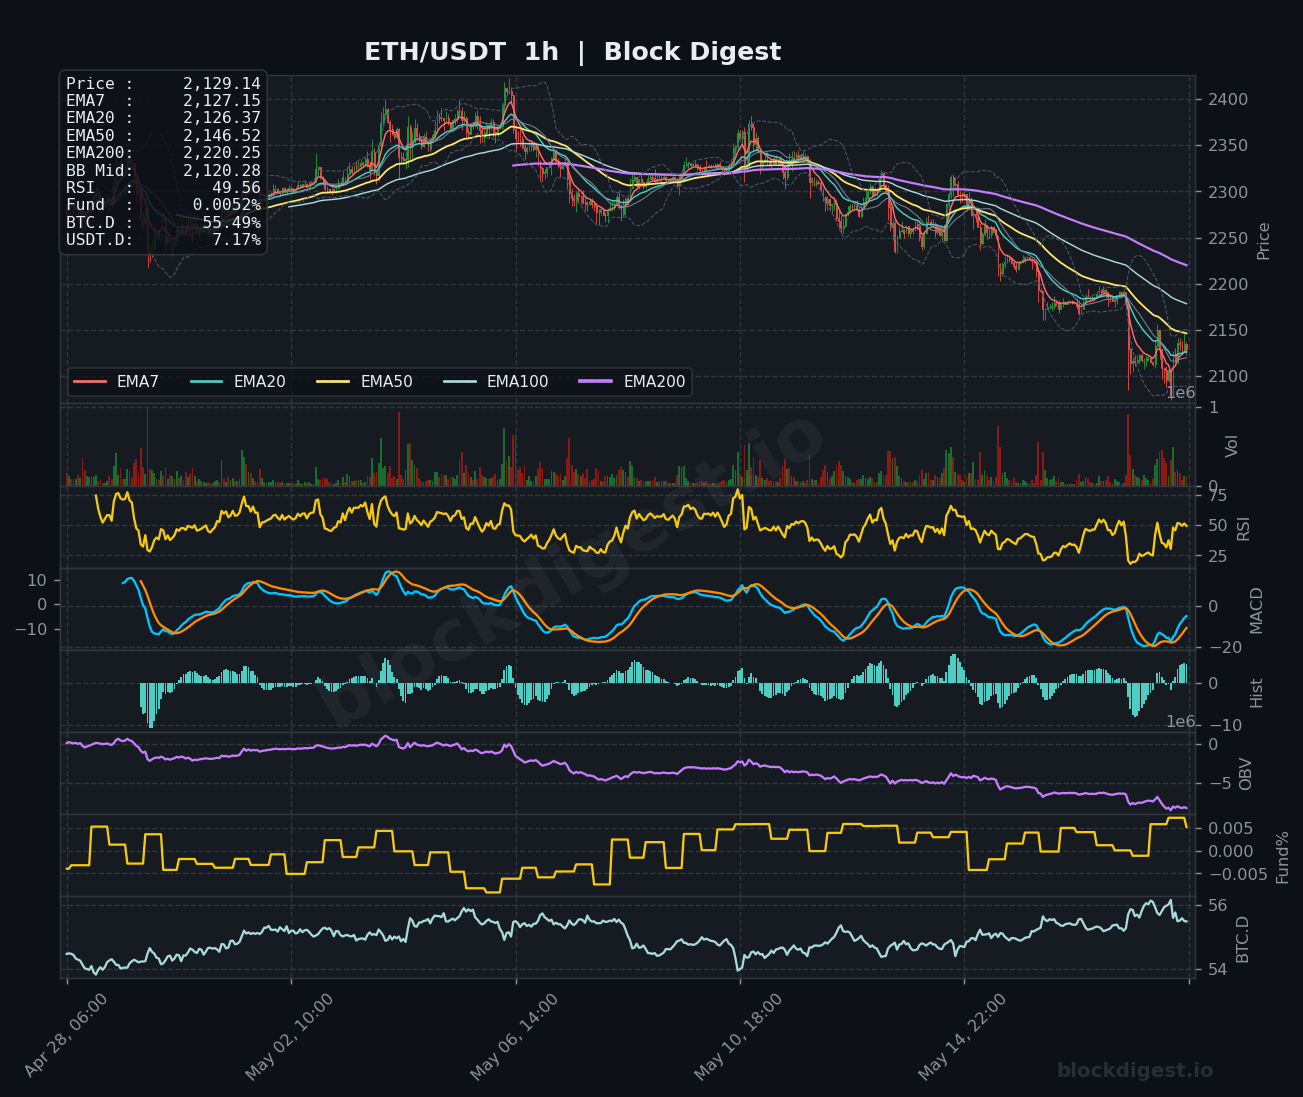
All timeframes from weekly down to 4-hour are aligned bearish, creating powerful downside momentum confluence. The daily chart shows price trapped below the descending EMA200 at $2,358 with RSI at 35.23, while the 4-hour timeframe displays RSI at 34.37, both confirming oversold yet bearish conditions. The 1-hour chart reveals extremely compressed price action below the $2,150 level with RSI at 49.56, suggesting short-term exhaustion but no reversal signal. Key resistance clusters at $2,200-$2,220 (4h EMA50/daily EMA20) align across multiple timeframes, creating a formidable barrier for any relief bounce, while support confluence appears weak until the psychological $2,000 level.
Key Weekly Levels
- Weekly Resistance: $2,273 (Bollinger Band mid-line and immediate overhead resistance), $2,375 (EMA20 and critical breakdown level from April), $2,550-$2,700 (EMA50 zone and major volume cluster from Q1 2026)
- Weekly Support: $2,100 (psychological level and current consolidation low), $1,900-$1,950 (2025 accumulation zone and major historical support), $1,650-$1,700 (multi-year support zone from 2024 lows)
Momentum & Volume Analysis
Weekly RSI sits at 39.95, approaching oversold territory but not yet signaling a reversal, while daily RSI at 35.23 and 4-hour RSI at 34.37 show deeper oversold readings on lower timeframes. The weekly MACD histogram remains deeply negative with both lines trending downward, indicating sustained bearish momentum with no signs of bullish divergence. OBV on the weekly chart shows consistent distribution since February with no accumulation signals visible, suggesting institutional and whale positioning remains net short. The Funding Rate at 0.0072% indicates relatively neutral perpetual futures positioning despite the downtrend, suggesting shorts are not excessively crowded and further downside remains viable without an imminent short squeeze setup.
BTC Dominance & Altcoin Implications
Bitcoin dominance currently sits at 55.49%, having rallied from the low-50s in recent months as capital rotates away from altcoins including Ethereum. USDT dominance at 7.17% reflects moderate stablecoin holdings, neither signaling extreme fear nor aggressive risk-on positioning. The rising BTC.D trend coinciding with ETH’s underperformance suggests the broader altcoin market remains under pressure, with capital consolidating into Bitcoin as a relative safe haven within crypto. Until BTC.D peaks and begins reversing, Ethereum faces structural headwinds for any sustained recovery, particularly as the ETH/BTC ratio continues making new cycle lows, indicating Ethereum’s weakness is not merely USD-denominated but also BTC-relative.
Risk Scenarios
- Bull case: A decisive reclaim of $2,200 with sustained trading above the 4h EMA50 at $2,217 could trigger a short-covering rally targeting the daily EMA20 at $2,245 and potentially the weekly EMA7 at $2,210. Bullish divergence forming on daily RSI combined with a BTC.D peak would support a move toward $2,400-$2,500 over the coming weeks, aligning with the weekly EMA20 and Bollinger mid-band. A weekly close above $2,375 would mark the first significant trend change signal in months.
- Bear case: Failure to hold $2,100 would likely accelerate selling toward the $1,900-$1,950 support zone, where major 2025 accumulation occurred. A breakdown below $1,900 with increasing volume would open the door to $1,650-$1,700, representing a 20-25% decline from current levels and potentially triggering cascade liquidations. Continued BTC.D strength above 56% combined with deteriorating on-chain metrics and sustained funding rate pressure would confirm the bear scenario targeting new yearly lows.
Weekly Outlook
The week ahead favors continued consolidation or further downside as Ethereum lacks catalysts for reversal while technical structure remains bearish across all timeframes. Critical levels to monitor include $2,100 support (breakdown accelerates selling) and $2,220 resistance (reclaim suggests short-term bottom formation). With Bitcoin prediction models targeting $80,500 (+4.5%) by month-end while ETH struggles at multi-month lows, relative strength dynamics suggest Ethereum may continue underperforming until macro correlation shifts or ETH-specific catalysts emerge. The risk/reward favors defensive positioning with tight stops above $2,200 for shorts and waiting for weekly EMA reclaims before considering long exposure. Given the 84% correlation with equities and macro uncertainty, upcoming economic data releases will likely drive volatility, making patience and capital preservation paramount in the current environment.
Additional Charts
Disclaimer: This analysis is for informational purposes only and does not constitute financial advice. Cryptocurrency markets are highly volatile and unpredictable. All trading decisions should be made based on your own research and risk tolerance. Block Digest is not responsible for any financial losses incurred as a result of acting on this content.
Stay Ahead of the Market
Follow BlockDigest for crypto market intelligence, research and real-time updates.