
ETH Daily Analysis – May 18, 2026
Market Overview
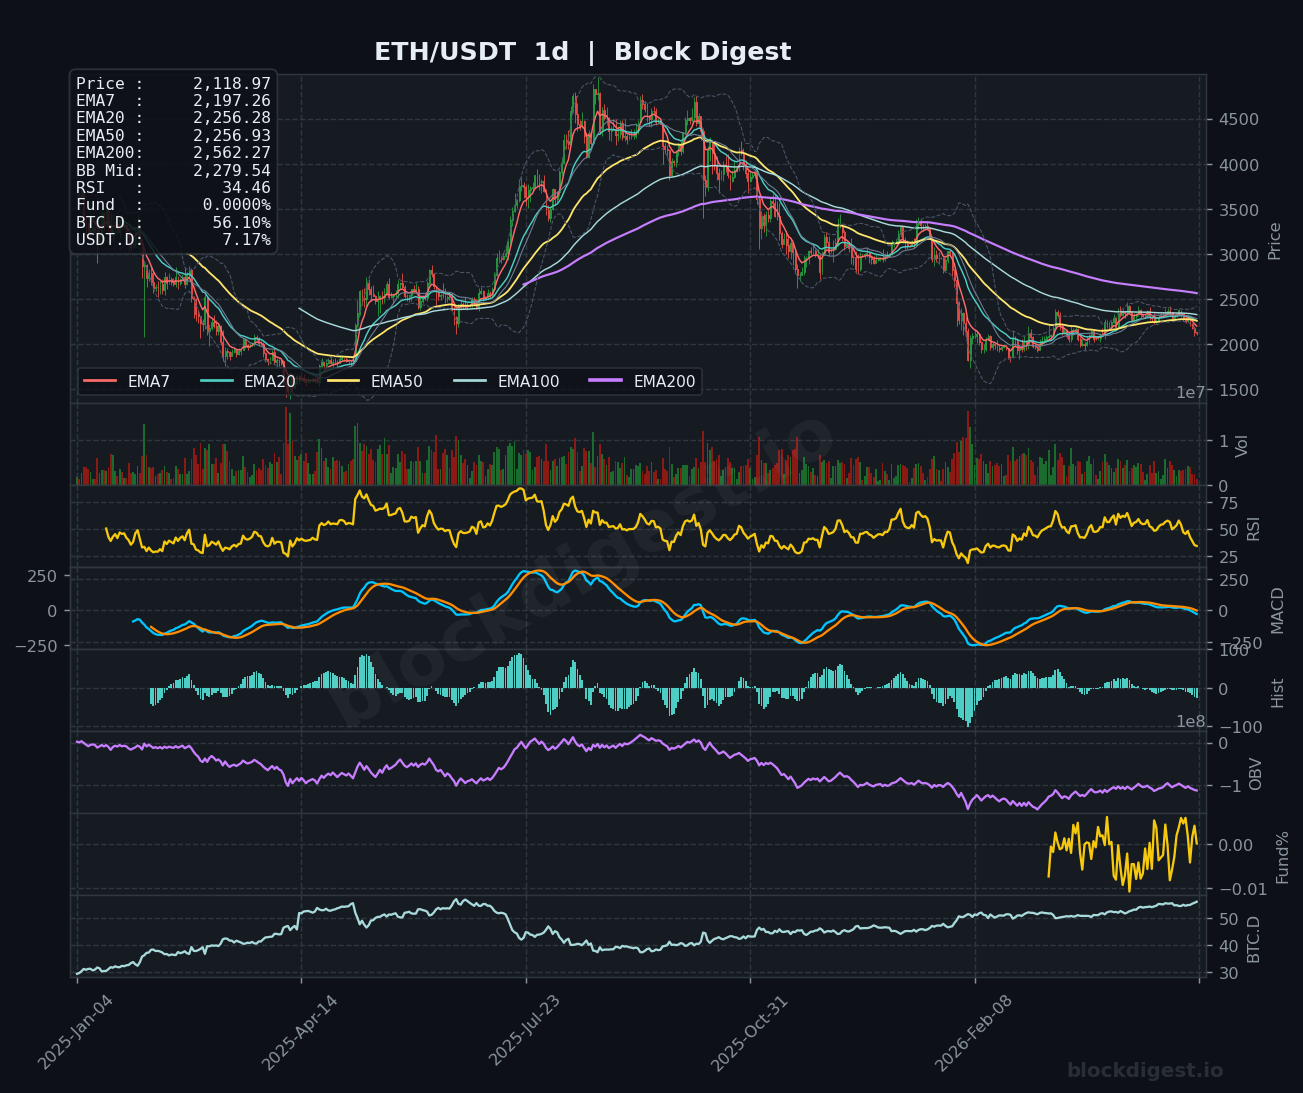
Ethereum is trading at $2,118.97, currently positioned below all major EMAs across timeframes, signaling sustained bearish pressure. On the daily chart, price remains beneath the descending EMA200 at $2,562.27, with the entire EMA structure bearishly stacked (shorter EMAs below longer ones). The Bollinger Band middle line at $2,279.54 continues to act as overhead resistance, while price hovers near the lower band, indicating a downtrend with occasional oversold bounces. The daily structure confirms Ethereum remains in a macro bearish trend with no clear reversal signals emerging yet.
Multi-Timeframe Confluence
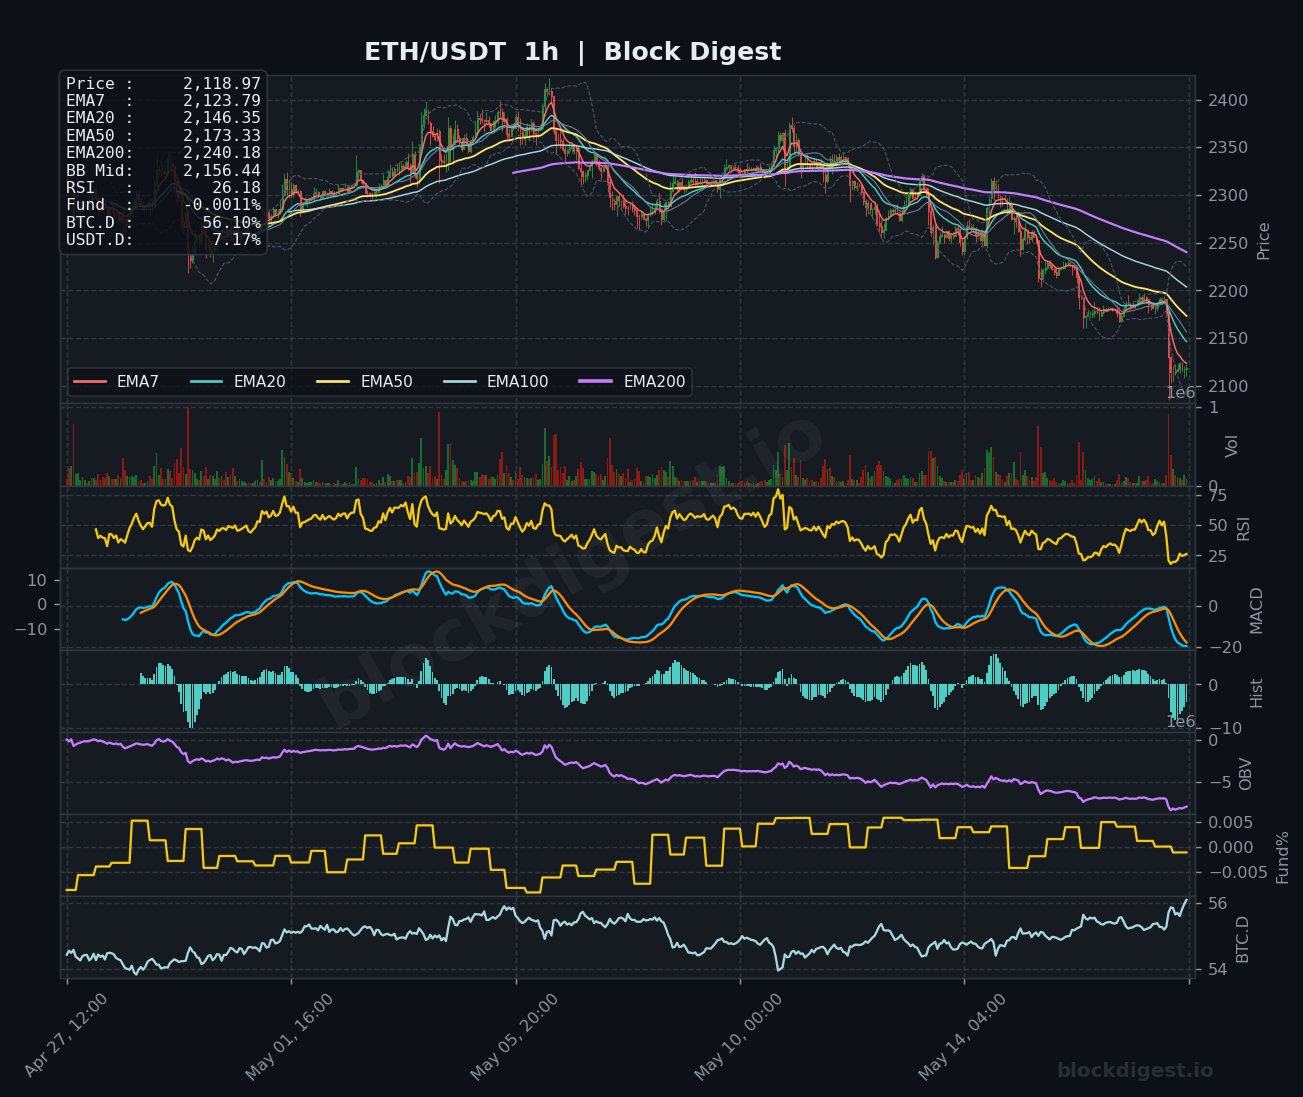
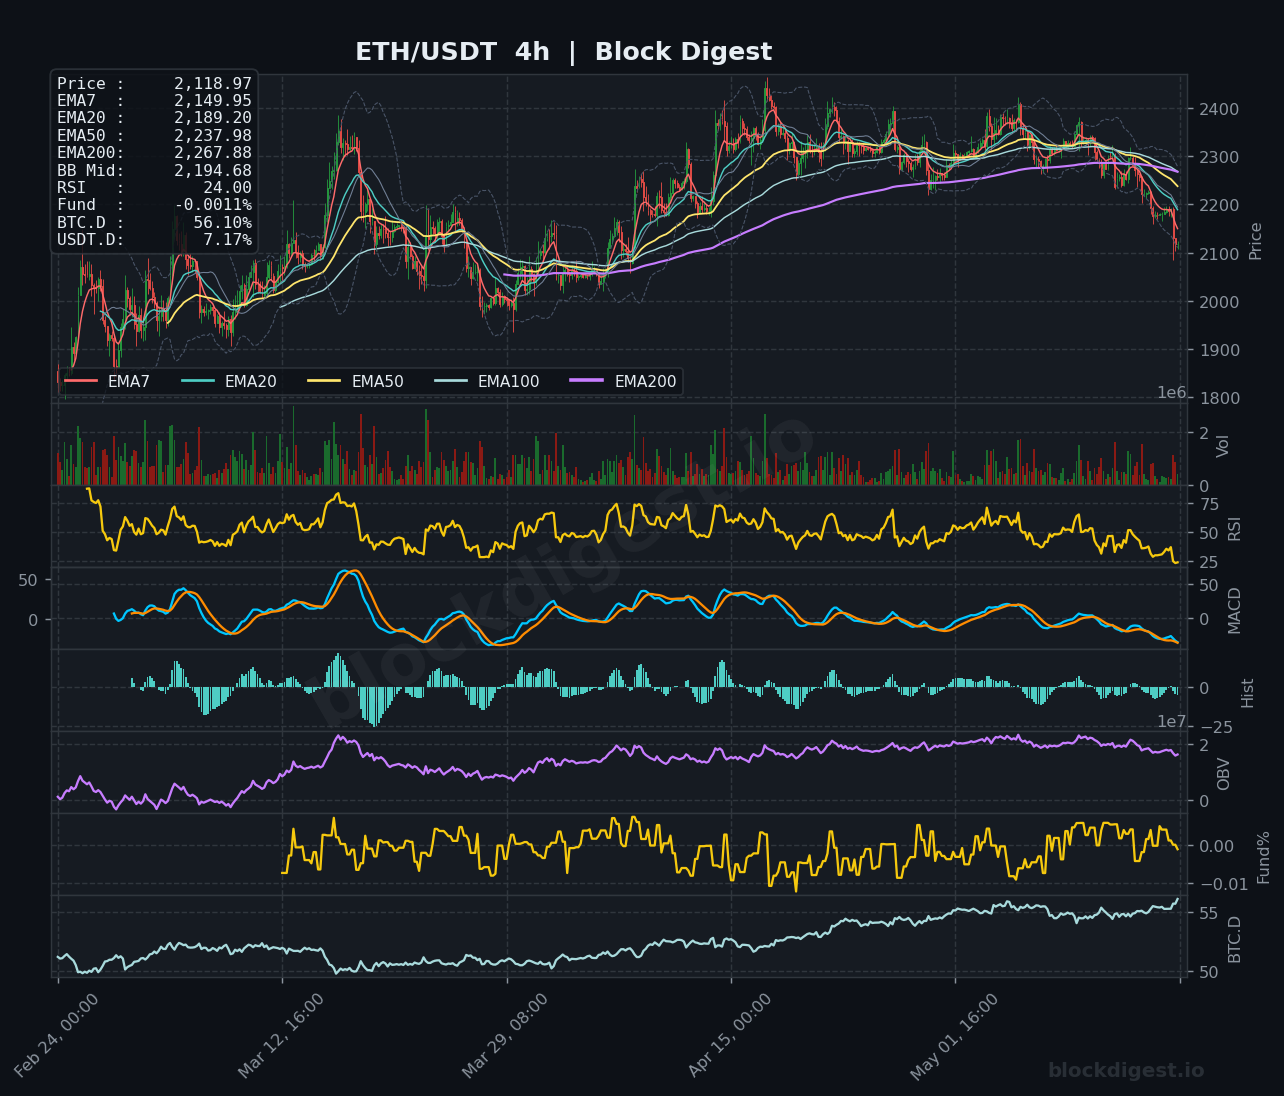
All three timeframes present bearish alignment, though with varying degrees of momentum exhaustion. The 1-hour chart shows price below all EMAs with RSI at 26.18, reflecting oversold conditions that have triggered short-term relief bounces without establishing higher timeframe support. The 4-hour timeframe (RSI: 24.00) confirms this weakness with price trading below the EMA200 at $2,267.88, while the daily chart (RSI: 34.46) suggests the broader downtrend has room to continue before reaching deeply oversold territory. Critical confluence exists at the $2,150-$2,170 zone, where the 1-hour EMA200 ($2,240.18) and 4-hour EMA50 ($2,237.98) converge as near-term resistance, while the $2,100 psychological level provides immediate support across all timeframes.
Key Levels to Watch
Resistance:
- $2,150-$2,170: Immediate resistance zone where 1h EMA200 and 4h shorter EMAs cluster; rejection here would confirm continuation of bearish momentum
- $2,240-$2,270: Critical resistance confluence of 4h EMA200 ($2,267.88) and 1d BB Mid ($2,279.54); reclaiming this zone necessary for any meaningful reversal attempt
- $2,360-$2,400: Major overhead resistance from daily EMA50 ($2,256.93) to previous consolidation lows; breaking above would signal potential trend change
Support:
- $2,100-$2,120: Current price action zone and psychological support; loss would accelerate selling pressure
- $2,050-$2,080: Secondary support from previous swing lows visible on 4h chart; critical defense level
- $1,950-$2,000: Major support zone representing the recent cycle lows; breaking below would target deeper retracement toward $1,800
Momentum & On-Chain Signals
RSI readings across all timeframes indicate bearish momentum with short-term oversold conditions: 1h at 26.18, 4h at 24.00, and daily at 34.46, suggesting the lower timeframes may be due for relief bounces while the daily maintains downtrend capacity. The MACD shows bearish configuration across all timeframes with both lines in negative territory and histograms printing red, though the 1h and 4h charts show histogram compression suggesting waning momentum. OBV continues its declining trajectory on the daily chart, confirming sustained distribution without signs of accumulation, indicating that recent bounces represent exits rather than fresh demand. Funding Rate at 0.0000% (neutral) suggests minimal leverage premium in either direction, typically indicating spot-driven selling rather than futures-led cascades—this can precede either capitulation bottoms or grinding continuation.
BTC Dominance & Market Sentiment
Bitcoin Dominance at 56.10% remains elevated and continues its gradual uptrend, reflecting a risk-off environment where capital flows toward BTC as a relative safe haven within crypto. USDT Dominance at 7.17% has increased from recent lows, confirming broader market risk aversion as stablecoin positioning suggests participants are moving to sidelines rather than rotating into alts. This combination creates significant headwinds for Ethereum—until BTC.D peaks and USDT.D reverses, ETH faces structural pressure regardless of local technical setups, as the macro risk environment favors defensive positioning over altcoin speculation.
Risk Scenarios
Bullish case: A decisive reclaim above $2,150 with RSI breakout above 40 on the 4h chart, accompanied by increasing volume and OBV stabilization, would suggest capitulation has occurred and initial reversal structure is forming, targeting $2,240-$2,270 resistance zone with potential extension toward $2,350 if momentum sustains.
Bearish case: Failure to hold $2,100 support with daily RSI breaking below 30 would likely trigger accelerated selling toward $2,050, then $2,000 psychological support, with a break of this level exposing the $1,950-$1,800 demand zone where prior accumulation occurred.
Outlook
The technical setup remains bearish with all major EMAs providing overhead resistance and momentum indicators showing sustained weakness. The immediate focus is whether the $2,100-$2,120 support zone can hold against continued selling pressure or if we’ll see capitulation toward $2,000. Key triggers for the next 24-48 hours include Bitcoin’s ability to stabilize above $78,000, any shift in BTC.D momentum, and whether ETH can generate a higher low above $2,100 on the 4h chart. A reclaim of $2,150 with volume would provide the first sign of short-term stabilization, but meaningful reversal requires breaking above $2,240-$2,270 to invalidate the immediate bearish structure. Until then, the path of least resistance remains lower, with relief bounces presenting shorting opportunities rather than reversal entries.
Disclaimer: This analysis is for informational purposes only and does not constitute financial advice. Cryptocurrency markets are highly volatile and unpredictable. All trading decisions should be made based on your own research and risk tolerance. Block Digest is not responsible for any financial losses incurred as a result of acting on this content.
Stay Ahead of the Market
Follow BlockDigest for crypto market intelligence, research and real-time updates.


