
BTC
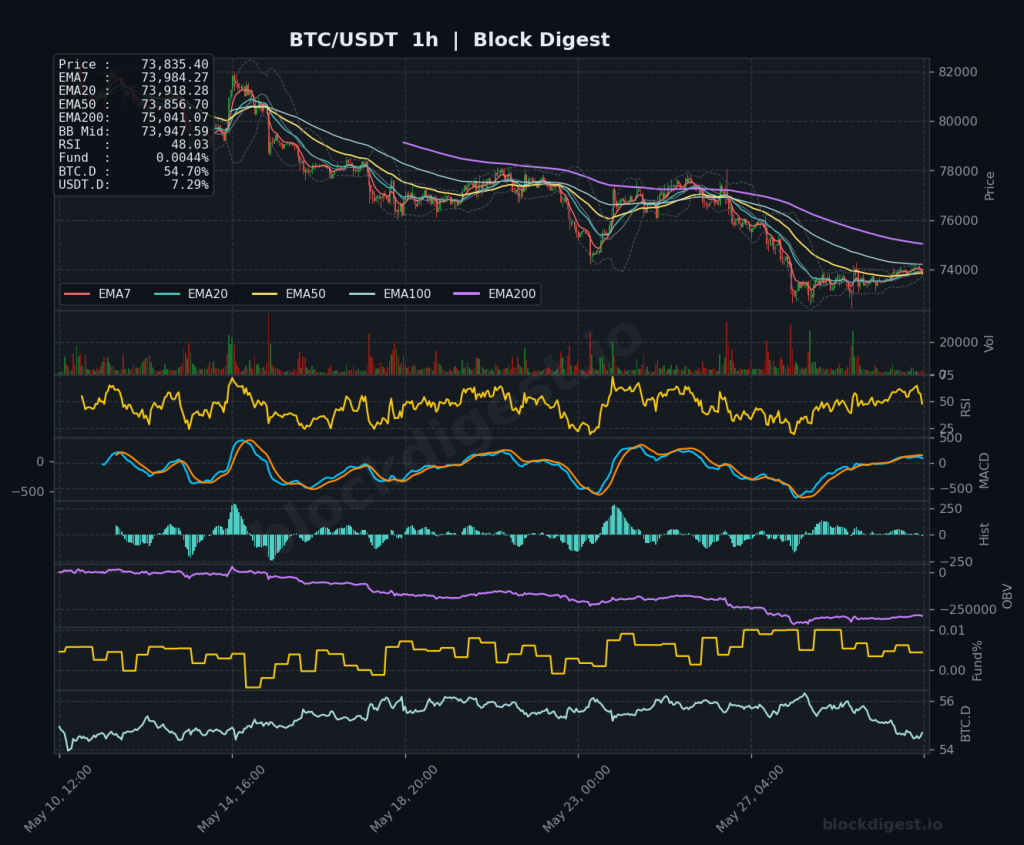
Bitcoin Daily Analysis: Bitcoin Below EMA200 Amid Sustained Selling Pressure
Market Overview Bitcoin is currently trading at approximately $73,836, positioned beneath a stacked bearish EMA structure across all major timeframes, reflecting sustained selling pressure following what appears to be a significant correction from higher levels. On the daily chart, price is trading well below the EMA200 at $81,205, the EMA50 at $76,192, and the EMA20...

Ethereum Daily Analysis: ETH at $2,000 with all major EMAs above price
Market Overview ETH/USDT is currently trading at $2,014.40, hovering precariously at the psychologically critical $2,000 threshold after an extended multi-month downtrend from the August 2025 all-time high of $4,953. On the daily timeframe, price is trading well below all major EMAs — the EMA7 at $2,043.99, EMA20 at $2,120.02, EMA50 at $2,185.64, and the EMA200...
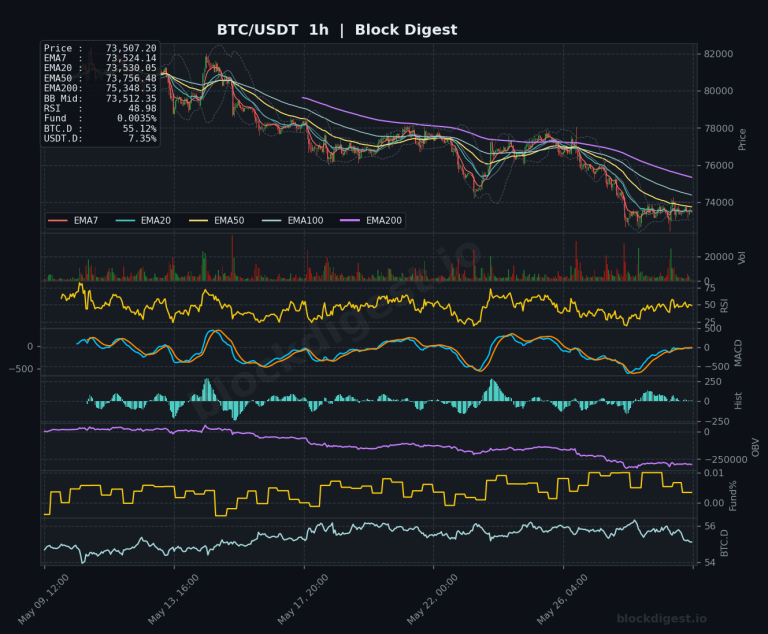
Bitcoin Daily Analysis: BTC Below All Daily EMAs at $73,507
Market Overview BTC/USDT is currently trading at $73,507, sitting below all major daily EMAs — EMA7 ($74,655), EMA20 ($76,345), EMA50 ($76,274), and the EMA200 ($81,248) — painting a clearly bearish structural picture on the daily timeframe. Price has been in a sustained downtrend since the October 2025 all-time high of $126,272, shedding roughly 42% of...
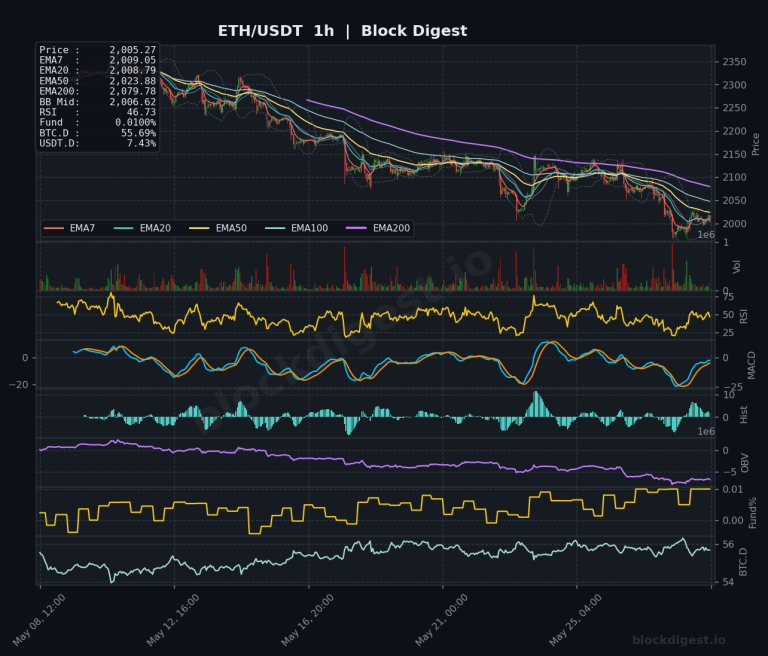
Ethereum Daily Analysis: ETH Tests $2,000 Support Amid Bearish EMA Stack
Market Overview ETH/USDT is currently trading at $2,005.27, sitting at a psychologically significant level as price tests the $2,000 support zone after a sustained multi-month downtrend. On the daily timeframe, the structure remains unambiguously bearish — price is trading well below all major EMAs, with the EMA7 at $2,051.82, EMA20 at $2,130.37, EMA50 at $2,192.31,...

Bitcoin Daily Analysis: Bitcoin Rejected at $77.6K Midline, Below EMAs
Market Overview Bitcoin is trading at $73,360 as of May 29, 2026, sitting firmly below all major exponential moving averages across the daily timeframe — EMA7 at $75,021, EMA20 at $76,637, EMA50 at $76,385, and EMA200 at $81,328. Price has been rejected from the Bollinger Band midline ($77,597) on the daily chart and is pressing...
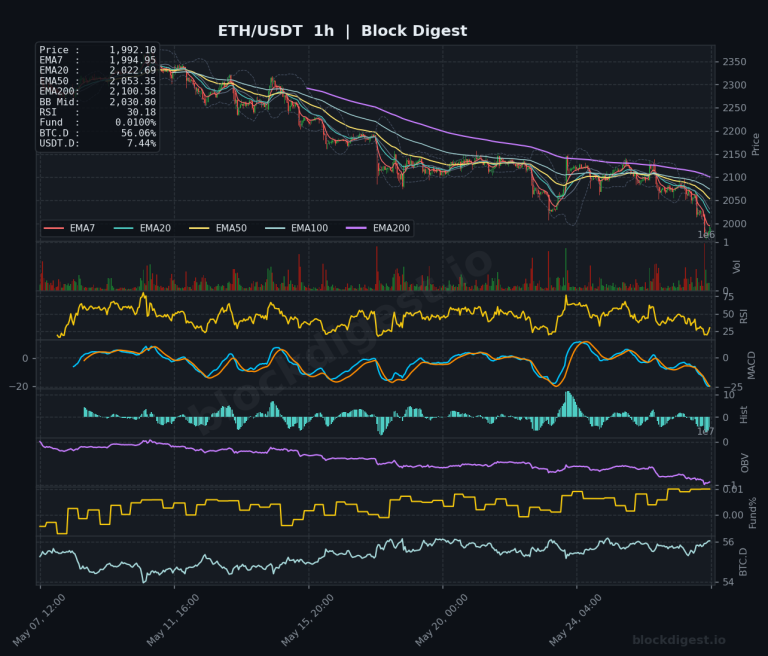
Ethereum Daily Analysis: ETH Breaks Below $2,000 With Stacked EMA Bearish Structure
Market Overview ETH/USDT is trading at $1,992.10 as of May 28, 2026, having slipped back below the psychologically significant $2,000 level — a development that reinforces the bearish macro structure visible across all timeframes. Price is trading well beneath every key EMA on the daily chart, with the EMA7 at $2,063.14, EMA20 at $2,141.94, EMA50...

Bitcoin Daily Analysis: Bitcoin at $73K Below Major EMAs, Bearish Structure
Market Overview Bitcoin is trading at $73,388.10 as of May 28, 2026, caught in a sustained downtrend that has accelerated sharply in recent sessions. Price sits well below all major EMAs on the daily timeframe — EMA7 at $75,524.78, EMA20 at $76,962.86, EMA50 at $76,500.75, and critically, the EMA200 at $81,379.92 — confirming broad bearish...

Ethereum Daily Analysis: ETH Below All Daily EMAs at $2,080
Market Overview ETH/USDT is trading at $2,080.56 as of May 27, 2026, sitting in a structurally weakened position across all major timeframes. Price is trading below every significant daily EMA — the EMA7 at $2,101.04, EMA20 at $2,163.12, EMA50 at $2,209.97, and the EMA200 at $2,519.36 — confirming a well-established bearish trend on the daily...
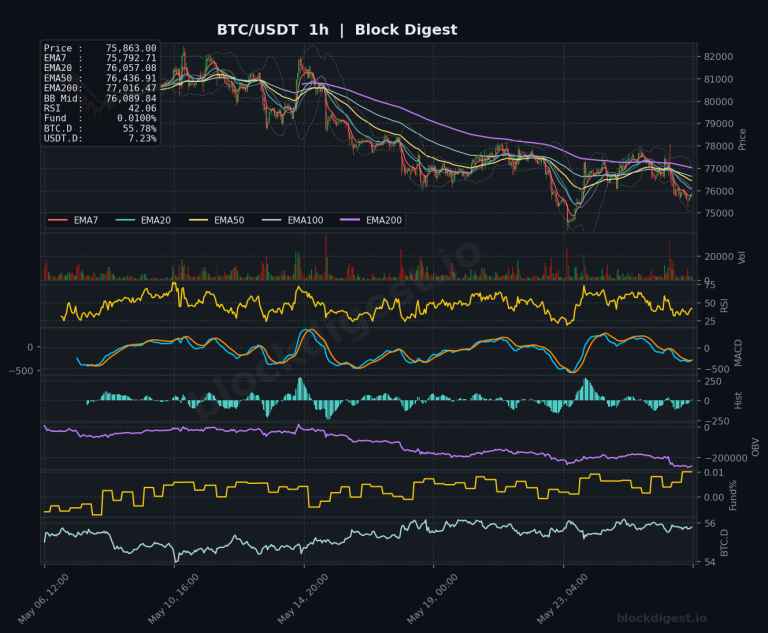
Bitcoin Daily Analysis: BTC at $75.8K Below Bearish EMA Stack
Market Overview Bitcoin is trading at $75,863 as of May 27, 2026, sitting in a technically precarious position well below its all-time high of $126,272 reached in October 2025. Price action on the daily timeframe reflects a prolonged corrective structure, with BTC trading beneath its EMA7 ($76,598), EMA20 ($77,477), EMA50 ($76,684), and significantly below the...

Ethereum Daily Analysis: ETH at $2,098 Below Key EMAs, Bearish Trend
Market Overview ETH/USDT is trading at $2,098.38, sitting in a structurally weak position across all timeframes. On the daily chart, price remains firmly below all major EMAs — the EMA7 at $2,114.21, EMA20 at $2,174.23, EMA50 at $2,216.25, and the EMA200 at $2,524.91 — confirming a sustained bearish trend that has been in place since...
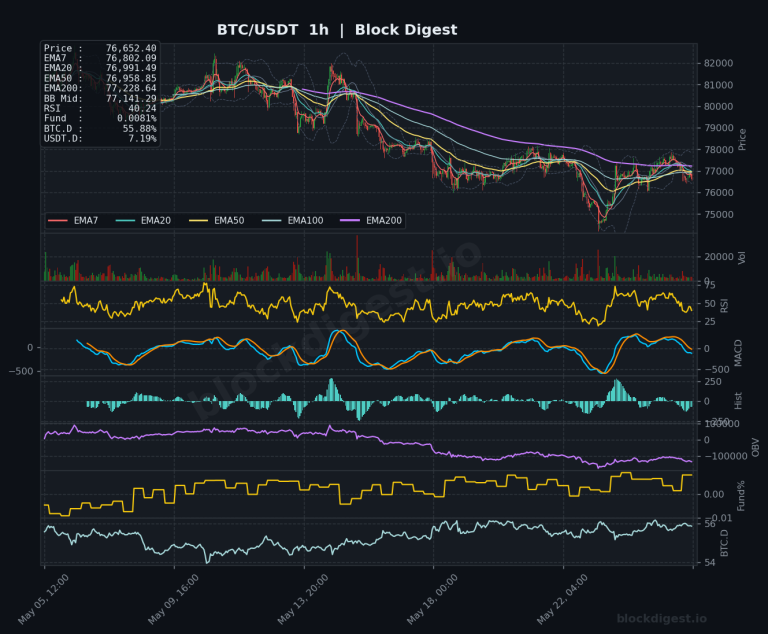
Bitcoin Daily Analysis: Bitcoin below key EMAs at $76,657
Market Overview Bitcoin is trading at approximately $76,657 as of May 26, 2026, caught in a technically precarious position across all major timeframes. Price is currently below all key EMAs on the daily chart — the EMA7 at $77,031, EMA20 at $77,718, and EMA50 at $76,747 — with price hovering just marginally above the EMA50,...
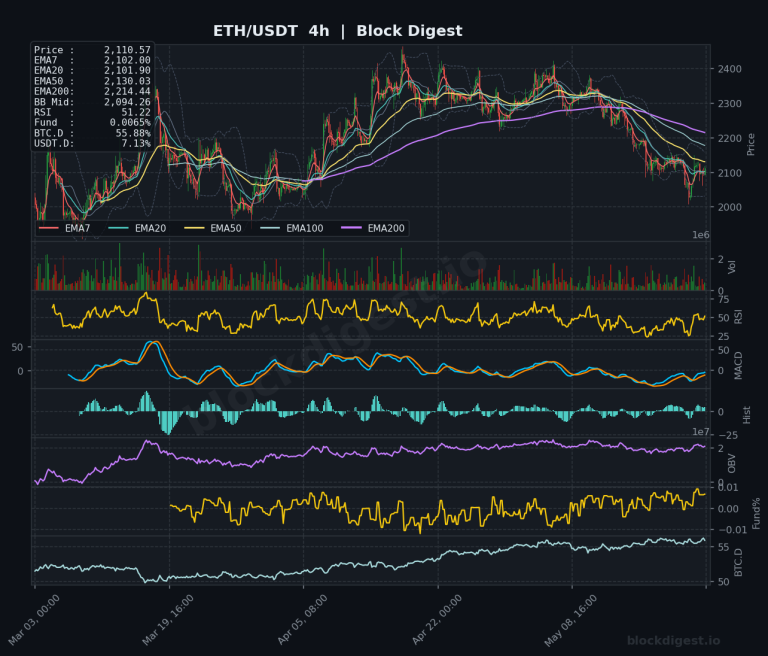
Ethereum Weekly Analysis: ETH Falls to $2,110 Amid 50% Decline From Highs
Weekly Market Overview ETH/USDT closed the week around $2,110, extending a prolonged downtrend that has seen price shed roughly 50% from its 2025 highs near $4,500. The current weekly candle is printing in deeply bearish territory, with price trading well below all major moving averages on both the weekly and daily timeframes. The recent macro...