BTC Daily Analysis — May 13, 2026
BTC Daily Analysis – May 13, 2026
Market Overview
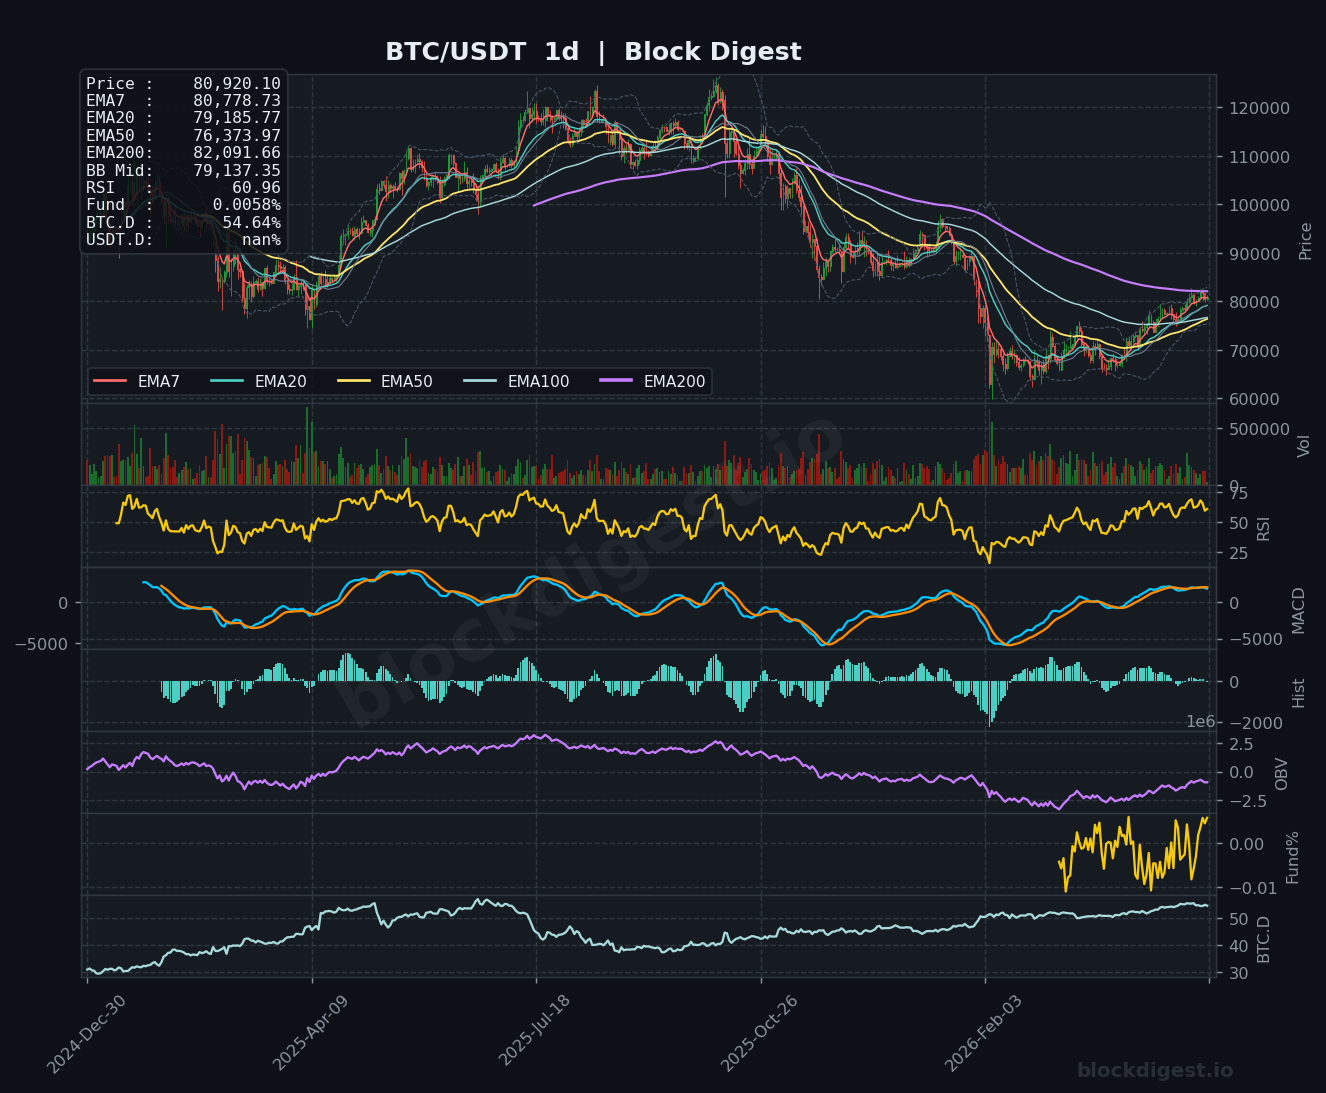
Bitcoin is currently trading at $80,920, positioned above all major short-term EMAs but facing resistance at critical structural levels. The daily timeframe shows price compressed between the EMA50 ($76,373) and EMA200 ($82,091), with the current consolidation testing the upper boundary of this range. Price action remains above the Bollinger Band mid-line ($79,137) on the daily chart, indicating tentative bullish structure, though the proximity to the EMA200 suggests a decisive test is imminent. The overall market structure reflects a recovery phase from previous lows, with bulls attempting to reclaim higher ground while facing substantial overhead resistance.
Multi-Timeframe Confluence
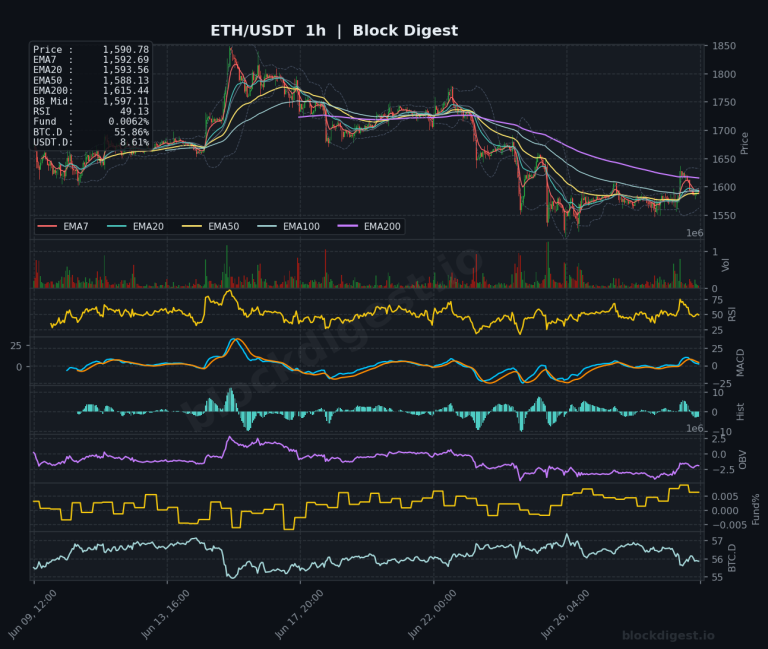
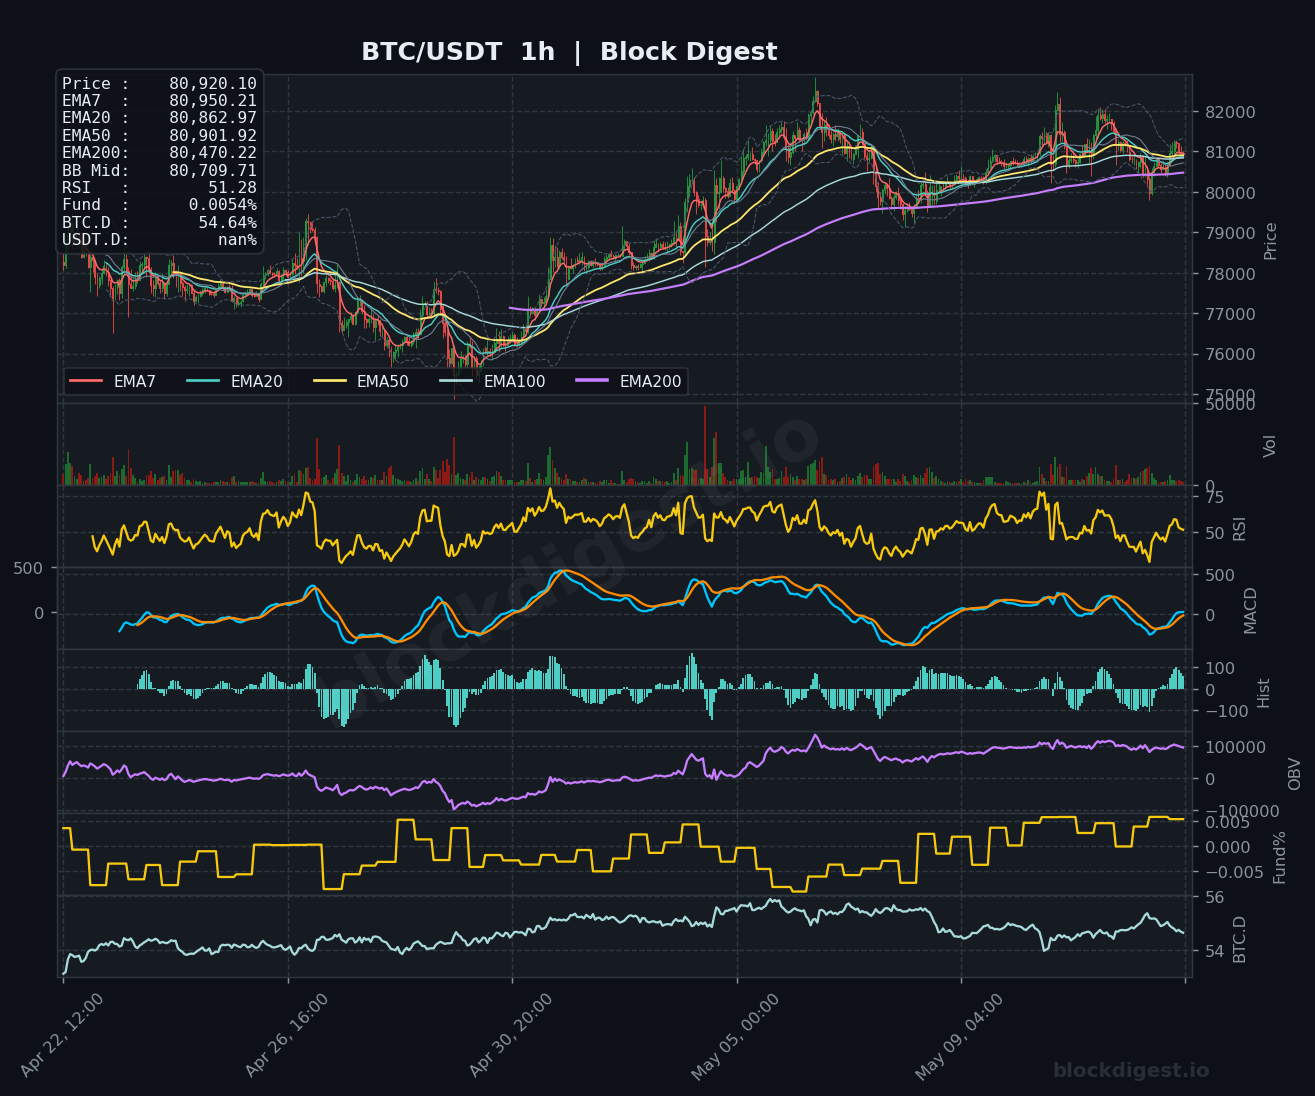
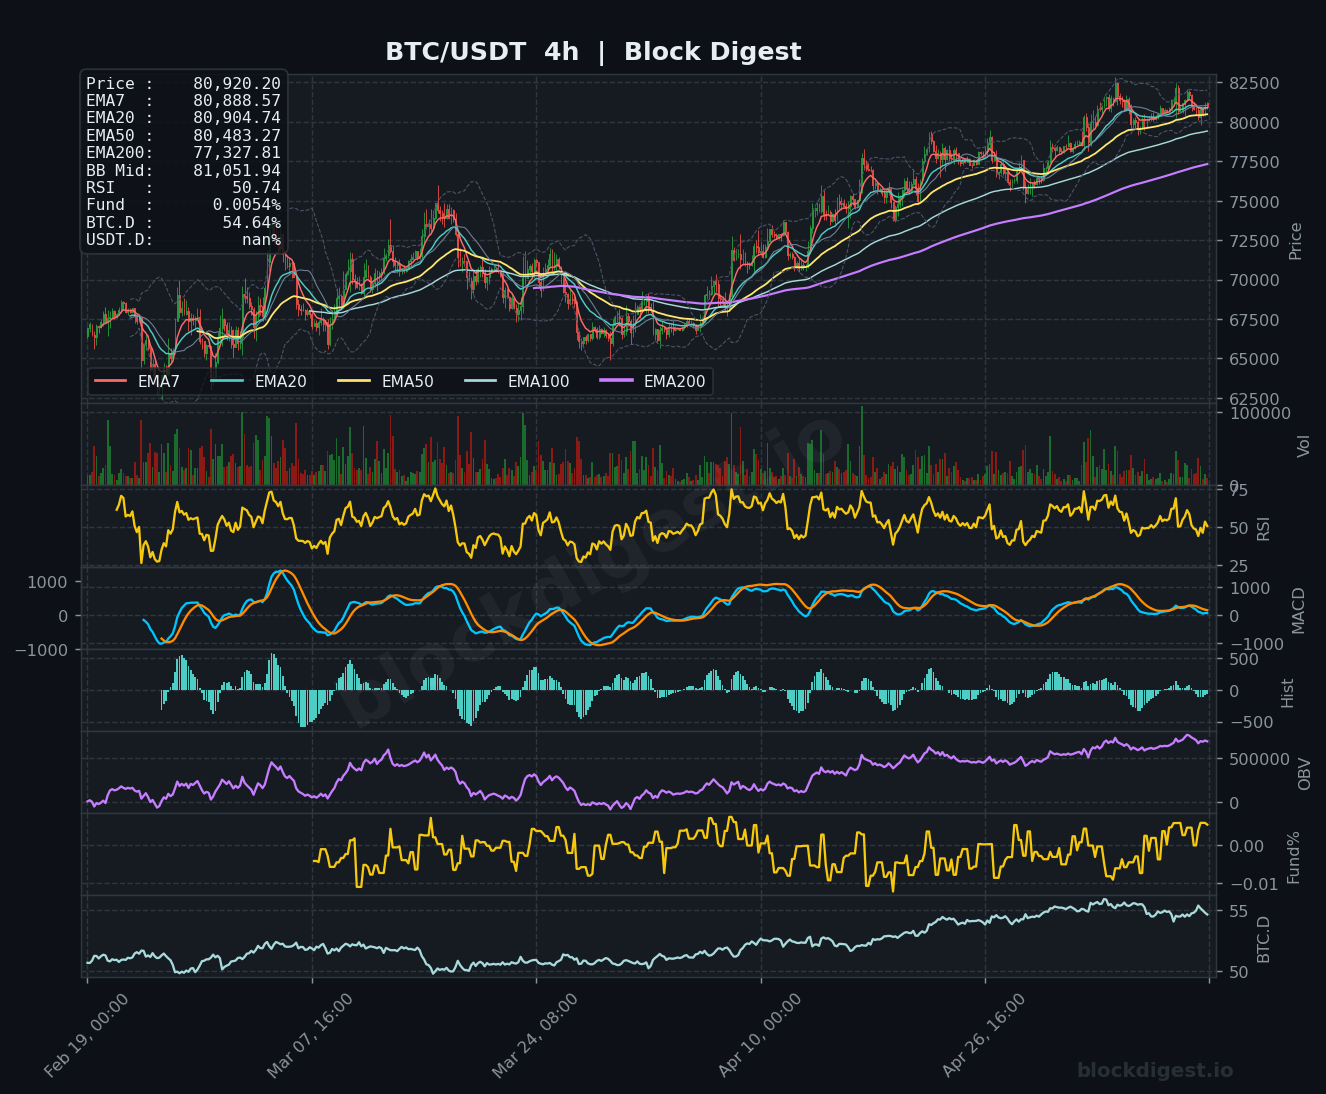
All three timeframes show bullish EMA alignment on shorter periods, with price trading above the EMA7, EMA20, and EMA50 across 1h, 4h, and daily charts, confirming short-to-medium term momentum remains constructive. However, a critical divergence exists at the daily EMA200 ($82,091), which is acting as formidable resistance and has yet to be decisively reclaimed. The 4h chart shows price testing the $82,500 zone with the EMA200 at $77,327 providing strong underlying support, while the 1h timeframe displays tighter consolidation around $80,900 with all EMAs clustered between $80,470-$80,950. The confluence of support around the $80,400-$80,500 level across multiple timeframes establishes this as a key short-term pivot, while resistance alignment near $81,050-$82,500 defines the current battleground for direction.
Key Levels to Watch
Resistance:
- $82,091 – Daily EMA200; critical psychological and technical barrier that has capped recent rallies and represents the gateway to higher targets
- $82,500 – Local high visible on 4h chart and upper Bollinger Band resistance zone; breakout above this level would signal strength continuation
- $85,000 – Major psychological level and previous consolidation zone that would confirm bullish trend resumption if reached
Support:
- $80,400-$80,500 – Confluence zone of 4h EMA50 ($80,483) and EMA200 on 1h timeframe ($80,470); critical short-term support cluster
- $79,137 – Daily Bollinger Band mid-line and approximate EMA20 on daily; loss of this level would shift structure bearish
- $76,373 – Daily EMA50 and major support zone; breakdown below would invalidate the current recovery structure and target deeper retracement
Momentum & On-Chain Signals
RSI readings present a mixed picture: the 1h RSI at 51.28 shows neutral momentum with room for expansion in either direction, while the 4h RSI at 50.74 confirms equilibrium, and the daily RSI at 60.96 suggests moderate bullish momentum without reaching overbought territory. The MACD on the daily timeframe shows a bullish crossover with positive histogram development, though momentum remains relatively weak, while shorter timeframes display compression with the MACD lines converging near the zero line. OBV has been trending higher across all timeframes, indicating sustained accumulation and suggesting institutional participation despite price consolidation. The Funding Rate at 0.0054% remains slightly positive but neutral, reflecting balanced positioning without excessive leverage on either side—a constructive backdrop for organic price discovery.
BTC Dominance & Market Sentiment
Bitcoin dominance stands at 54.64%, maintaining its elevated position and suggesting continued flight-to-quality dynamics within the crypto market. The sustained high dominance indicates that capital remains concentrated in BTC rather than flowing into altcoins, typically a sign of cautious market sentiment where participants favor the relative safety of the flagship asset. USDT dominance data is unavailable (nan%), limiting insight into stablecoin positioning, though the elevated BTC dominance itself suggests risk-off tendencies persist within crypto markets. This dominance profile supports Bitcoin’s relative strength but also implies that broader market risk appetite remains constrained, potentially limiting explosive upside until altcoin participation increases.
Risk Scenarios
Bullish case: A decisive 4-hour close above $82,091 (daily EMA200) accompanied by expanding volume would confirm breakout potential and open the path toward $85,000-$87,000, with RSI supporting further upside momentum. Continuation of positive OBV divergence and funding remaining stable would validate institutional accumulation supporting higher prices.
Bearish case: Failure to reclaim $82,000 followed by a breakdown below $80,400 would trigger stop-loss cascades toward the $79,137 mid-BB support, with further weakness potentially accelerating to retest the $76,373 daily EMA50. A bearish MACD crossover on the 4h chart combined with negative funding would confirm downside momentum.
Outlook
Bitcoin’s technical setup reflects a consolidation at a critical inflection point, with the daily EMA200 at $82,091 representing the line in the sand for bulls. The next 24-48 hours will be decisive, with traders watching for either a confirmed breakout above $82,500 or rejection that triggers retreat toward $79,000-$80,000 support. Momentum indicators suggest the market remains in balance, with OBV accumulation providing underlying support but RSI neutrality indicating no immediate directional conviction. Key triggers include a 4h close above $82,100 for bullish confirmation or a break below $80,400 for bearish acceleration. Given the current structure, a cautious stance favoring the upside is warranted as long as $80,400 holds, but aggressive positioning should await clear breakout confirmation above the daily EMA200 resistance.
Disclaimer: This analysis is for informational purposes only and does not constitute financial advice. Cryptocurrency markets are highly volatile and unpredictable. All trading decisions should be made based on your own research and risk tolerance. Block Digest is not responsible for any financial losses incurred as a result of acting on this content.