BTC Daily Analysis — May 12, 2026
BTC Daily Analysis – May 12, 2026
Market Overview
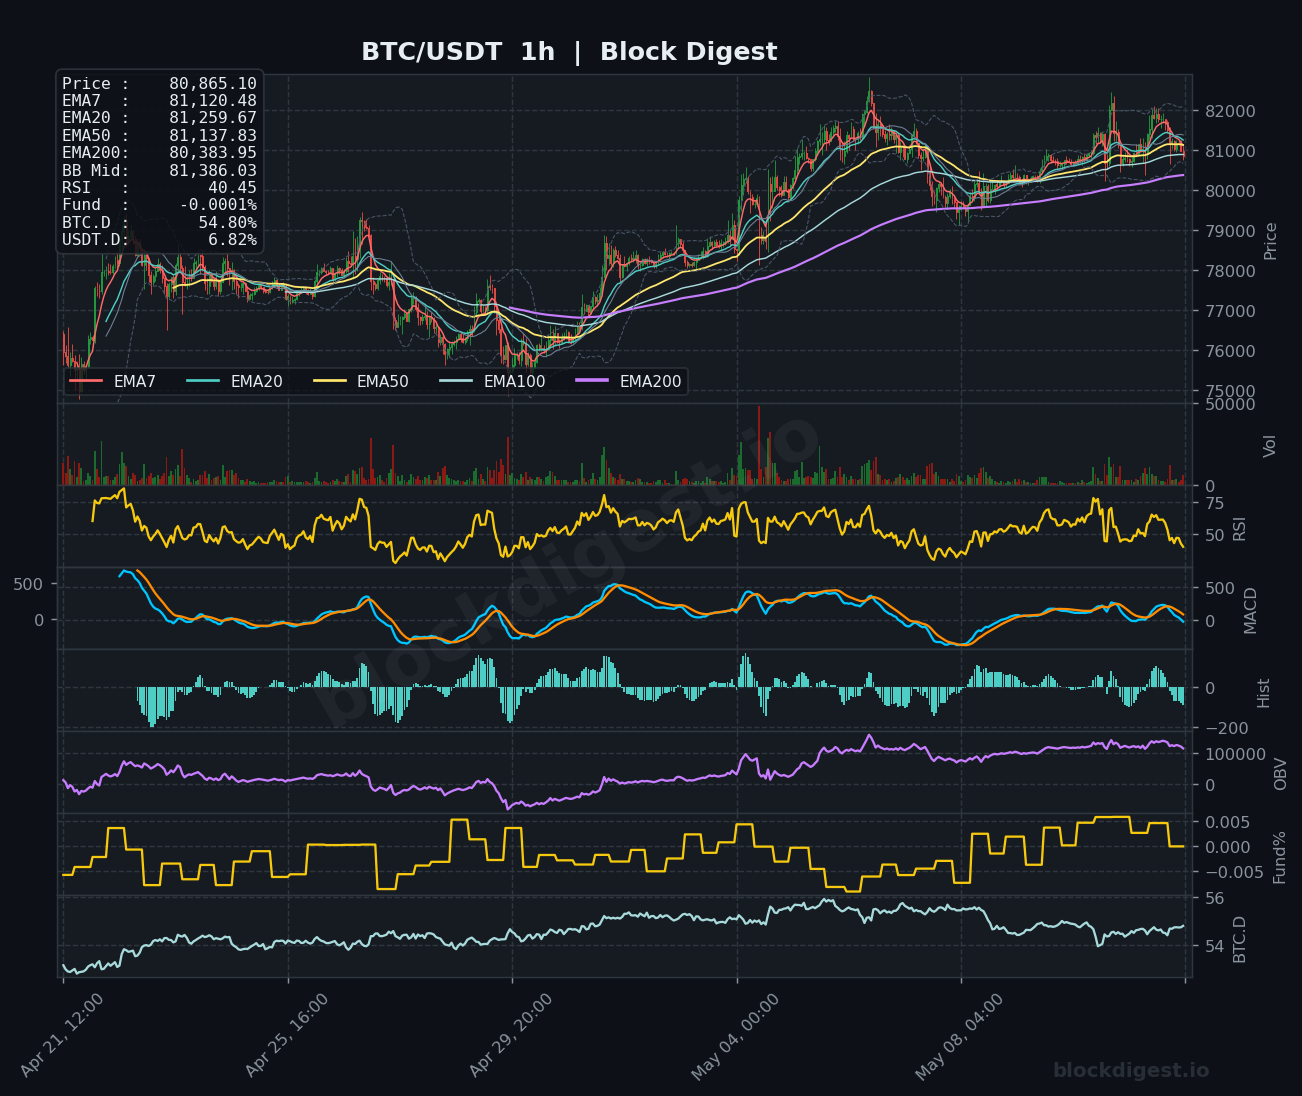
Bitcoin is trading at $80,865 after briefly touching $82,026 overnight, now consolidating just below the psychologically significant $81,000 level. Price action remains compressed between the EMA7 ($81,120) and EMA200 ($80,384) on the 1-hour chart, signaling indecision in the short term. The daily timeframe shows BTC hovering near the EMA7 ($80,834) with price positioned above the rising EMA50 ($76,204), maintaining a cautiously constructive intermediate-term structure despite being well below the overhead EMA200 ($82,114). Bollinger Bands are contracting across all timeframes, suggesting an imminent volatility expansion as the market coils for its next directional move.
Multi-Timeframe Confluence
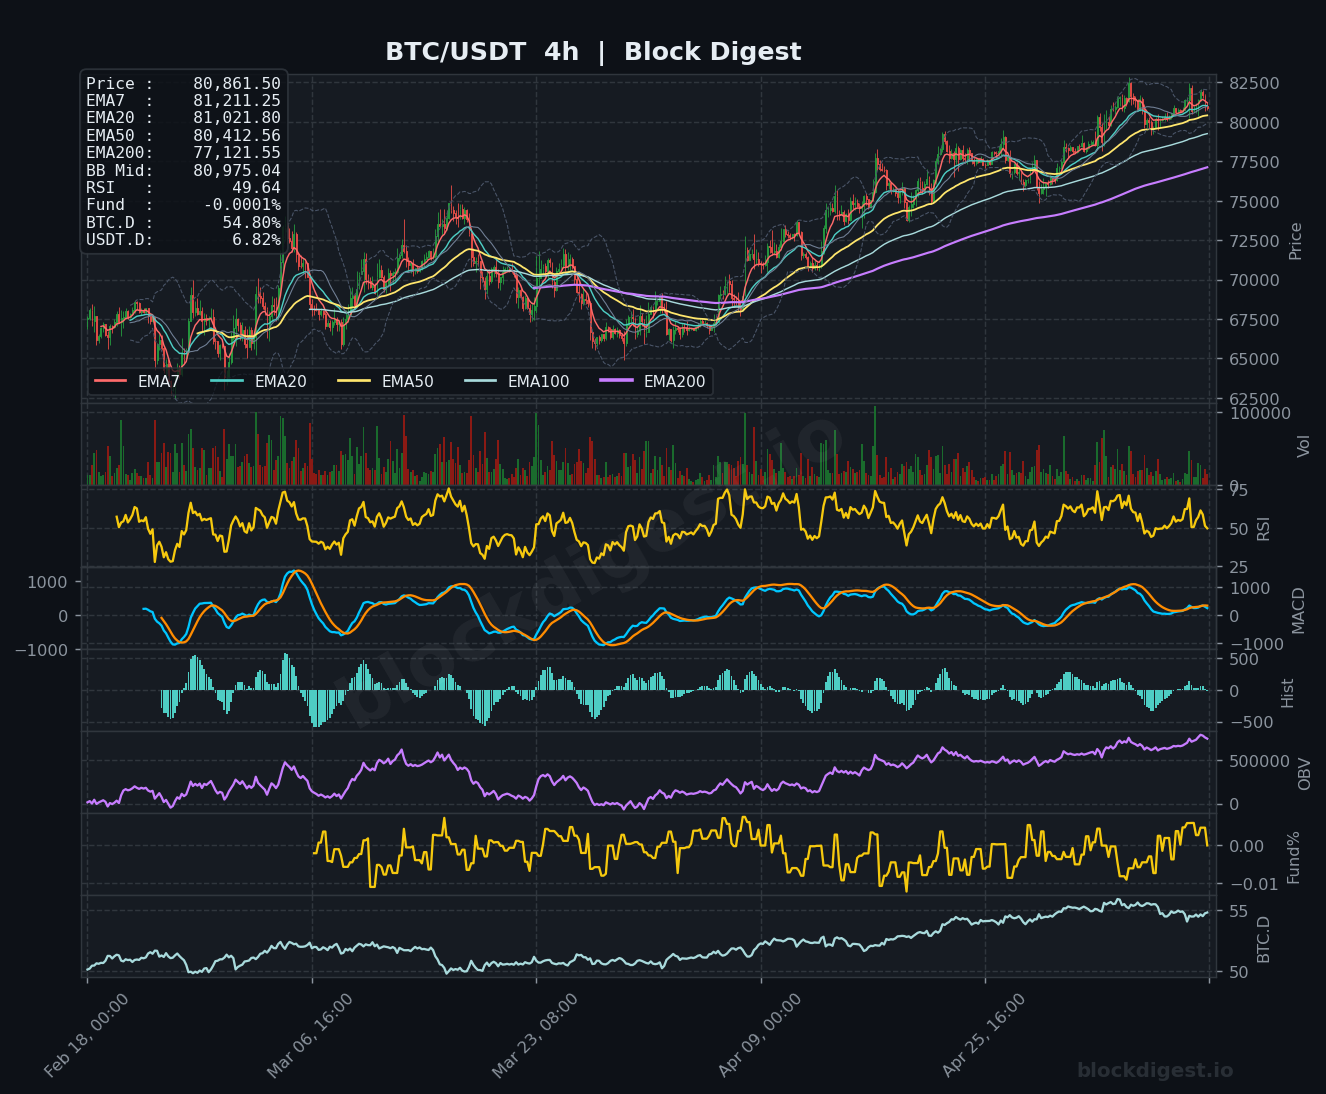
The multi-timeframe picture reveals growing alignment favoring potential upside continuation. On the 1-hour chart, price is testing above key short-term EMAs with the EMA7 beginning to slope upward, while the 4-hour timeframe shows a bullish EMA stack with price holding above the EMA50 ($80,413) and EMA100 ($80,412) confluence zone—a critical support cluster. The daily chart confirms that BTC remains in recovery mode from the significant correction earlier this year, with the EMA50 providing dynamic support and angling higher. The $80,400-$80,800 zone represents confluent support across the 4h and 1d timeframes, while the $82,000-$82,500 region marks immediate resistance where the 4h EMA200 ($77,122) has been left behind, and the daily EMA200 acts as a formidable overhead barrier.
Key Levels to Watch

Resistance:
- $82,026 – Overnight high and immediate psychological resistance; reclaiming this level would signal renewed buying momentum and potentially trigger short covering
- $82,114 – Daily EMA200 and critical macro resistance; a decisive break above this level would represent a significant shift in market structure and validate medium-term bullish continuation
- $83,000-$83,500 – Next major resistance zone representing previous consolidation area and Bollinger Band extension targets on higher timeframes
Support:
- $80,384 – 1h EMA200 and immediate support; loss of this level would indicate short-term weakness and potential for deeper retracement
- $80,412 – 4h EMA50/EMA100 confluence zone providing critical structural support; this level has been defended multiple times and represents the line in the sand for the recent recovery
- $79,022-$79,042 – Daily Bollinger Band midpoint and psychological support; a breakdown here would shift the intermediate-term bias bearish and target the $77,000 region
Momentum & On-Chain Signals
Momentum indicators present a mixed but improving picture. The RSI across all timeframes sits in neutral territory—40.45 (1h), 49.64 (4h), and 61.40 (1d)—suggesting neither overbought nor oversold conditions, with room for expansion in either direction. The 4h and daily RSI readings show gradual upward trajectory, supporting the recovery thesis. MACD on the 4-hour chart shows bullish crossover with histograms transitioning from negative to positive territory, though momentum remains modest. The daily MACD continues to trend near the zero line, indicating consolidation rather than conviction. OBV shows steady accumulation on the daily timeframe, climbing consistently since February lows, which contrasts positively with the relatively muted price action—a bullish divergence suggesting smart money positioning. Funding rates remain neutral to slightly negative (-0.0001%), indicating minimal leverage positioning and reducing the risk of cascading liquidations in either direction.
BTC Dominance & Market Sentiment
Bitcoin dominance stands at 54.80%, maintaining elevated levels that typically characterize periods of flight to quality within the crypto ecosystem. This elevated BTC.D reading suggests that capital remains concentrated in Bitcoin rather than flowing into higher-risk altcoins, reflecting cautious market sentiment despite BTC’s stability above $80,000. USDT dominance at 6.82% has declined from recent peaks, which generally indicates capital deployment back into crypto assets rather than sitting in stablecoins—a constructive sign for risk appetite. The combination of elevated BTC dominance and declining stablecoin dominance suggests that while investors are engaging with the market, they’re prioritizing Bitcoin as the preferred vehicle, which could support BTC’s price action if broader risk sentiment continues to improve.
Risk Scenarios
Bullish case: A sustained break above $82,114 (daily EMA200) accompanied by increasing volume and RSI expansion above 65 would confirm resumption of the broader uptrend, targeting the $83,500-$84,000 zone initially. Follow-through above $84,000 with supportive funding rates turning positive would open the door to $86,000-$88,000, representing key Fibonacci retracement levels from the prior macro swing.
Bearish case: Failure to reclaim $82,000 followed by a breakdown below the $80,400 support confluence would signal short-term distribution and target $79,000 initially. A decisive close below $79,000 with deteriorating OBV and negative MACD crossover on the daily would invalidate the recovery structure and expose the $76,200-$77,000 zone where the daily EMA50 currently resides.
Outlook
Bitcoin remains at a critical inflection point, consolidating within a tight $80,400-$82,100 range after testing overhead resistance overnight. The technical setup favors a bullish resolution given the supportive EMA structure on higher timeframes, persistent OBV accumulation, and contracting Bollinger Bands typically preceding upside breakouts. However, the lack of conviction in momentum indicators and neutral funding rates suggest that a catalyst is needed to drive directional commitment. Watch for a decisive 4-hour close above $82,114 with expanding volume as the trigger for upside continuation toward $83,500+. Conversely, failure to hold $80,400 on a 4-hour closing basis would warrant defensive positioning with $79,000 as the next key support. The next 24-48 hours are critical; a Bollinger Band expansion coupled with RSI breakout above 65 on the 4h chart would provide the technical confirmation bulls are seeking for sustained upside momentum.
Disclaimer: This analysis is for informational purposes only and does not constitute financial advice. Cryptocurrency markets are highly volatile and unpredictable. All trading decisions should be made based on your own research and risk tolerance. Block Digest is not responsible for any financial losses incurred as a result of acting on this content.