Bitcoin Weekly Analysis: BTC consolidating at $78,781 after macro recovery
Weekly Market Overview
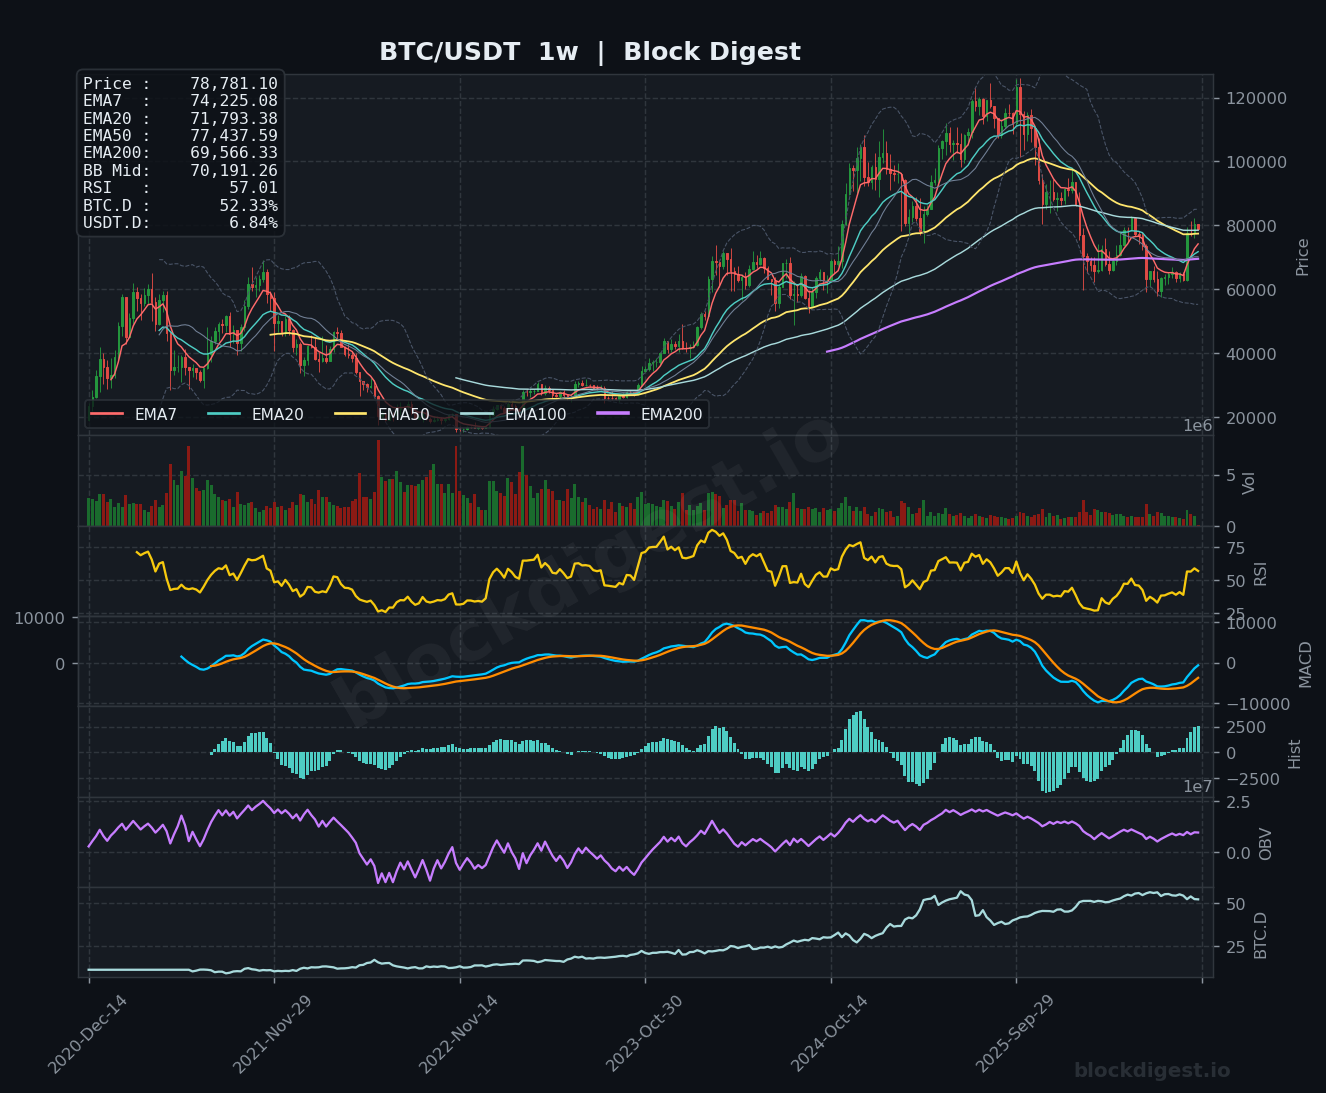
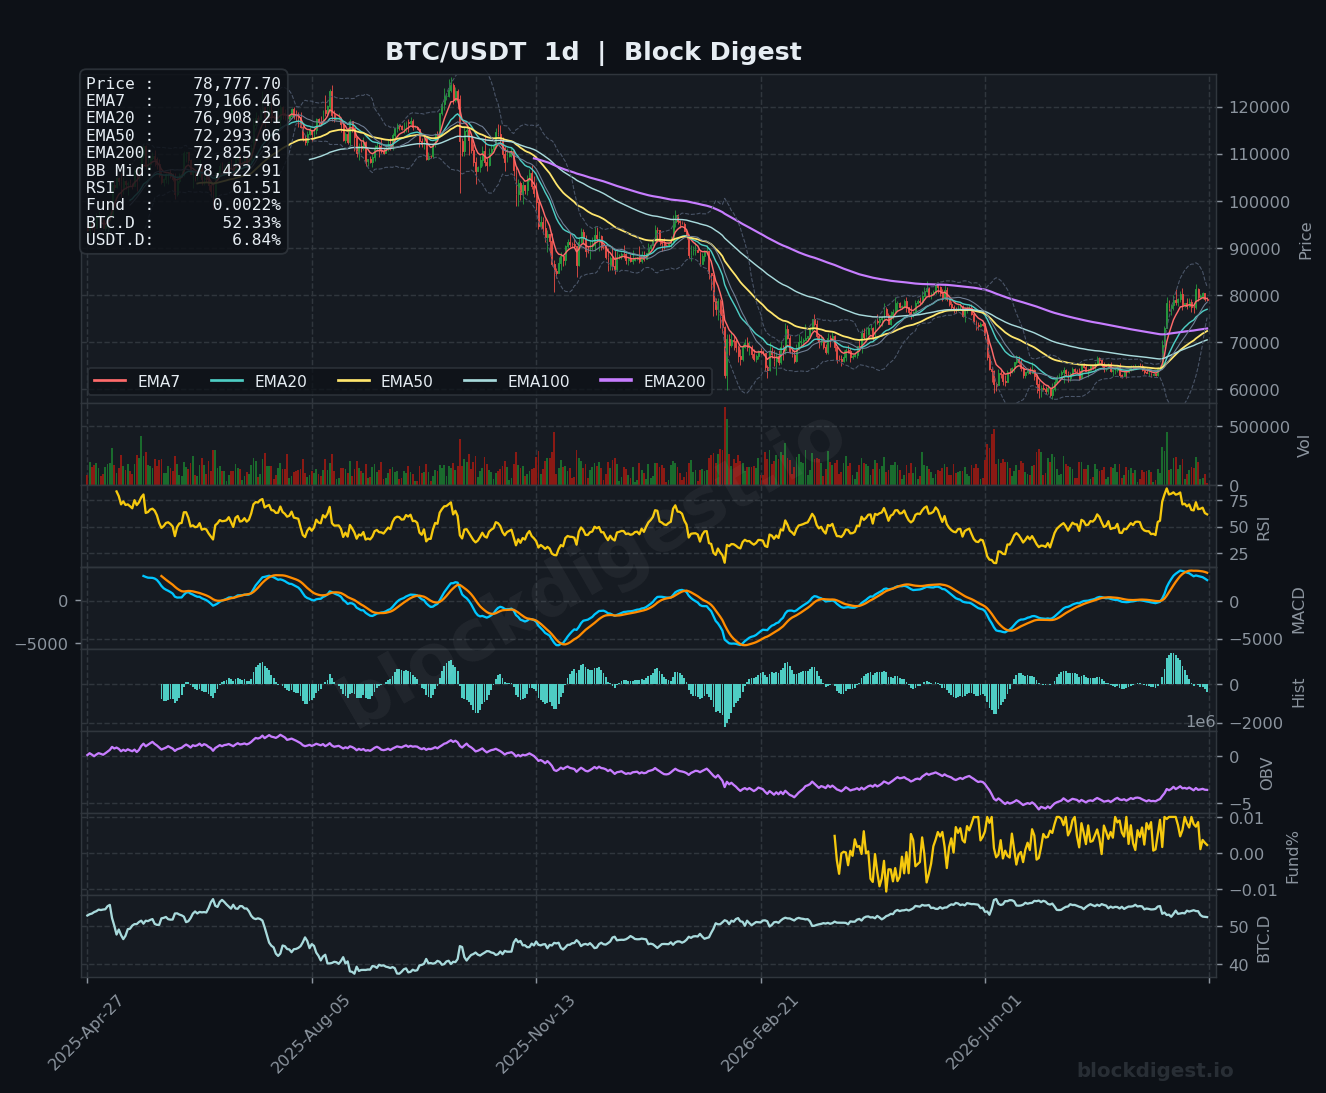
BTC/USDT is currently consolidating at $78,781.10, resting near the apex of an aggressive macro recovery following a long base accumulation between $60,000 and $70,000. The current weekly candle shows high-level compression just above critical moving average clusters, reflecting a period of digestion after the asset tested recent highs near $81,700. Structural context remains firmly bullish; price has successfully reclaimed the multi-month range high and is actively attempting to convert the 100-week EMA into a sustained dynamic support level.
Higher Timeframe Structure
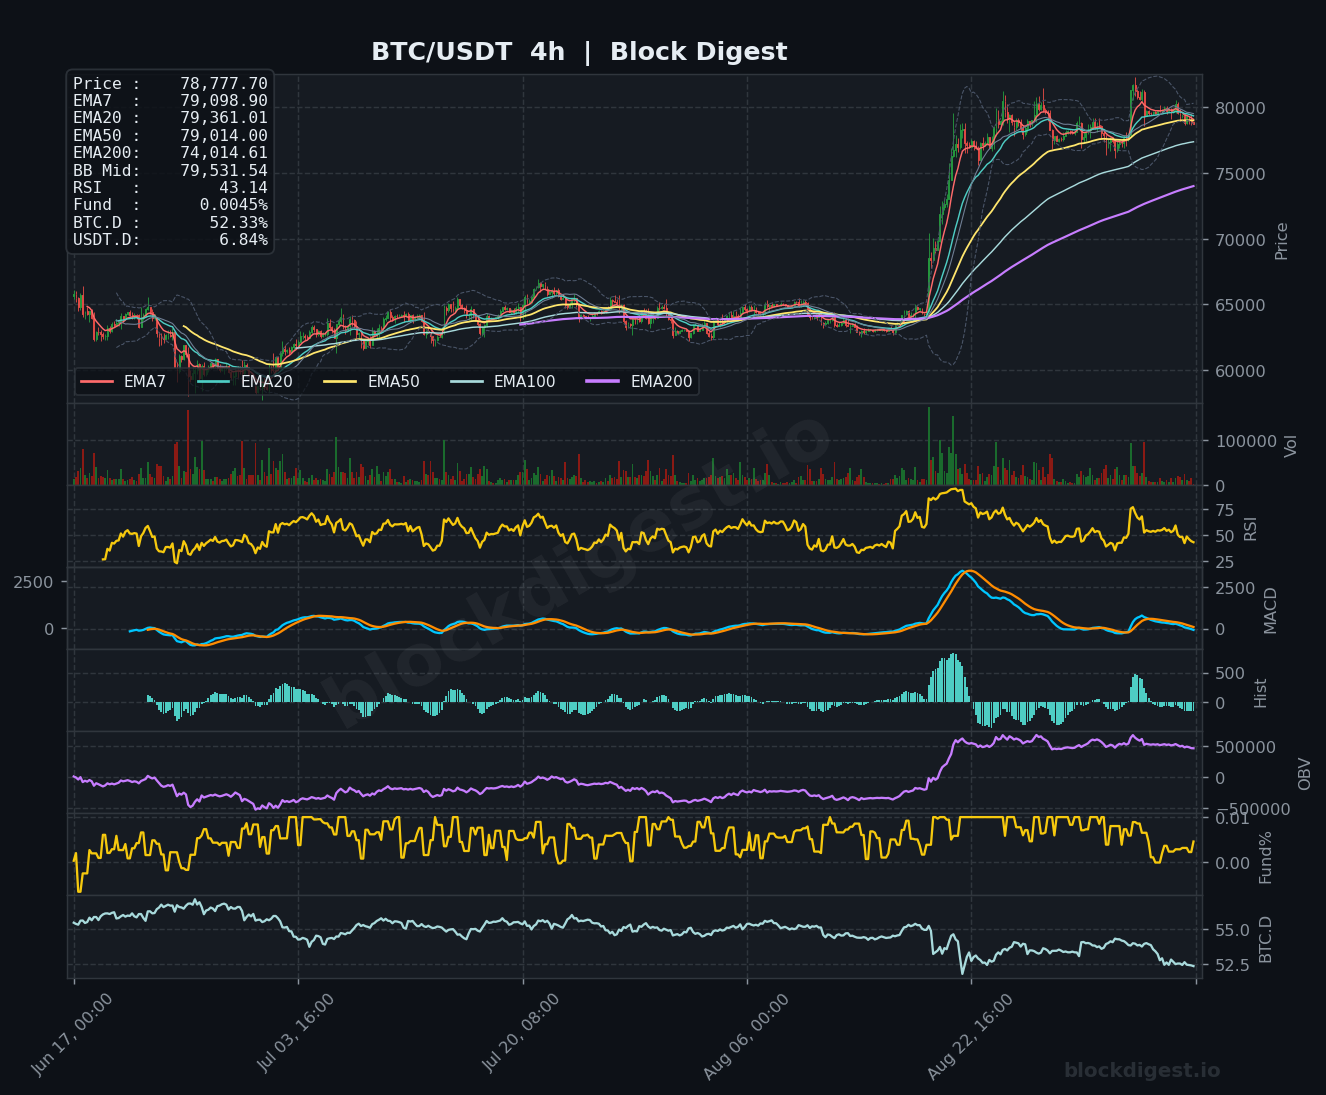
The weekly EMA alignment confirms a robust structural trend repair, with the 7-week EMA crossing above the 20-week EMA. Price sits directly above both the 50-week EMA at $77,437.59 and the 100-week EMA at $78,505.74, signaling the asset is holding well above its historical mid-cycle baseline. Bollinger Band expansion is evident, with the price pushing within the upper band toward the $85,057.72 target, reinforcing an expansionary posture supported by the 200-week EMA at $69,566.33.
Multi-Timeframe Confluence
Market alignment shows the weekly chart in a strong expansion phase, while daily and 4-hour charts are digesting recent vertical gains. A key confluence zone has formed between $76,900 and $77,450, where the daily 20 EMA, weekly 50 EMA, and 4-hour 100 EMA intersect to provide immediate support. This short-term sideways movement is consistent with a healthy consolidation phase that keeps the dominant bullish thesis intact.
Key Weekly Levels
- Weekly Resistance: $80,320.10 serves as the immediate local range ceiling; $81,714.48 marks the recent impulse rejection high; $85,057.72 is the primary macro breakout target.
- Weekly Support: $77,437.59 acts as a confluent shelf; $76,908.21 provides a dynamic trend-continuation baseline; $72,825.31 remains the structural macro pivot floor.
Momentum & Volume Analysis
Momentum indicators present a mixed but fundamentally bullish picture. The Weekly RSI(14) at 57.0146 indicates expansion, while the Daily RSI(14) at 61.5130 shows the market cooling from overbought territory. The Weekly MACD histogram is strongly accelerating at +2,540.3129, confirming underlying strength despite the slight deceleration in shorter-term indicators. Institutional accumulation remains evident through positive Weekly OBV readings, and the Long/Short Account Ratio of 1.19 suggests balanced speculative interest without the danger of excessive long-side leverage.
Key Indicators Snapshot
| Indicator | Value | Context |
|---|---|---|
| BTC/USDT Spot Price | $78,777.70 | consolidating near highs |
| Weekly 200 EMA | $69,566.33 | macro baseline support |
| Weekly 100 EMA | $78,505.74 | critical dynamic support |
| Weekly 50 EMA | $77,437.59 | confluent support level |
| Weekly 20 EMA | $71,793.38 | trend repair baseline |
| Weekly 7 EMA | $74,225.08 | short-term trend support |
| Weekly RSI(14) | 57.0146 | bullish expansion zone |
| Daily RSI(14) | 61.5130 | cooling bullish regime |
BTC Dominance & Altcoin Implications
BTC dominance is consolidating within the 52.3%–52.5% band, maintaining macro market leadership while allowing capital to rotate into select major assets. With USDT dominance holding at 6.8436%, market participants are rotating profits into high-beta setups rather than fleeing to stablecoins, keeping core capital anchored in BTC while the broader market remains active.
Risk Scenarios
- Bull case: Upside continuation requires a defense of the $76,908–$77,438 support zone followed by a 4-hour close above $80,320. A sustained daily breakout above $81,714.48 would likely trigger a move toward the $85,057.72 Weekly Upper Bollinger Band and potential extensions into the $88,000–$90,000 range.
- Bear case: A breakdown would be signaled by the loss of the Daily 20 EMA at $76,908.21, which would likely trigger long liquidations below the Weekly 50 EMA. A clean break below the Weekly 7 EMA at $74,225.08 and the Daily 200 EMA at $72,825.31 would open the path toward lower targets at $71,793.38 and $70,191.26.
Weekly Outlook
The directional bias for the week of September 08, 2026, is moderately bullish, favoring consolidation with potential for upward resolution. Traders should monitor the weekly candle close relative to the 100-week EMA at $78,505.74 to validate the strength of the current structural reclaim. Immediate attention belongs on the pivot support at $77,437.59 and the breakout trigger at $80,320.10. The BD Pulse Score of 64/100 indicates solid trend health, while the BD Extreme Index reading of +1.01σ suggests that the current sideways digestion is a necessary structural step before the next potential leg higher.
Disclaimer: This analysis is for informational purposes only and does not constitute financial advice. Cryptocurrency markets are highly volatile and unpredictable. All trading decisions should be made based on your own research and risk tolerance. Block Digest is not responsible for any financial losses incurred as a result of acting on this content.