BTC Daily Analysis — May 06, 2026
BTC Daily Analysis – May 06, 2026
Market Overview
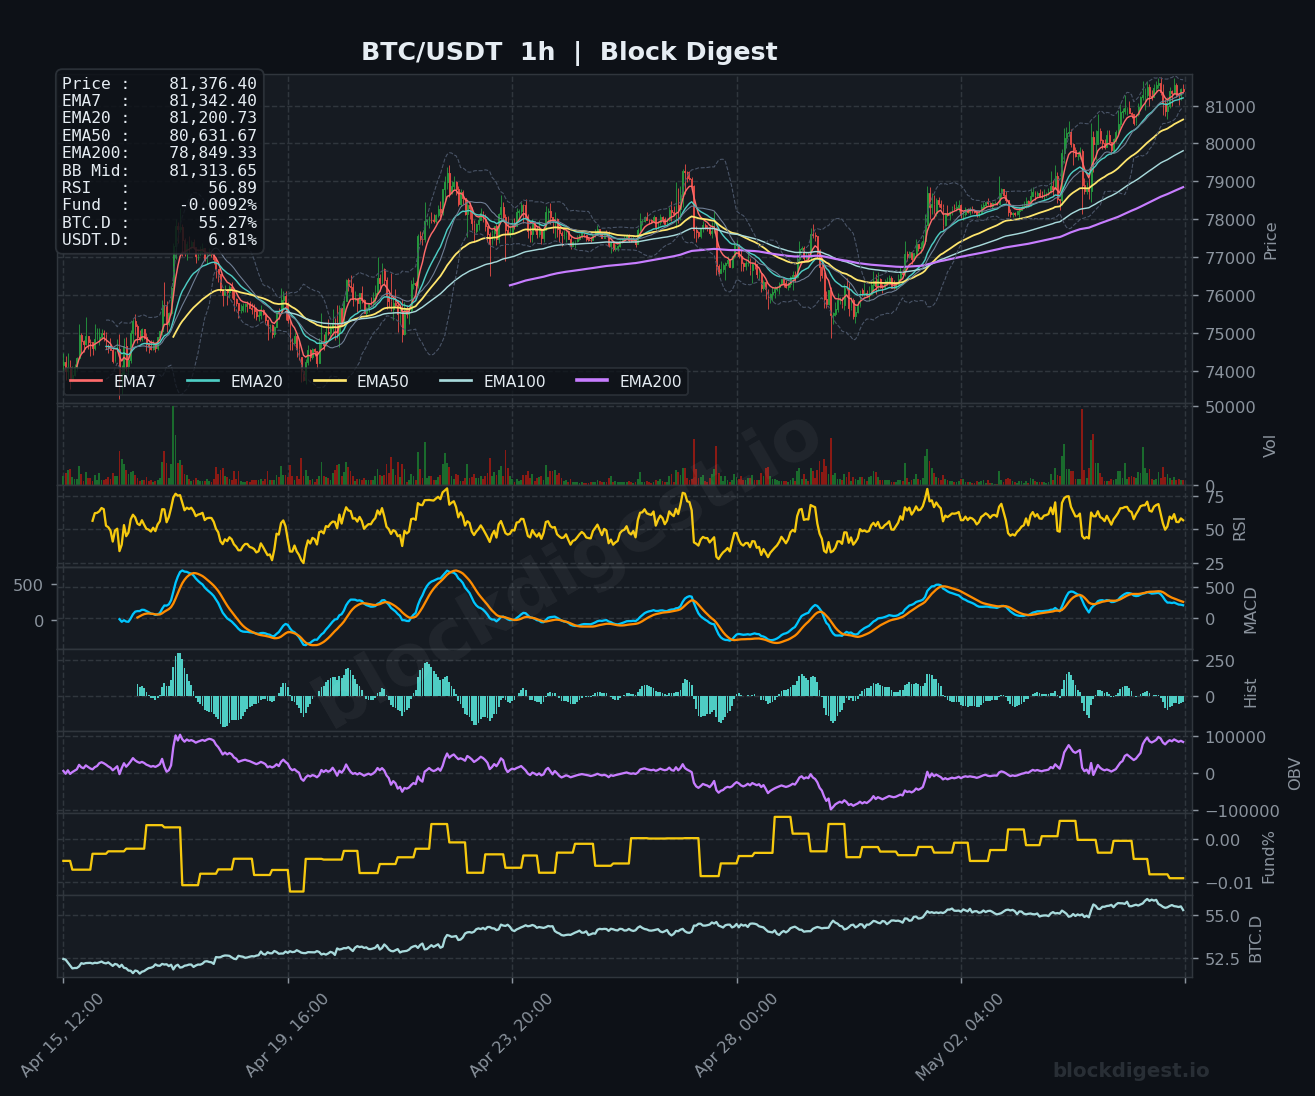
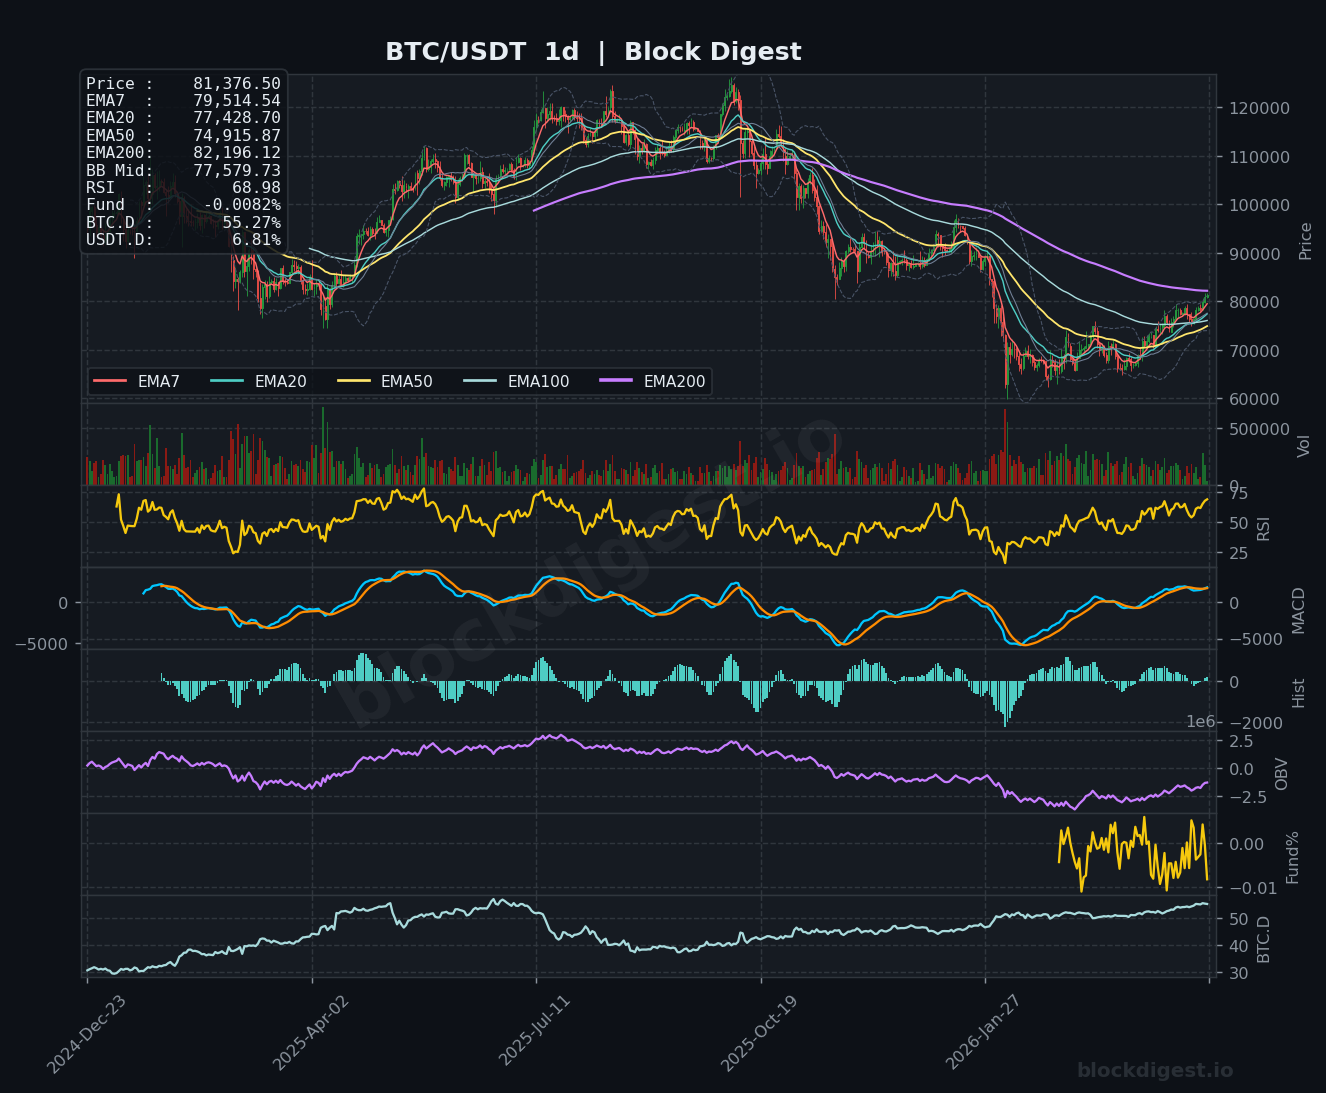
Bitcoin is currently trading at $81,376, positioned above all major EMAs on the 1-hour and 4-hour timeframes, signaling strong short-term bullish momentum. Price is trading near the upper Bollinger Band on the 1h chart at $81,313, indicating recent aggressive buying pressure but potential near-term overextension. On the daily timeframe, BTC remains below the EMA200 at $82,196, which continues to act as a critical resistance barrier, though price has reclaimed the EMA50 at $74,915 and is attempting to establish a new higher structure after the prolonged downtrend from early 2025 highs.
Multi-Timeframe Confluence
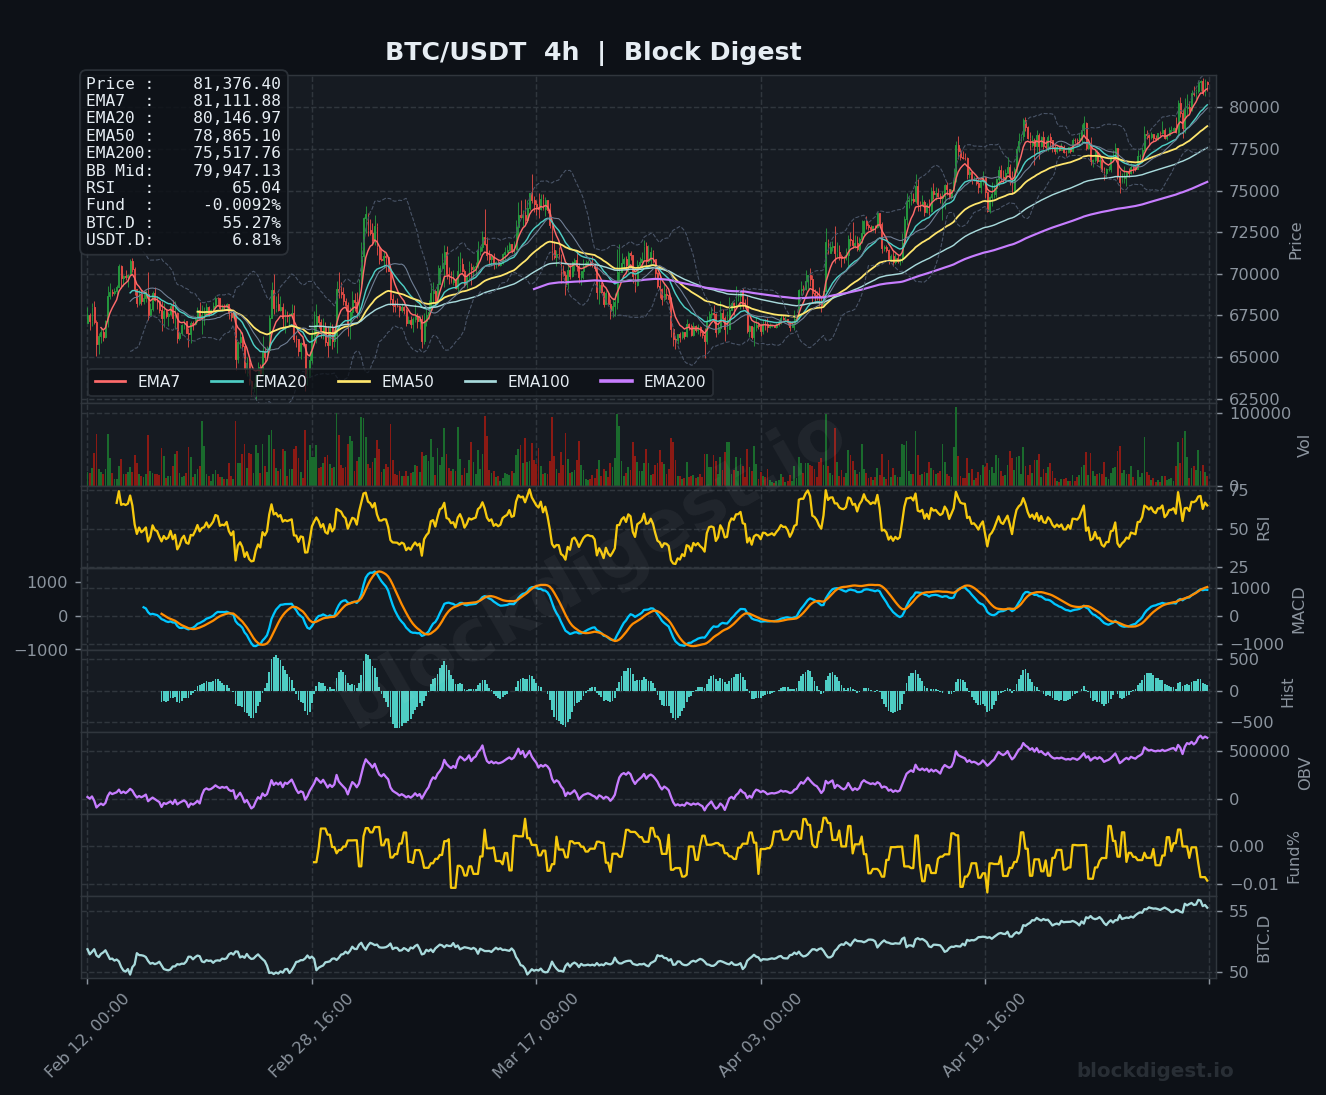
The technical picture shows constructive alignment across lower timeframes with both 1h and 4h charts displaying bullish EMA sequences (price > EMA7 > EMA20 > EMA50), supporting continued upward momentum in the near term. The key confluence zone between $78,865-$80,146 (4h EMA50 and EMA20) represents solid support if price pulls back from current levels. However, the daily timeframe presents a contrasting picture with price still trading below the EMA200 and struggling to establish itself above the EMA100 at $74,915, creating a divergence between short-term strength and longer-term resistance. This multi-timeframe misalignment suggests the rally remains tentative until daily resistance levels are decisively cleared.
Key Levels to Watch
Resistance:
- $82,196 – Daily EMA200, the most significant overhead resistance representing the bear/bull dividing line on higher timeframes
- $81,313 – Current 1h Bollinger Band upper limit, immediate resistance zone where price is testing
- $83,000-$84,000 – Psychological round number resistance and previous consolidation zone from early April visible on the daily chart
Support:
- $80,146 – 4h EMA20, first critical support level that would need to hold to maintain near-term bullish structure
- $78,865 – 4h EMA50, a more substantial support zone representing the base of the recent rally
- $77,428-$77,579 – Daily EMA20 and 1d Bollinger Band middle, critical support that if broken would signal deeper retracement toward $74,915
Momentum & On-Chain Signals
RSI readings across timeframes show mixed momentum characteristics: the 1h RSI at 56.89 is neutral-to-bullish with room for upside before overbought conditions, the 4h RSI at 65.04 is approaching overbought territory but not extreme, while the daily RSI at 68.98 suggests momentum is extended and vulnerable to pullback. The MACD on both 1h and 4h timeframes shows bullish crossovers with expanding positive histograms, confirming the short-term uptrend, though the daily MACD remains barely positive, indicating fragile longer-term momentum. OBV across all timeframes shows gradual accumulation with the recent price advance supported by volume, particularly visible on the 4h and daily charts where OBV has broken above previous resistance. The Funding Rate at -0.0092% (negative) suggests shorts are paying longs, which is contrarian bullish and aligns with the price strength, though the magnitude is modest.
BTC Dominance & Market Sentiment
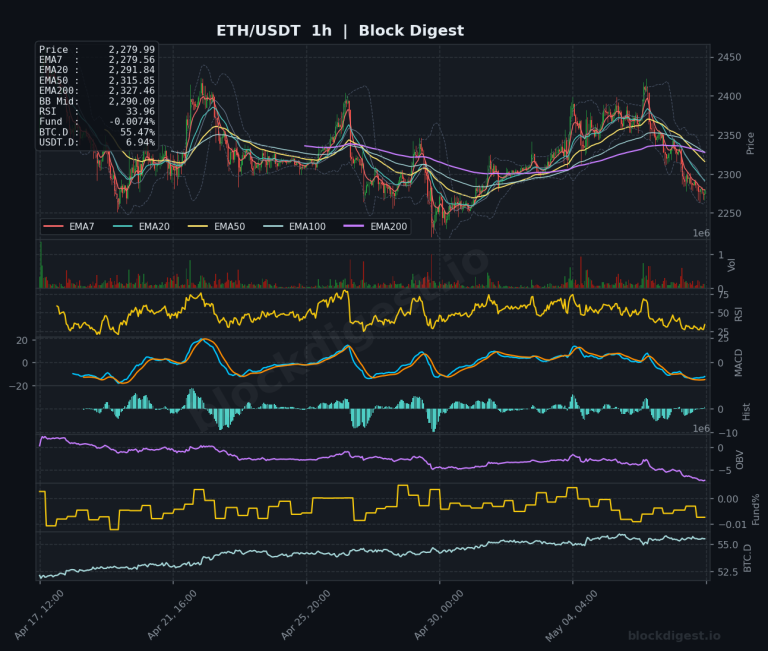
BTC.D at 55.27% shows Bitcoin maintaining majority market share, reflecting sustained preference for BTC over altcoins and suggesting risk-off sentiment within the crypto ecosystem. USDT.D at 6.81% remains relatively low, indicating capital is deployed in crypto assets rather than sitting in stablecoins, which generally supports continued market participation. The combination of elevated BTC dominance with moderate USDT dominance suggests investors favor Bitcoin’s relative safety over speculative altcoin exposure, a typical pattern during uncertain or consolidating market phases where BTC leads any recovery attempts.
Risk Scenarios
Bullish case: A decisive 4-hour close above $82,196 (daily EMA200) with sustained volume would confirm breakout potential and open the path toward $84,000-$85,000, especially if accompanied by RSI maintaining above 60 on the daily chart without forming bearish divergence. Follow-through above $83,000 with the daily EMA50 crossing above EMA100 would validate a structural trend change and target the $87,000-$90,000 zone from early 2025.
Bearish case: Rejection at current levels with a breakdown below $78,865 (4h EMA50) would invalidate the near-term bullish structure and likely trigger cascade selling toward $74,915 (daily EMA50), particularly if accompanied by the 4h MACD rolling over into bearish territory. A daily close below $77,428 would confirm renewed downtrend pressure and expose the $72,000-$68,000 support zone mentioned in recent market commentary regarding Q1 lows.
Outlook
Bitcoin’s technical setup presents a critical inflection point with short-term momentum clearly bullish but facing formidable resistance at the daily EMA200 around $82,196. The next 24-48 hours will likely determine whether this represents a genuine breakout attempt or another failed rally within the broader consolidation range. Key triggers include BTC’s ability to secure a daily close above $82,200 with volume confirmation, or conversely, rejection candles with increased selling pressure. The $78,865-$80,146 support zone is critical—maintaining above this range keeps the bullish narrative intact, while breakdown would shift probabilities toward retesting lower support. Given the extended daily RSI and proximity to significant resistance, traders should watch for either breakout confirmation with momentum follow-through or signs of exhaustion such as bearish divergence or volume decline at these elevated levels.
Disclaimer: This analysis is for informational purposes only and does not constitute financial advice. Cryptocurrency markets are highly volatile and unpredictable. All trading decisions should be made based on your own research and risk tolerance. Block Digest is not responsible for any financial losses incurred as a result of acting on this content.