Market Context
The altcoin market is navigating a cautious environment as BTC dominance holds near 54.97% — a level that historically constrains meaningful altcoin outperformance and suggests capital remains selectively rotated rather than broadly distributed. USDT dominance at 7.97% indicates a moderate stablecoin reserve on the sidelines, offering a potential catalyst if sentiment shifts, though the Fear & Greed Index registering in fear territory tempers expectations for an imminent rush into risk assets. Our BD Pulse Score of 65/100 (Bullish) presents a notable counterpoint to the broader fear reading, suggesting underlying on-chain conditions may be quietly building a constructive floor even as surface-level sentiment remains cautious.
Solana (SOL)
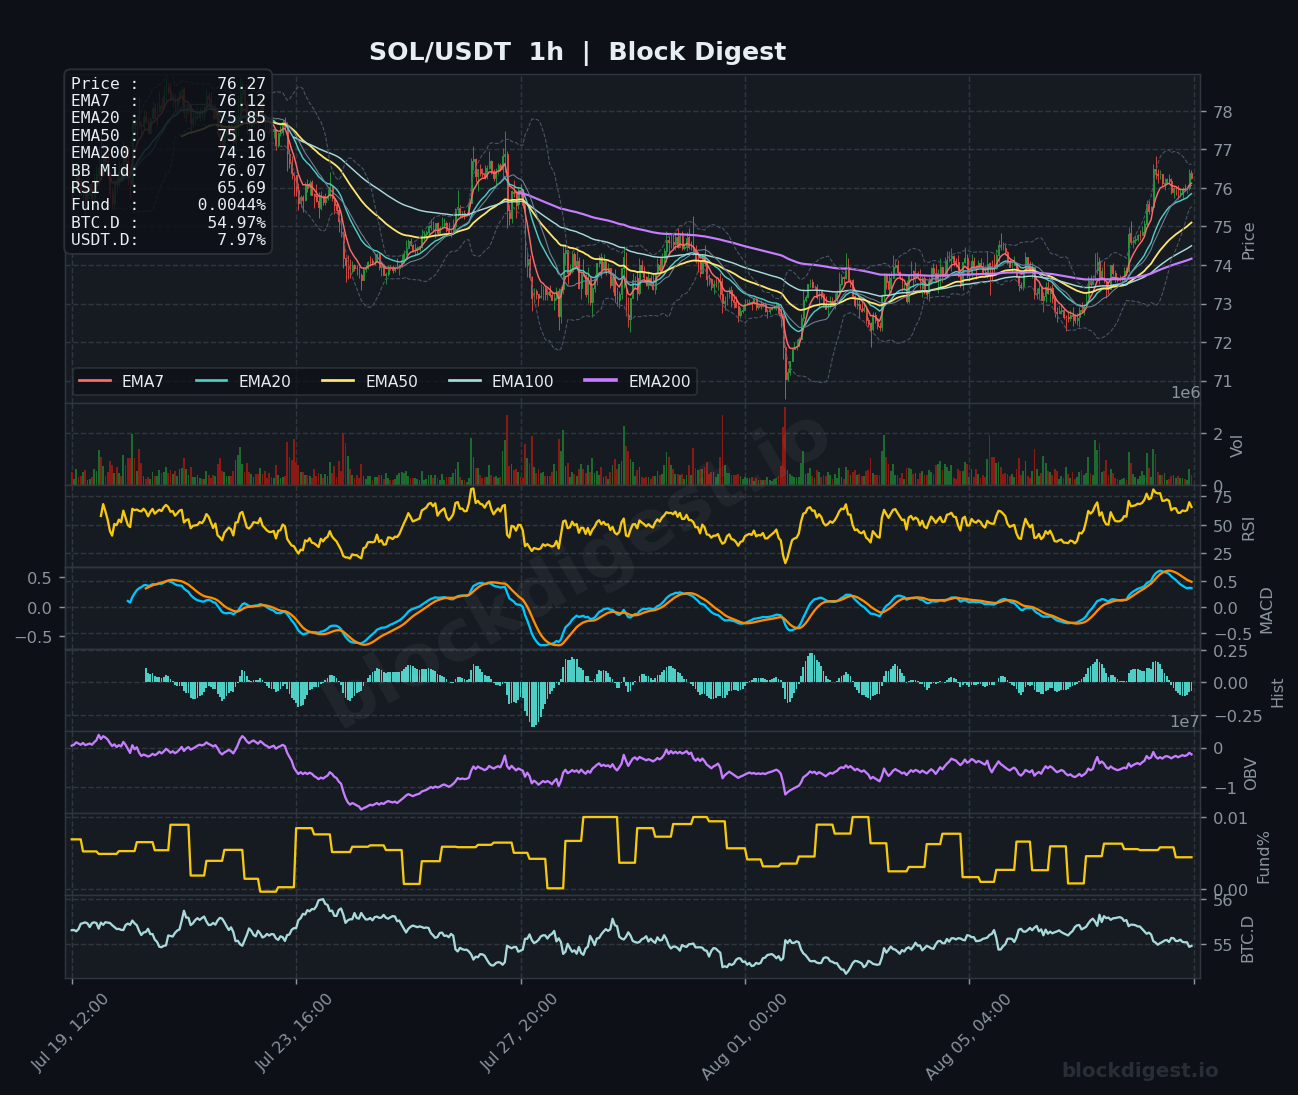
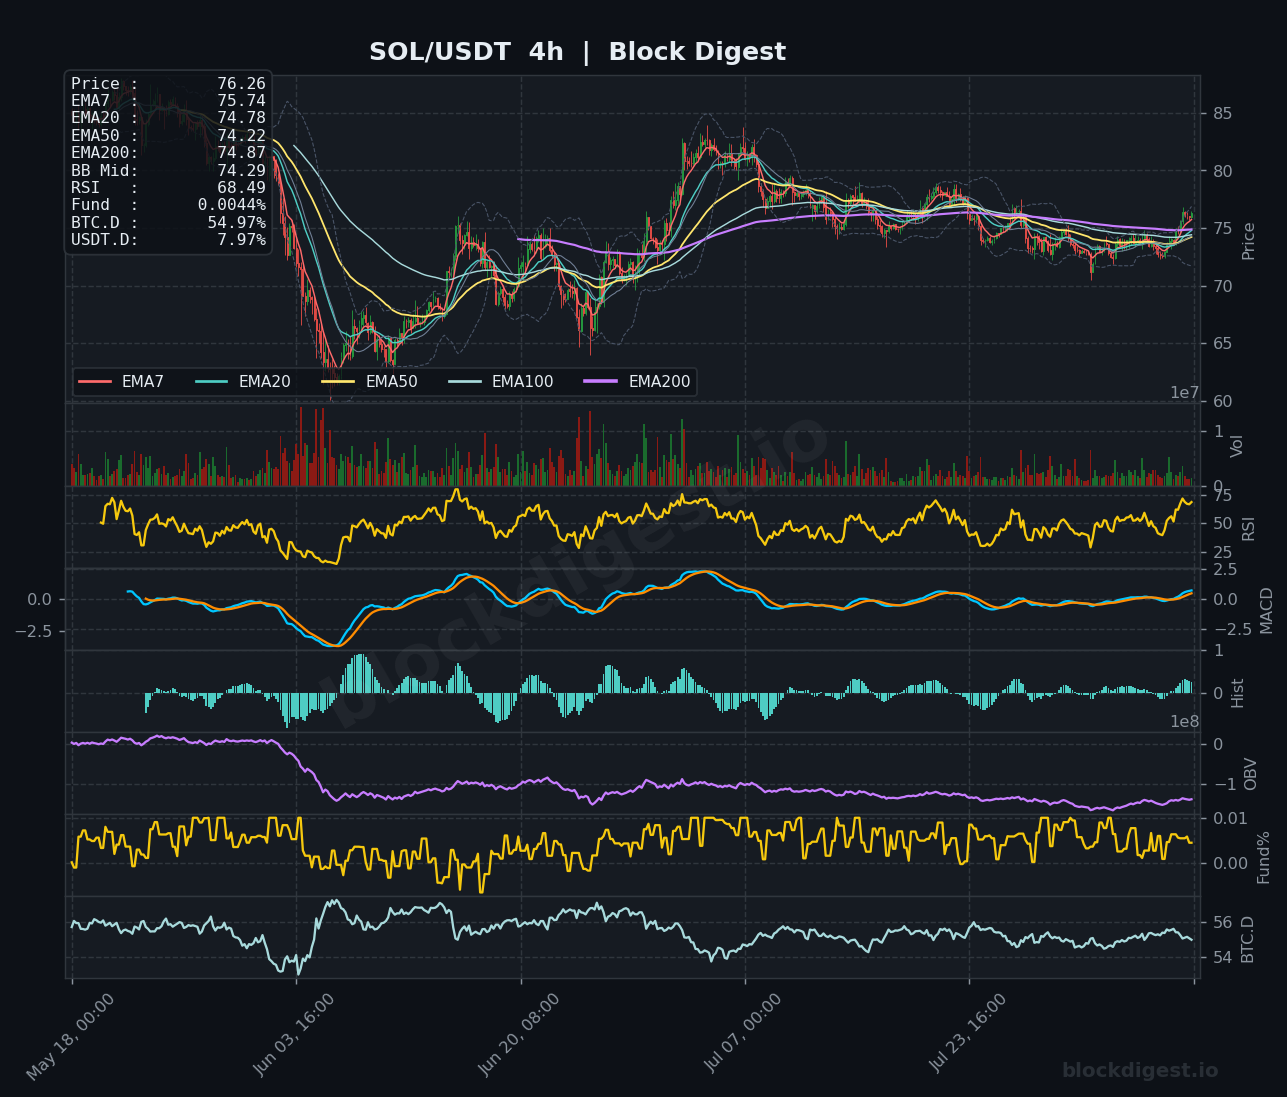
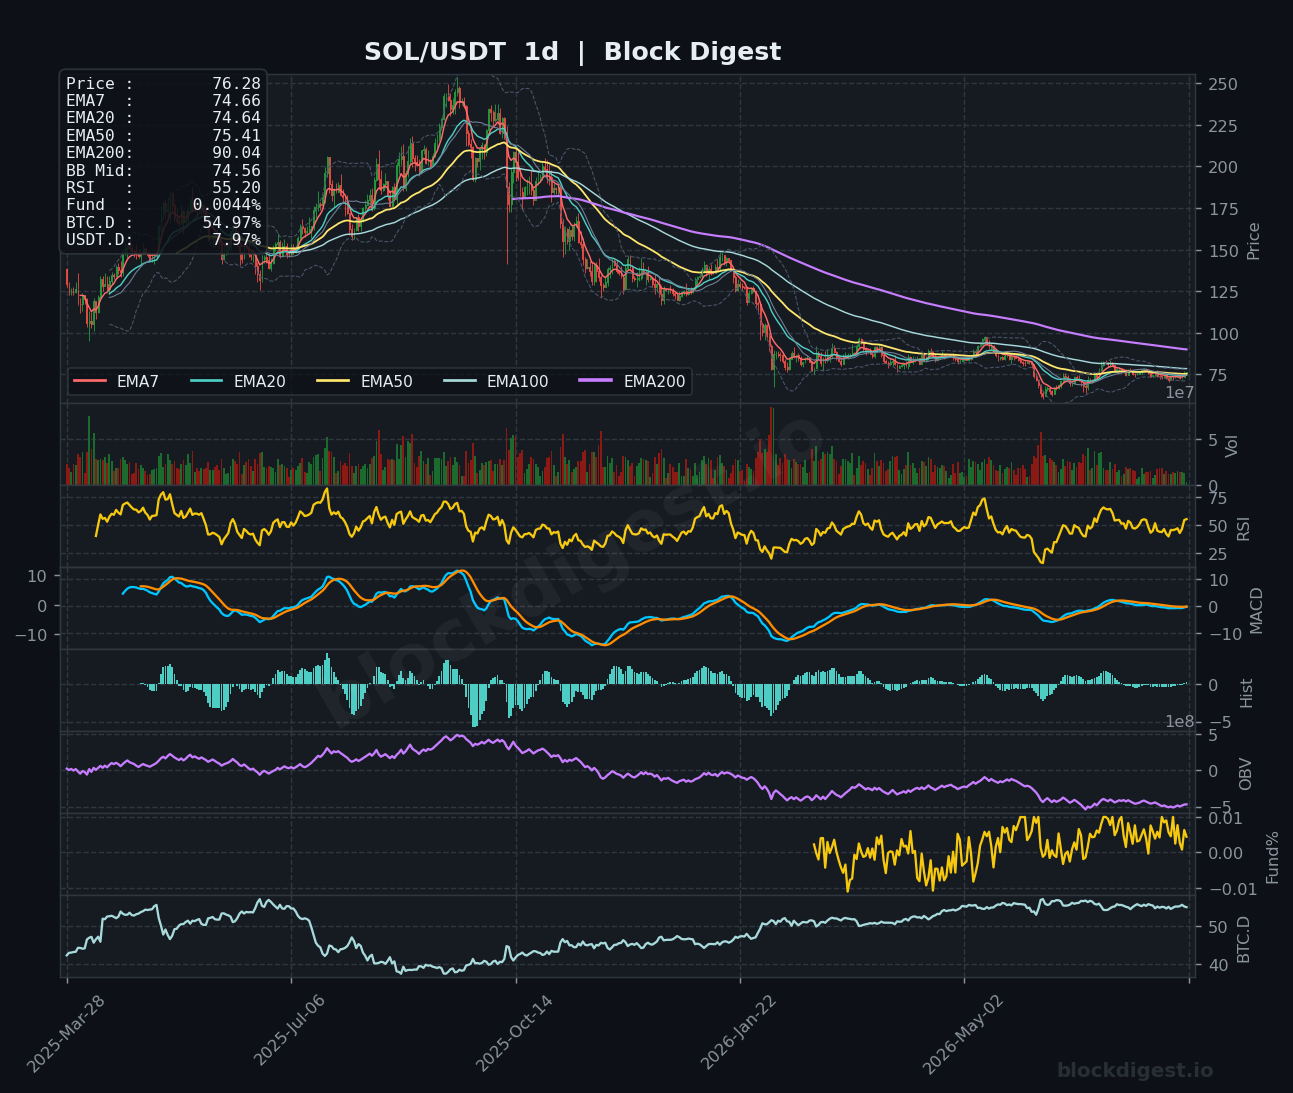
SOL is trading around $76.27, with the 1h chart showing a clean bullish EMA stack — price sitting above EMA7 ($76.12), EMA20 ($75.85), EMA50 ($75.10), and EMA200 ($74.16) — a configuration that reflects genuine short-term momentum recovery from the $72 lows seen earlier in the window. The 4h RSI is elevated at 68.49, approaching overbought territory, while the MACD line is in a gentle bullish crossover, though histogram bars are beginning to flatten, hinting at decelerating momentum. On the daily chart, RSI at 55.20 sits in neutral-bullish territory and price is testing the EMA50 ($75.41) from below — clearing and holding this level on a daily close would be the key confirmation bulls need. The BD Extreme Index reading of +1.00σ (Overbought) warrants caution on fresh long entries near current levels; $74.00–$74.50 remains the immediate support zone to watch on any pullback.
XRP (XRP)
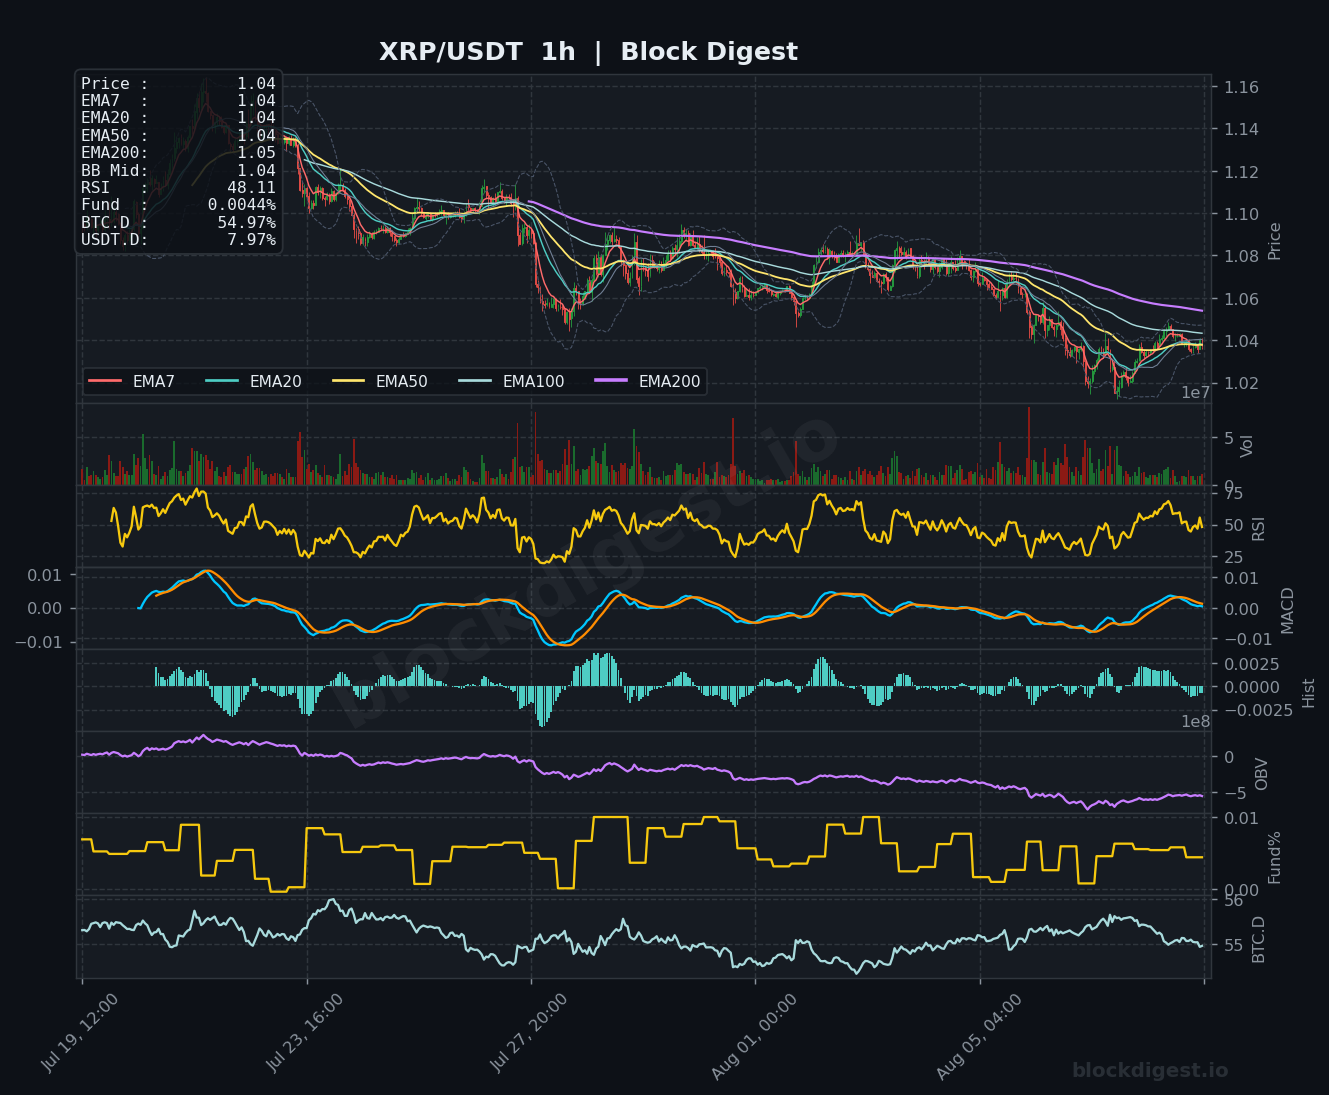
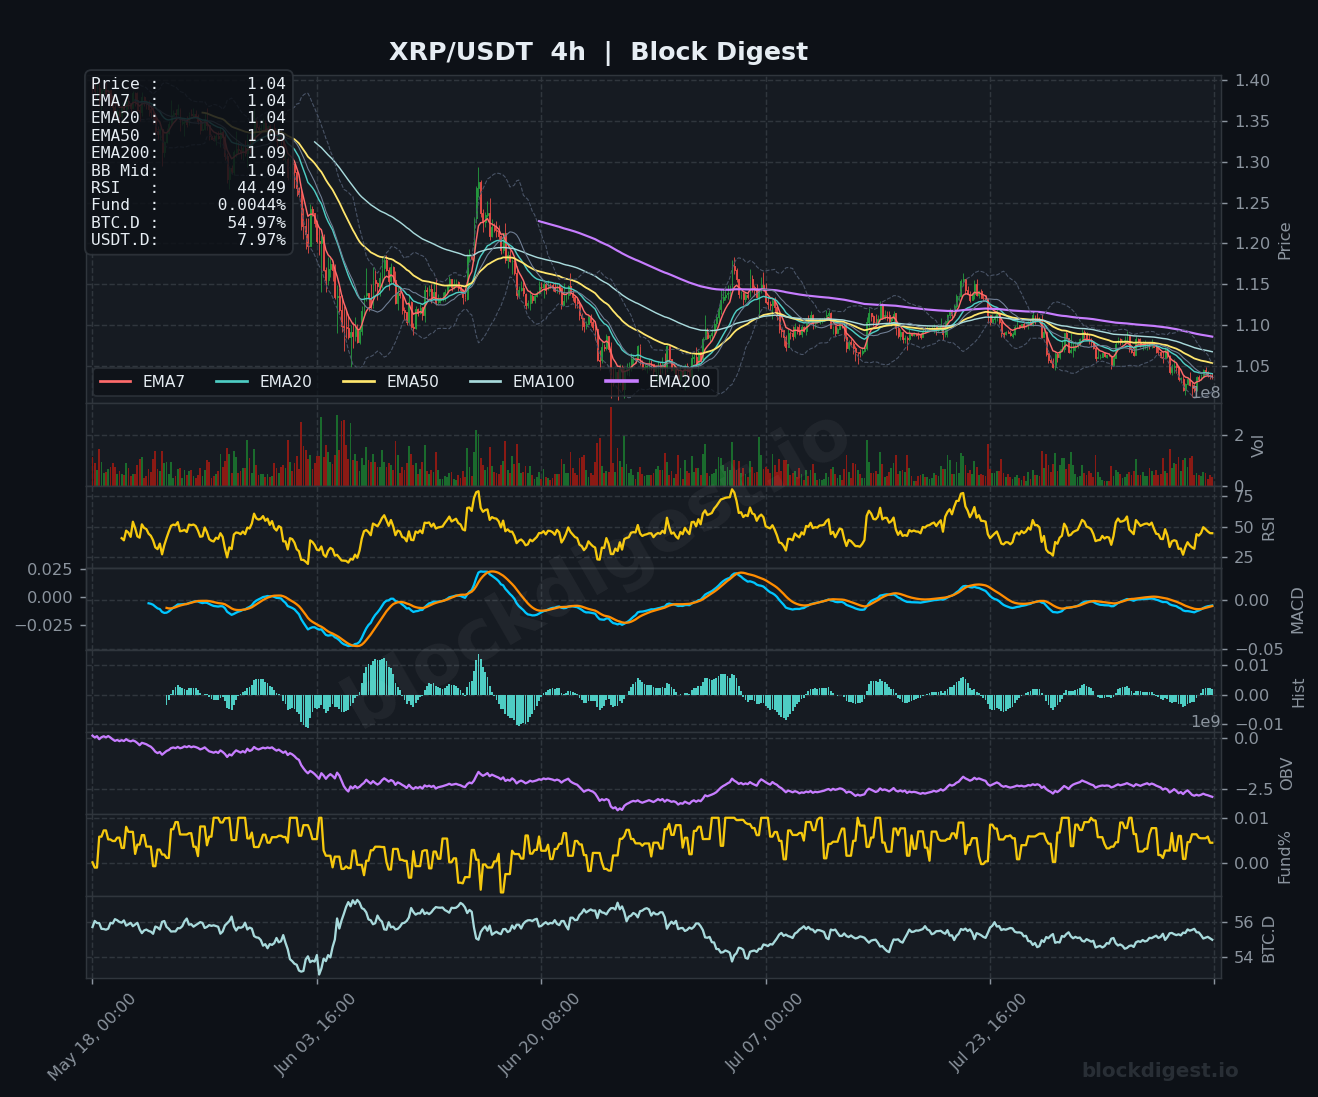
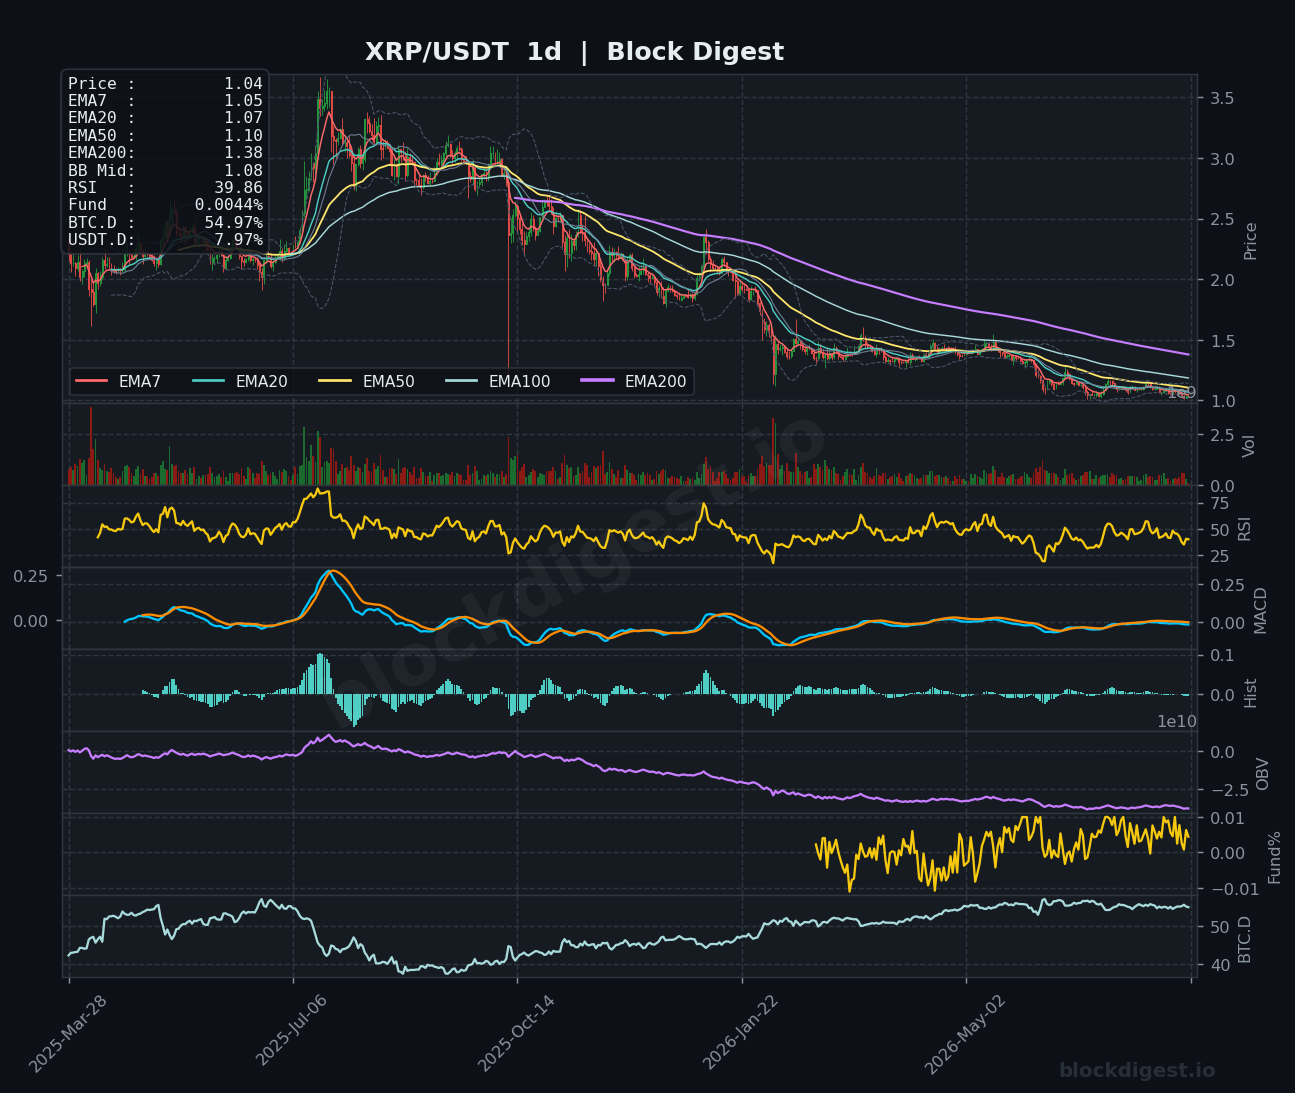
XRP is languishing at $1.04, and the technical picture across all three timeframes remains decisively weak, with price pinned below every major EMA on both the 4h and daily charts — the daily EMA50 sits at $1.10, EMA100 at roughly $1.16, and the EMA200 at $1.38, forming a cascading resistance structure that has capped every recovery attempt. The 1h RSI at 48.11 and the 4h RSI at 44.49 both reflect mild bearish pressure without yet entering oversold territory, suggesting there is limited immediate reversal catalyst. The daily OBV continues to trend lower in a sustained downward channel, confirming that sell-side volume has dominated distribution — a structural concern that persists regardless of near-term bounces. The Senate’s delay of the CLARITY Act vote to September removes a near-term regulatory tailwind, and XRP needs a convincing reclaim of $1.08–$1.10 to shift the short-term bias from neutral-bearish to constructive.
BNB (BNB)
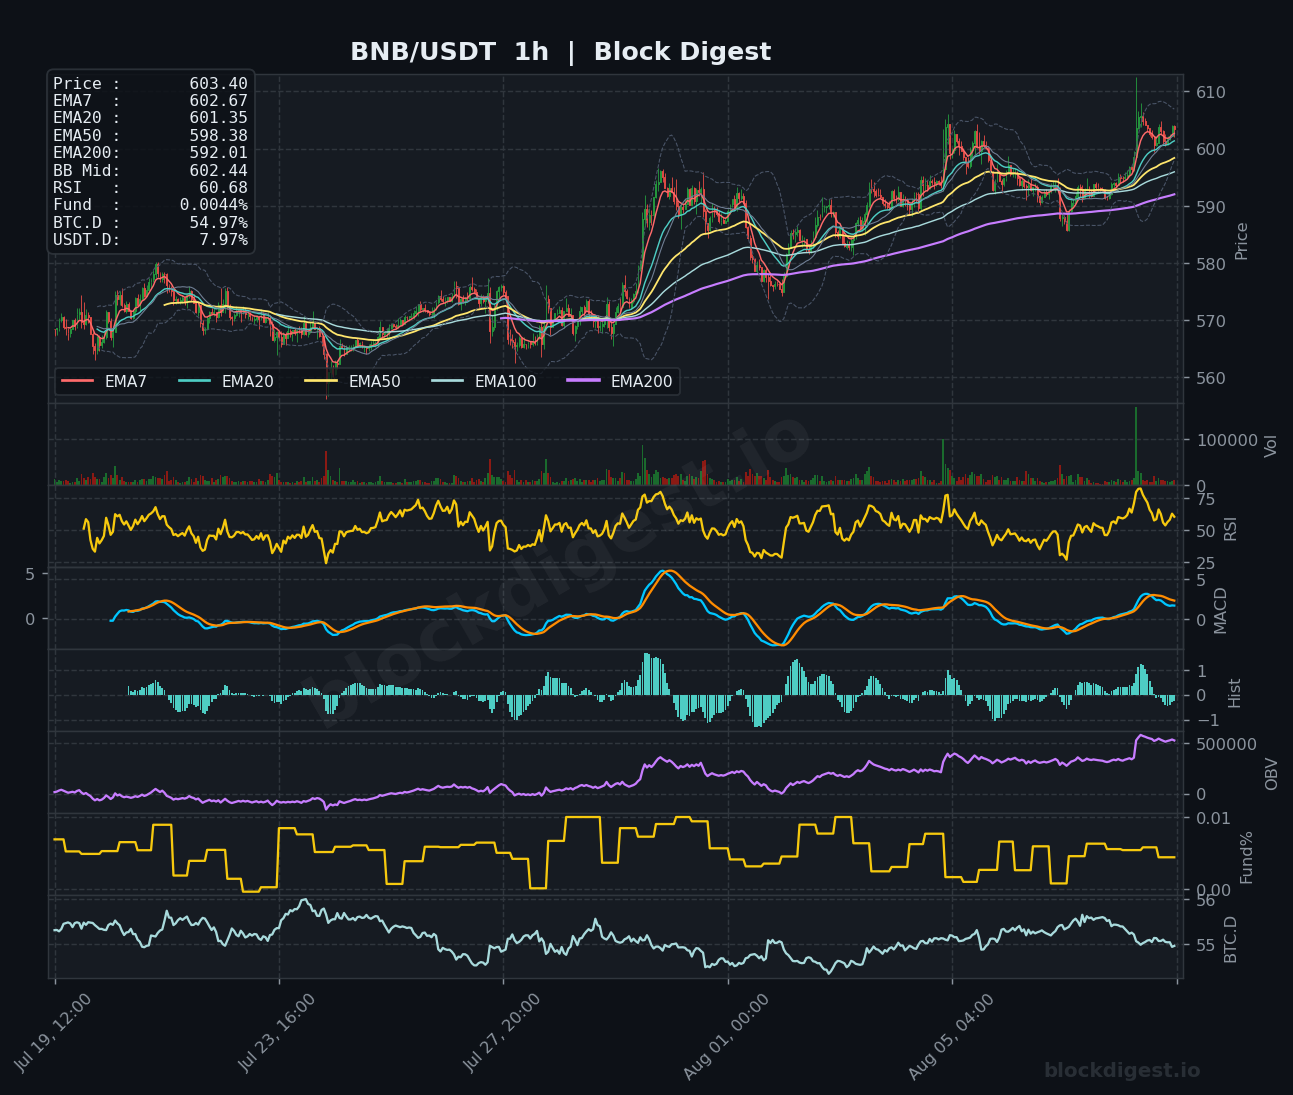
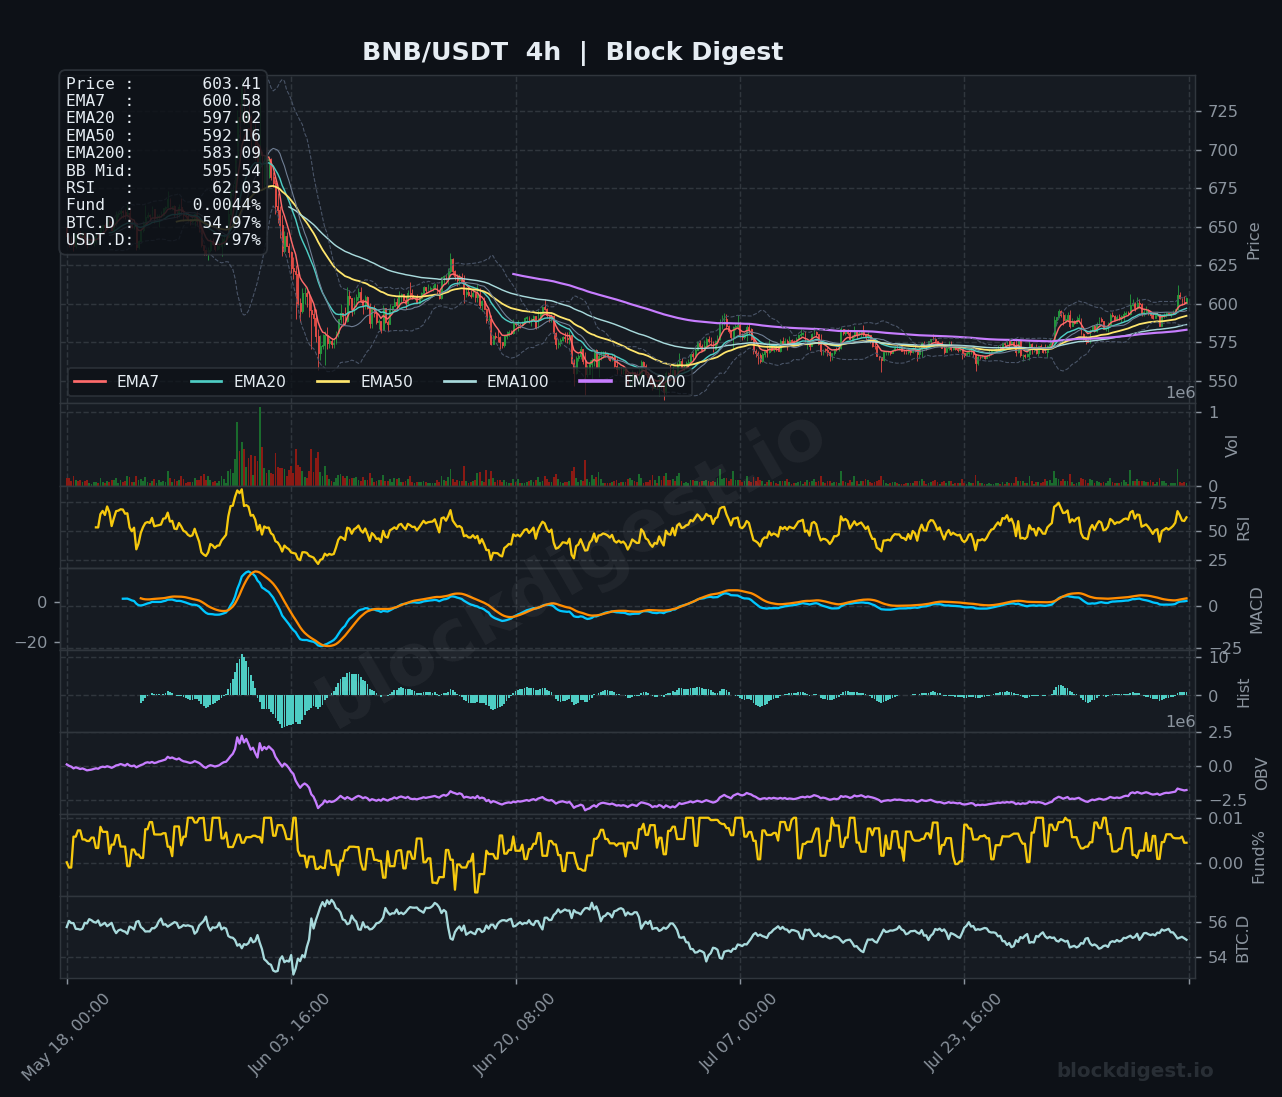
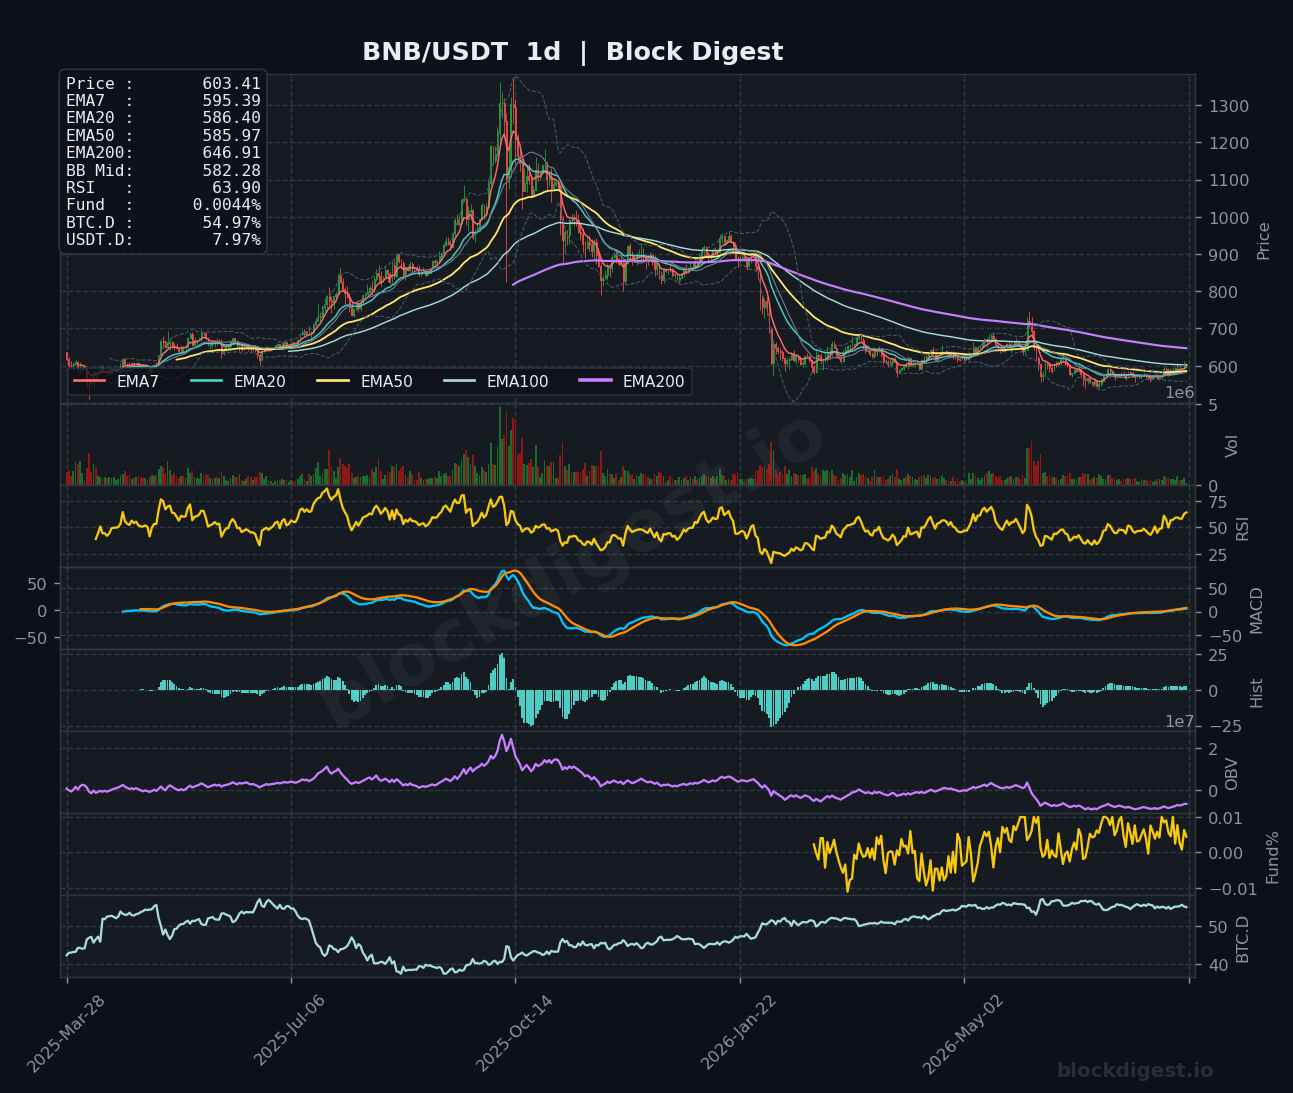
BNB is the clear relative strength leader among today’s six coins, trading at $603.40 with all short-term EMAs in a bullish alignment on both the 1h and 4h charts — price is above EMA7 ($602.67), EMA20 ($601.35), EMA50 ($598.38), and EMA200 ($592.01) on the hourly, reflecting a sustained upward grind from the $575 range. The 1h RSI at 60.68 and 4h RSI at 62.03 are in healthy bullish territory without being stretched, and the 1h OBV has been rising steadily, confirming that buying pressure is supporting price rather than just a short-squeeze dynamic. On the daily chart, RSI has climbed to 63.90 and the MACD histogram is constructively positive, suggesting the intermediate trend is intact. Immediate resistance sits near $610 (recent intraday high), with the $595–$598 zone serving as a first line of support; above $610, the next significant level is the $620–$625 area.
Dogecoin (DOGE)
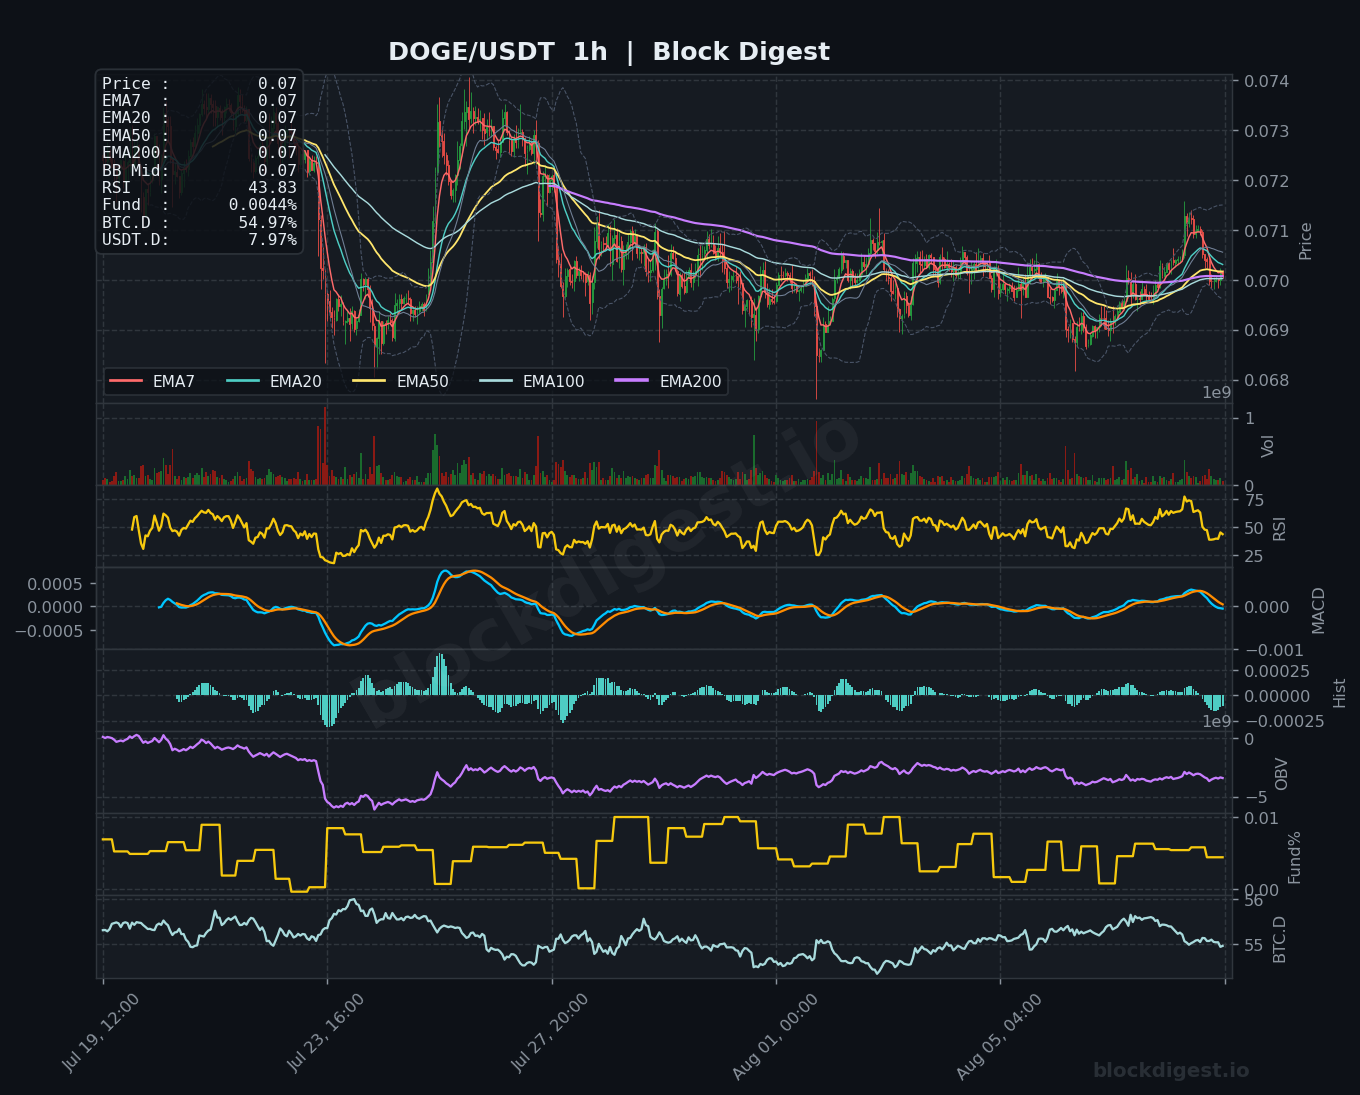
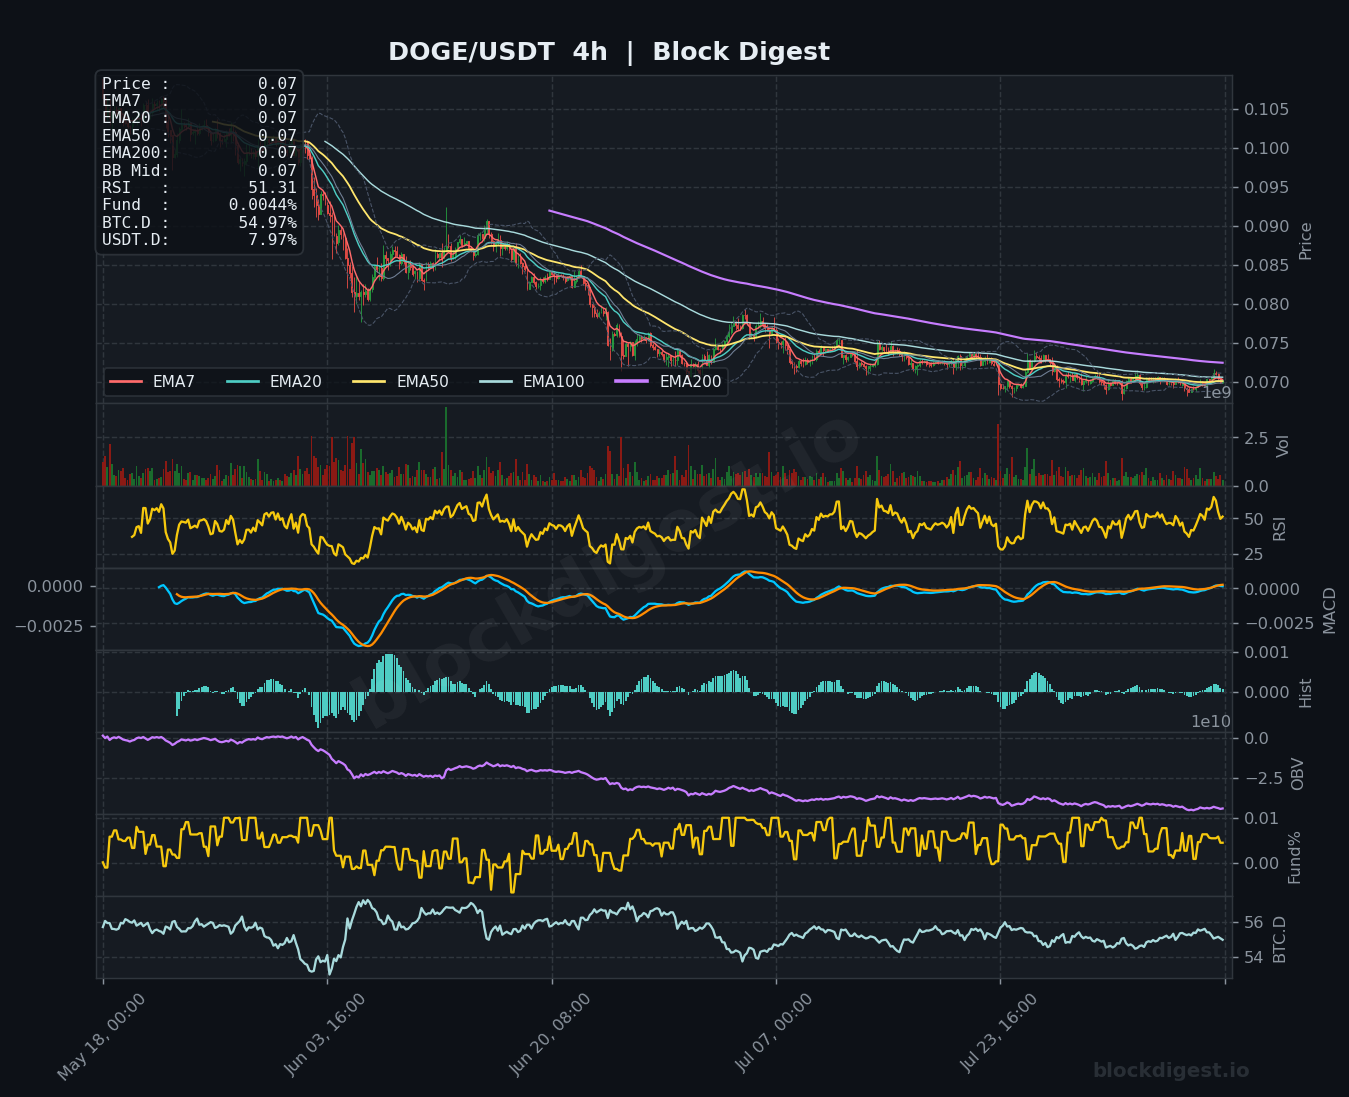
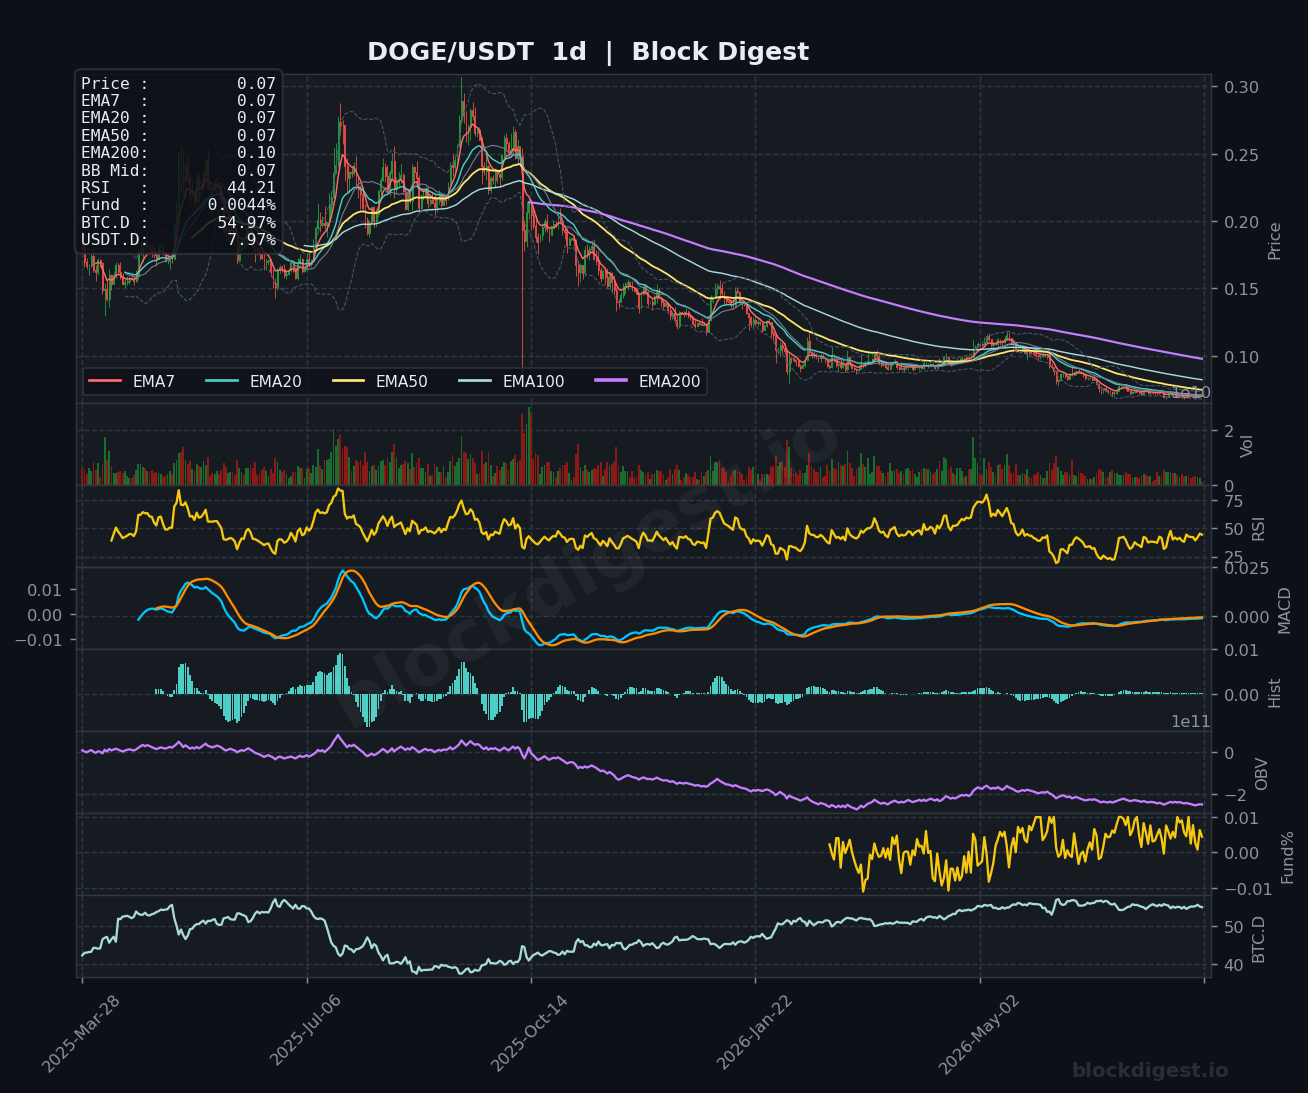
DOGE is struggling at $0.070, compressed within an extremely tight range on the 1h chart where all EMAs (EMA7 through EMA200) are converging at $0.07 — a coiling structure that typically precedes a directional resolution, though the daily and 4h context strongly favor the downside. The 1h RSI at 43.83 and daily RSI at 44.21 both lean bearish without being oversold, and the daily MACD remains in negative histogram territory, showing no meaningful bullish divergence. The 4h OBV has been in a prolonged decline since mid-May, consistent with the 20 bearish technical signals noted across broader indicator sets — smart money has not been accumulating at these levels. With the $0.069 floor tested multiple times recently, a definitive break below that level opens the door toward $0.065; a recovery above $0.072 would be needed to change the near-term narrative.
Litecoin (LTC)
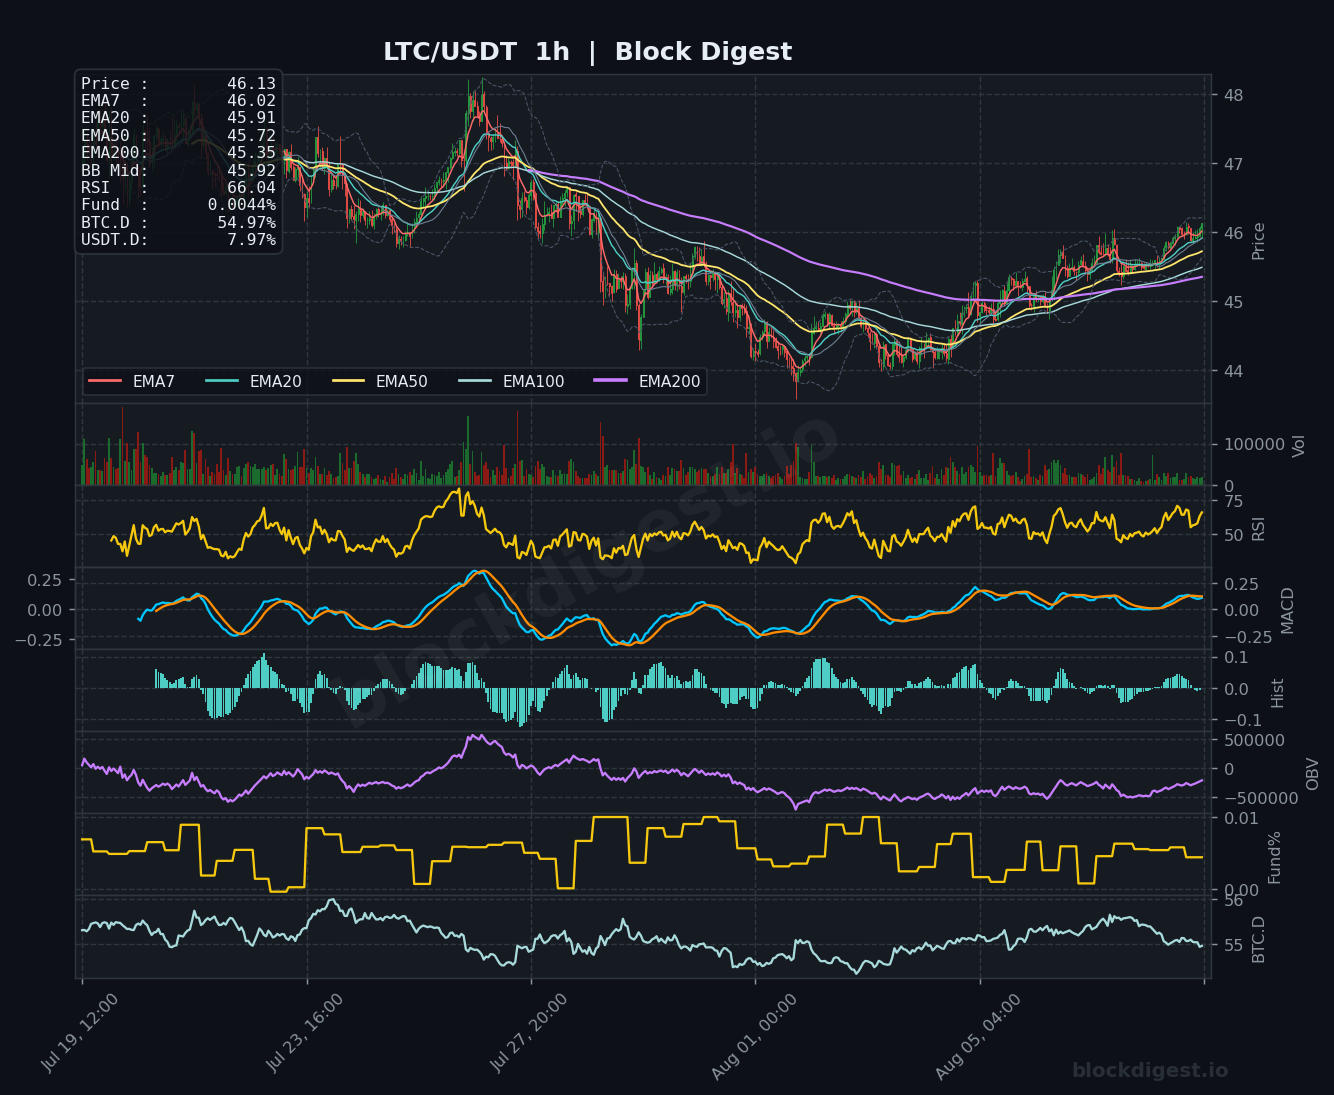
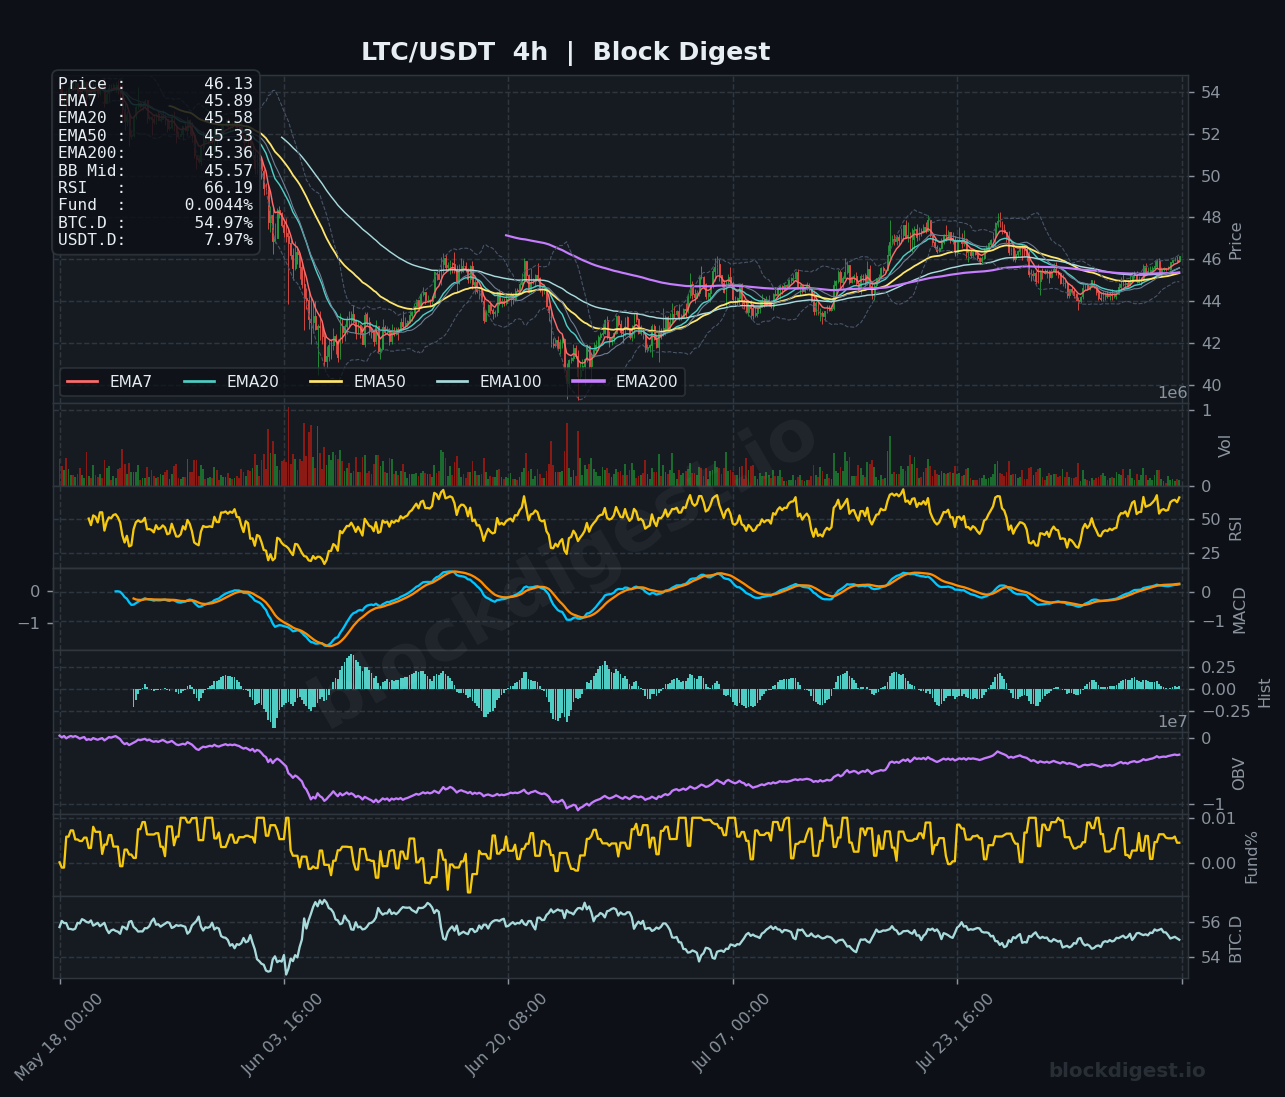
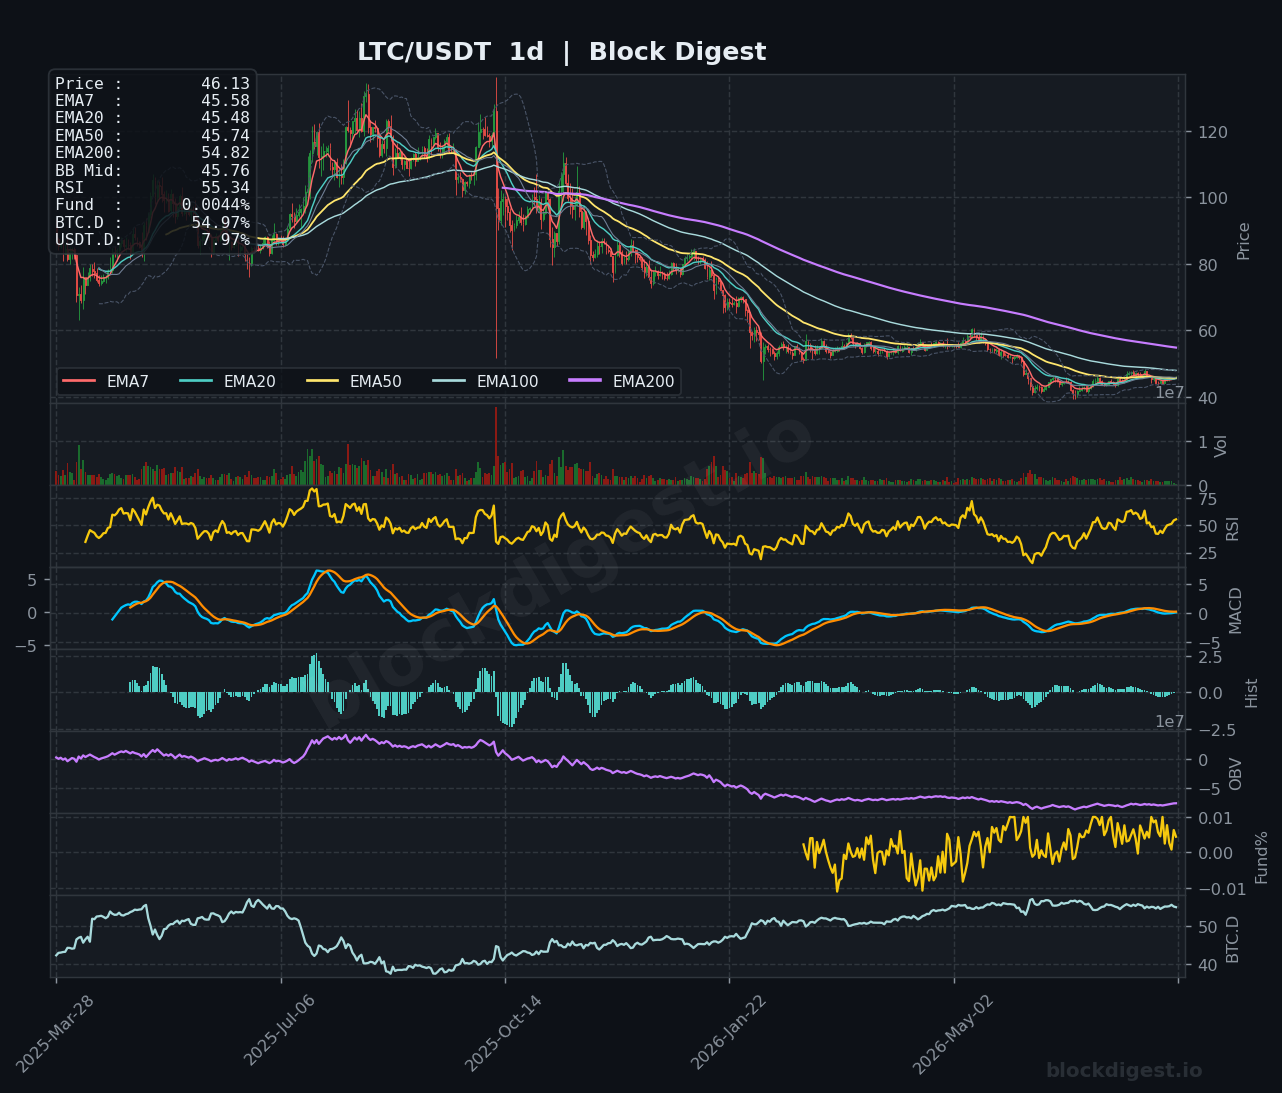
LTC is trading at $46.13, and the short-term picture is arguably the most interesting technical setup among today’s reviewed coins — the 1h chart shows a clean bullish EMA stack with price above EMA7 ($46.02), EMA20 ($45.91), EMA50 ($45.72), and EMA200 ($45.35), and the RSI at 66.04 shows recovering momentum without yet being overbought. The 4h RSI mirrors this at 66.19, with the MACD attempting a bullish crossover from neutral territory, while the 4h OBV has been gradually improving from its lows — a positive divergence from the broader trend. However, the daily chart provides important context: LTC remains in a long-term downtrend with the EMA200 at $54.82 acting as a distant overhead anchor, meaning this current bounce is best interpreted as a tactical recovery within a larger bear structure. Key resistance sits at $47.50–$48.00 (the recent swing high), with support clustered at $45.00–$45.35.
TRON (TRX)
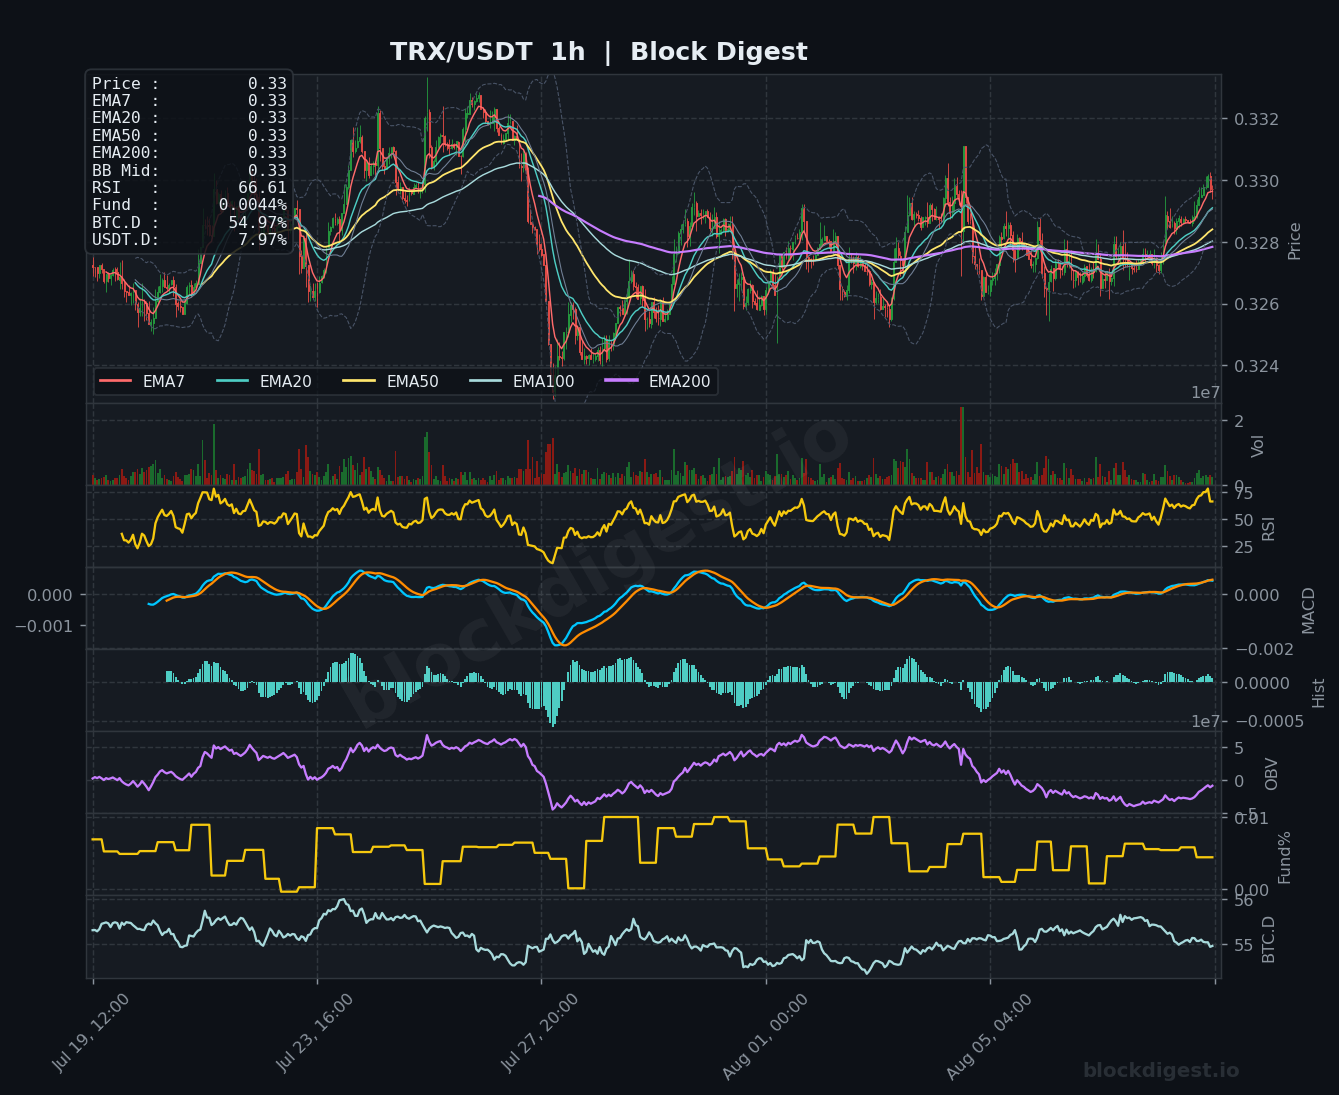
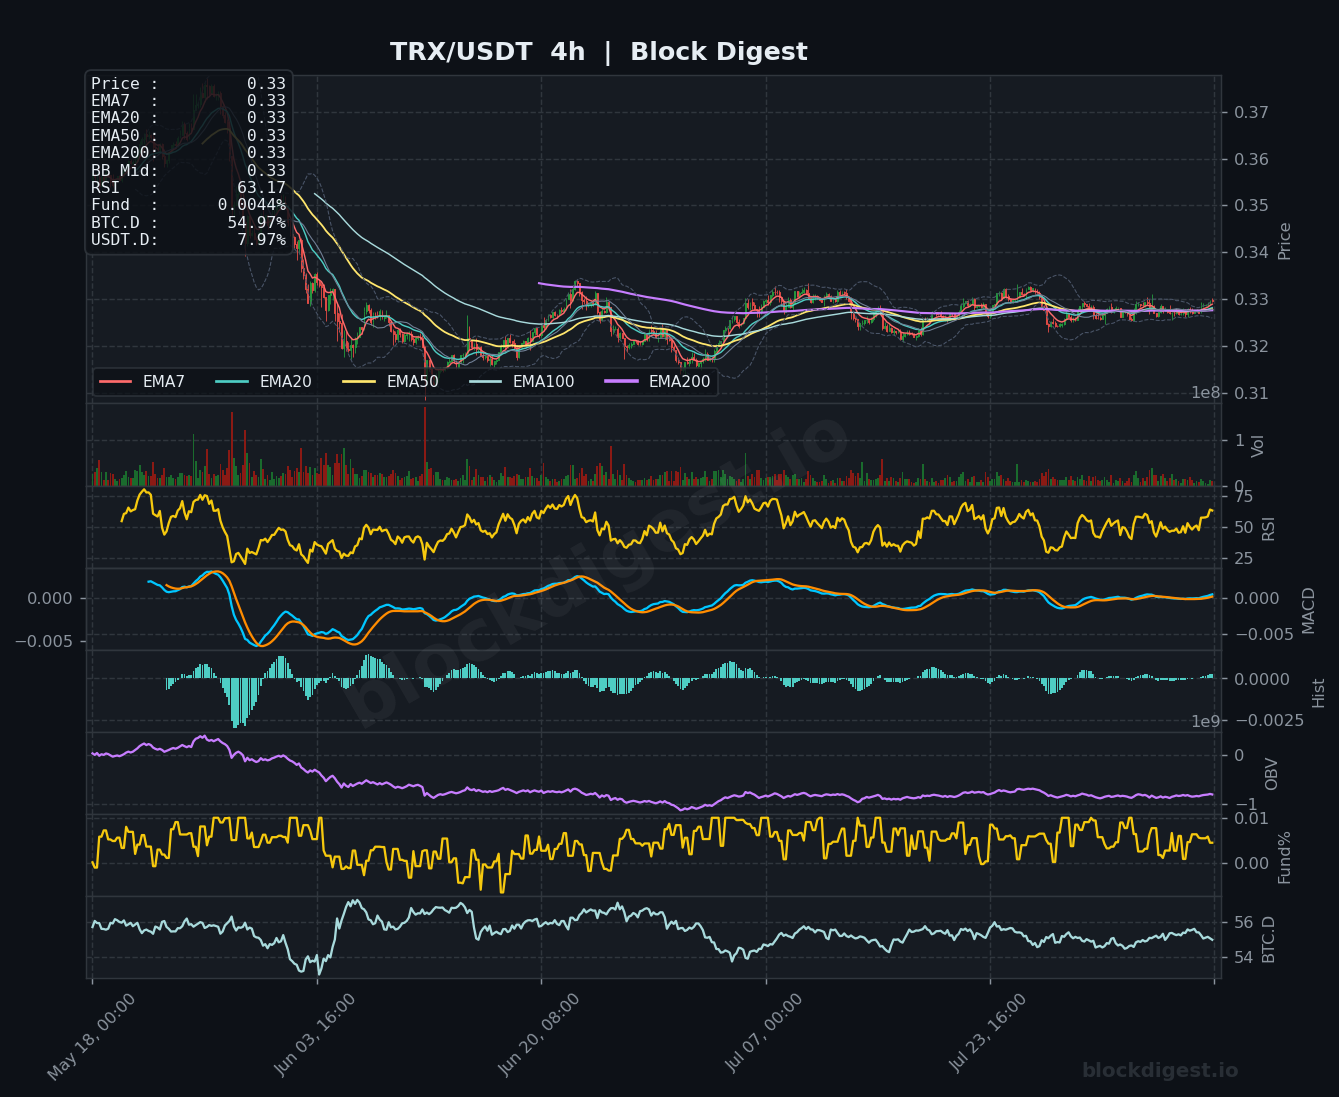
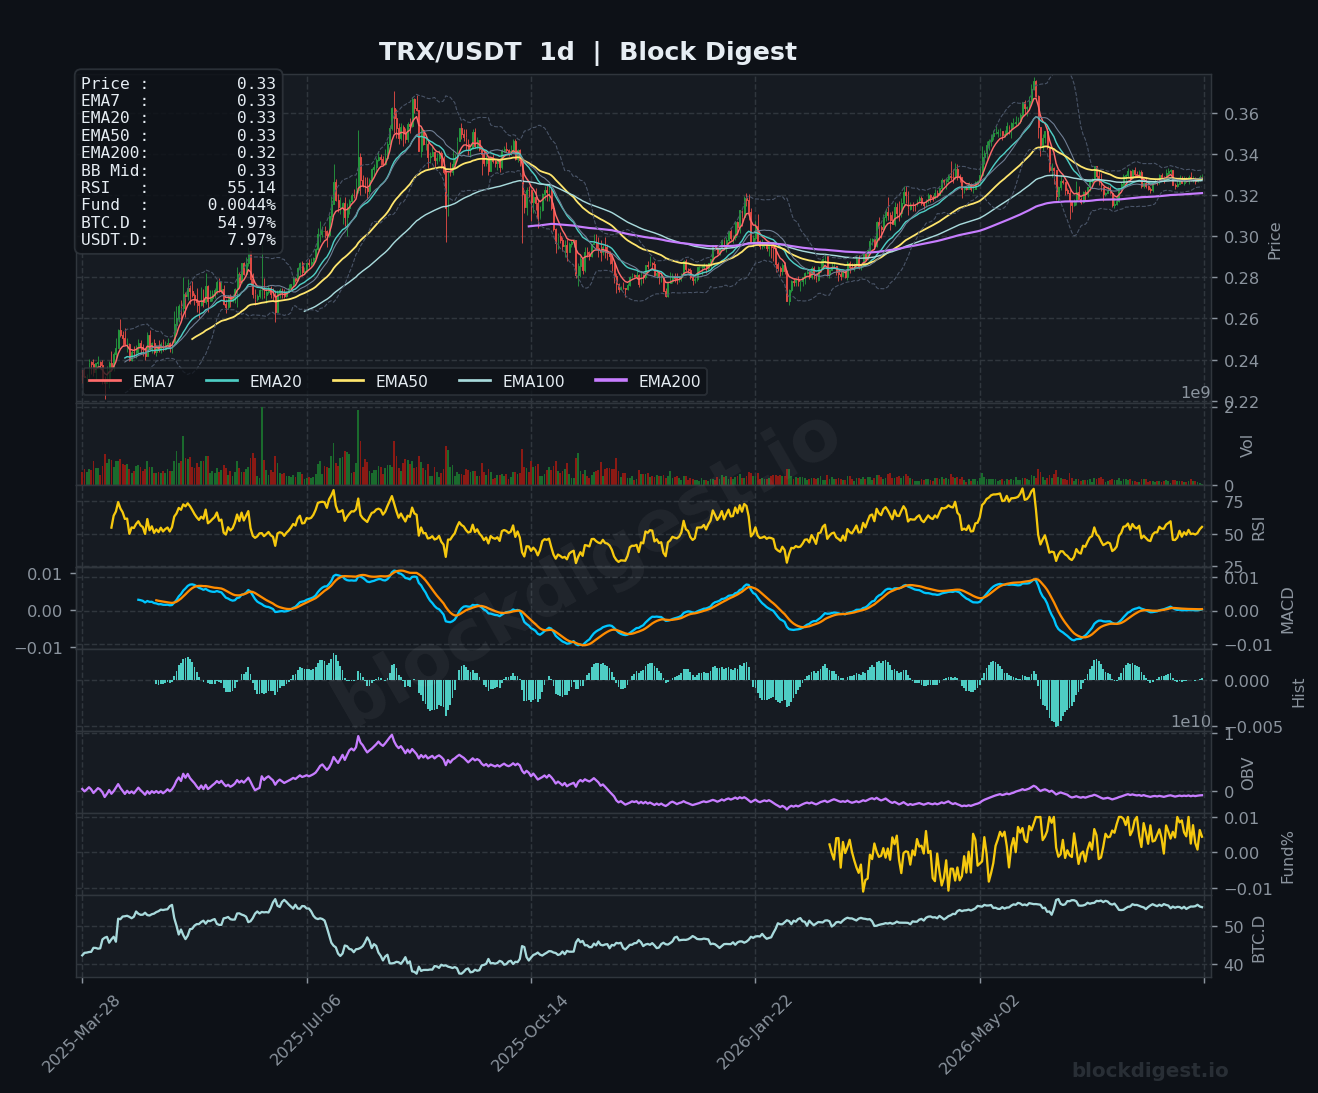
TRX is trading at $0.330, showing relative resilience and one of the cleaner range-bound structures among today’s assets — the 1h RSI at 66.61 and 4h RSI at 63.17 indicate building upside momentum, with price sitting at the upper boundary of a tight consolidation band between roughly $0.328 and $0.332. The 1h EMA stack is bullishly aligned with all short-term EMAs clustered tightly at $0.330, and the MACD on both the 1h and 4h timeframes shows a constructive positive crossover developing. The daily chart offers a more nuanced view — TRX peaked near $0.36 earlier this cycle before pulling back, and the daily RSI at 55.14 along with a mildly positive MACD signal suggests the asset is in a stabilization phase rather than a fresh impulse. A sustained break above $0.332 could target $0.336–$0.340, while $0.326–$0.328 serves as the key near-term support.
Altcoin Outlook
The altcoin landscape on August 9 is one of clear bifurcation: BNB and LTC show the strongest short-term technical setups with bullish EMA structures and constructive momentum, while XRP and DOGE present the weakest configurations — both weighed down by declining OBV trends and price action trapped beneath key moving average resistance. SOL and TRX sit in the middle ground, with SOL needing to confirm a daily EMA50 reclaim and TRX requiring a breakout above $0.332 to ignite any meaningful follow-through. The Long/Short Account Ratio of 1.2 (54.5% longs) from BD Pulse data implies a market that is mildly directionally committed to the upside but not crowded enough to trigger aggressive liquidations — a relatively balanced positioning environment. Traders should watch BTC dominance closely: any sustained move below 54% would likely act as the catalyst needed to unlock broader altcoin participation, while a push toward 56% would pressure the weaker names further.
—
Disclaimer: This analysis is for informational purposes only and does not constitute financial advice. Cryptocurrency markets are highly volatile and unpredictable. All trading decisions should be made based on your own research and risk tolerance. Block Digest is not responsible for any financial losses incurred as a result of acting on this content.
Stay Ahead of the Market
Follow BlockDigest for crypto market intelligence, research and real-time updates.