BTC Daily Analysis — April 27, 2026
Market Overview
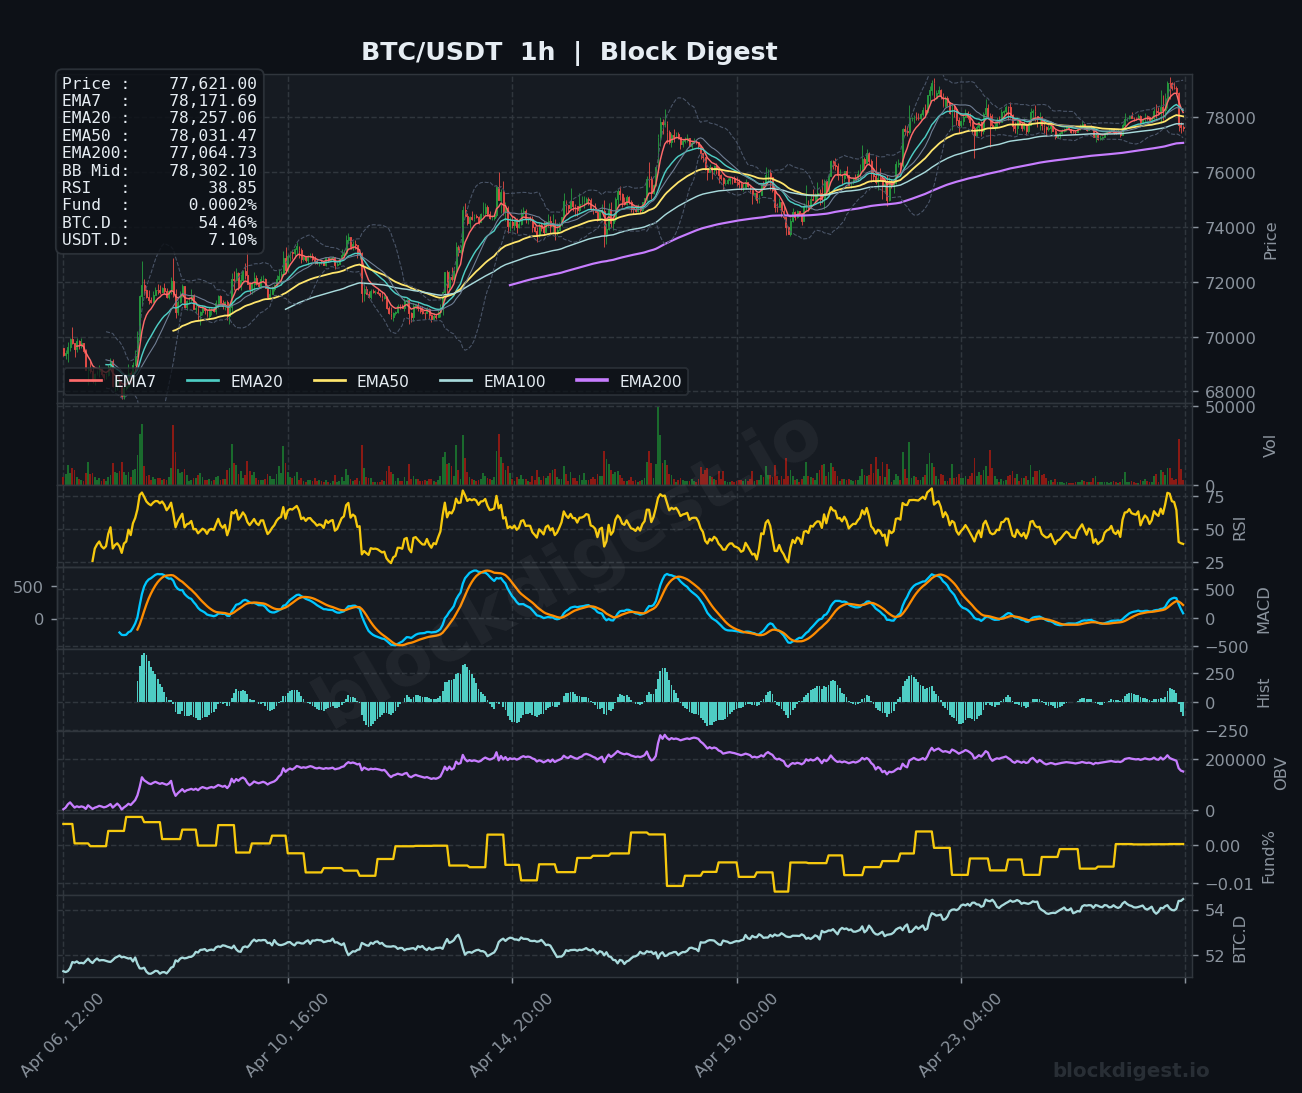
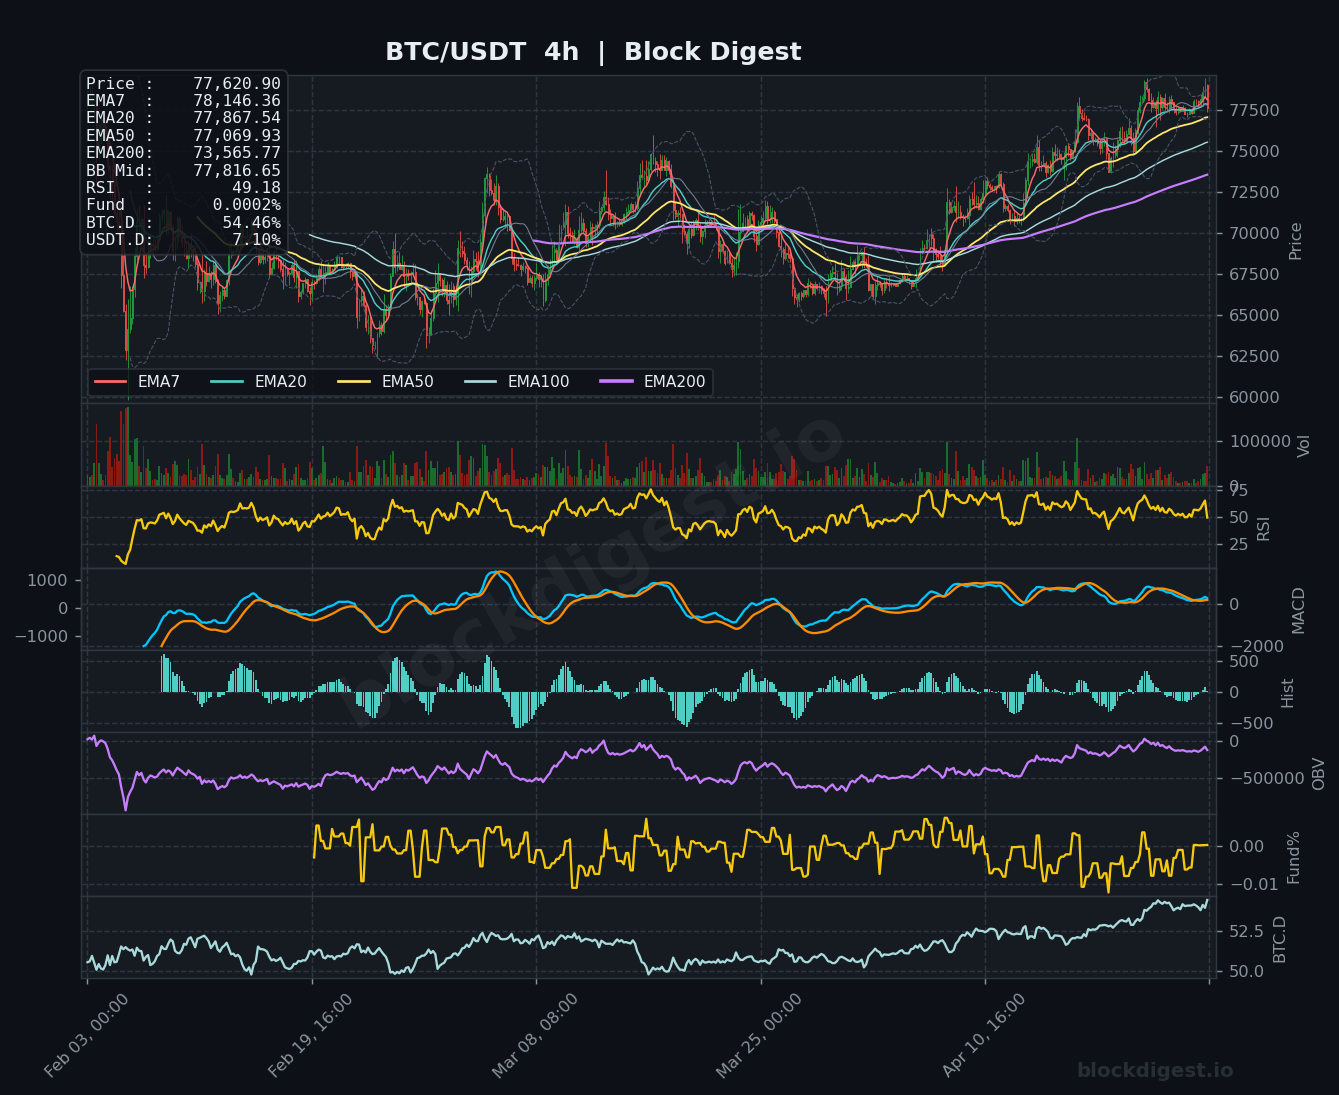
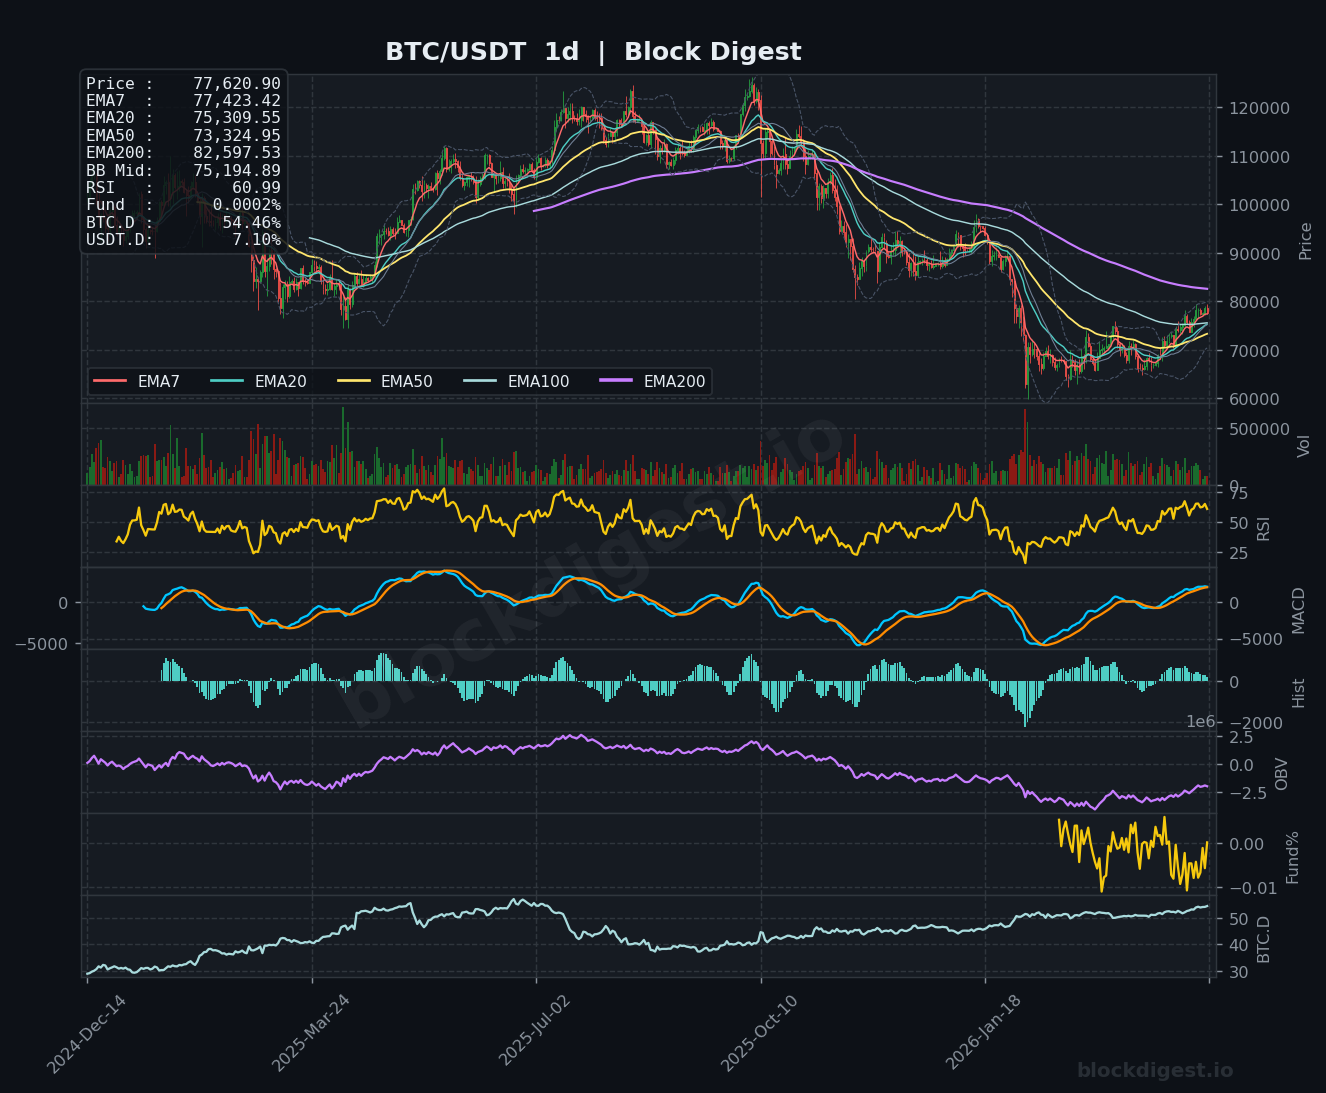
Bitcoin is trading at $77,621, consolidating just above the middle Bollinger Band at $78,302 on the 1-hour chart while maintaining position above the EMA7 ($78,171). The daily timeframe reveals BTC remains well below key moving averages, with price trading beneath EMA50 ($73,324) and significantly under EMA200 ($82,597), indicating a bearish longer-term structure despite recent recovery attempts. Current positioning shows price compressed between the upper Bollinger Band near $78,000 and lower support around $76,000, suggesting a period of range-bound consolidation following recent volatility. The RSI readings across timeframes present mixed signals: neutral at 38.85 on the 1h, 49.18 on the 4h, but concerning at 60.99 on the daily, indicating potential exhaustion of the recent bounce from lower levels.
Multi-Timeframe Confluence
The multi-timeframe analysis reveals significant divergence between short-term and long-term price action. While the 1-hour and 4-hour charts show price attempting to stabilize above immediate EMA7 and EMA20 levels ($78,146 and $77,867 respectively on the 4h), the daily chart demonstrates BTC remains trapped below all major moving averages with price action compressed under resistance. The $77,000-$78,000 zone has emerged as critical confluence across all timeframes, serving as both immediate support on lower timeframes and resistance on the daily structure. MACD on the 1-hour timeframe shows both lines hovering near zero with minimal separation, while the 4-hour MACD displays a similar compressed pattern, indicating indecision and lack of strong directional momentum despite recent price recovery from the April lows near $67,000.
Key Levels to Watch
Resistance:
- $78,300-$78,500 – Immediate resistance zone coinciding with 1h Bollinger Band midpoint and multiple EMA convergence; rejection here would maintain range-bound conditions
- $80,000-$82,000 – Major overhead supply zone encompassing EMA200 on the daily chart at $82,597; this level represents the dividing line between bearish structure and potential trend reversal
- $85,000-$87,000 – Previous consolidation zone from March that now serves as significant resistance should price break above the EMA200 barrier
Support:
- $76,000-$76,500 – Immediate support zone marked by recent swing lows on the 4h chart and local demand concentration
- $73,000-$74,000 – Critical support encompassing daily EMA50 at $73,324 and representing the lower boundary of recent consolidation range
- $68,000-$70,000 – Major demand zone established during April decline; loss of this area would signal continuation of the broader downtrend visible on the daily chart
Momentum & On-Chain Signals
Momentum indicators present a mixed picture suggesting consolidation rather than directional conviction. The RSI on the 1-hour timeframe at 38.85 indicates short-term oversold conditions with room for upside relief, while the 4-hour RSI at 49.18 sits perfectly neutral. However, the daily RSI at 60.99 suggests the recent bounce may be approaching overbought territory on the higher timeframe, potentially limiting immediate upside. MACD across all timeframes shows compressed histogram bars with both lines converging near the zero level, indicating momentum exhaustion and lack of conviction from either bulls or bears. OBV on the daily chart shows relative stability without significant accumulation or distribution, suggesting sideways price action is likely to persist. The Funding Rate at 0.0002% reflects neutral perpetual futures sentiment with neither excessive long nor short positioning, supporting the range-bound thesis.
BTC Dominance & Market Sentiment
Bitcoin Dominance stands at 54.46%, reflecting moderate but stable market share for BTC, while USDT Dominance at 7.10% suggests reasonable stablecoin participation without extreme fear-driven capital rotation. The combination of elevated BTC.D with moderate USDT.D indicates that capital is preferentially flowing into Bitcoin over altcoins but without panic-driven moves into stablecoins, suggesting cautious but not fearful market sentiment. This configuration typically supports range-bound BTC price action as the market consolidates before determining its next major directional move.
Risk Scenarios
Bullish case: A decisive 4-hour close above $78,500 with supporting volume and RSI holding above 50 would open the path toward testing $80,000-$82,000 resistance zone. Reclaiming the daily EMA200 at $82,597 with MACD positive crossover would confirm trend reversal potential with targets extending toward $85,000-$87,000.
Bearish case: Failure to hold $76,000 support with increasing selling volume and RSI breakdown below 40 on the 4h chart would signal renewed weakness targeting $73,000-$74,000. A break below daily EMA50 at $73,324 would confirm bearish continuation with potential cascade toward $68,000-$70,000 demand zone.
Outlook
Bitcoin remains structurally range-bound between $76,000-$78,500 with limited conviction from either bulls or bears as evidenced by compressed MACD, neutral funding rates, and conflicting RSI readings across timeframes. The immediate bias remains neutral-to-slightly-bearish given the position below major daily moving averages, but short-term price action suggests consolidation rather than immediate breakdown. Key triggers to monitor include a sustained break above $78,500 with volume expansion (bullish) or loss of $76,000 support (bearish). The critical level that would fundamentally alter the current thesis is the daily EMA200 at $82,597—reclaiming this level would shift the intermediate trend from bearish to neutral/bullish, while continued rejection reinforces the broader downtrend structure. Traders should anticipate range-bound conditions with low probability of decisive breakout until volume and momentum indicators provide clearer directional signals.
Charts