Market Context
The broader altcoin market is navigating a risk-off environment as Bitcoin dominance holds firm at 54.59%, a level that historically suppresses meaningful alt rallies and signals continued capital rotation toward BTC as a relative safe haven. USDT dominance at 8.15% remains elevated, confirming that sidelined cash has yet to re-enter risk assets in any meaningful way. Our proprietary BD Pulse Score registering just 24/100 — deep in Extreme Bear territory — reinforces the cautious macro backdrop, suggesting the altcoin market as a whole lacks the structural momentum needed for a sustained breakout heading into August.
Solana (SOL)
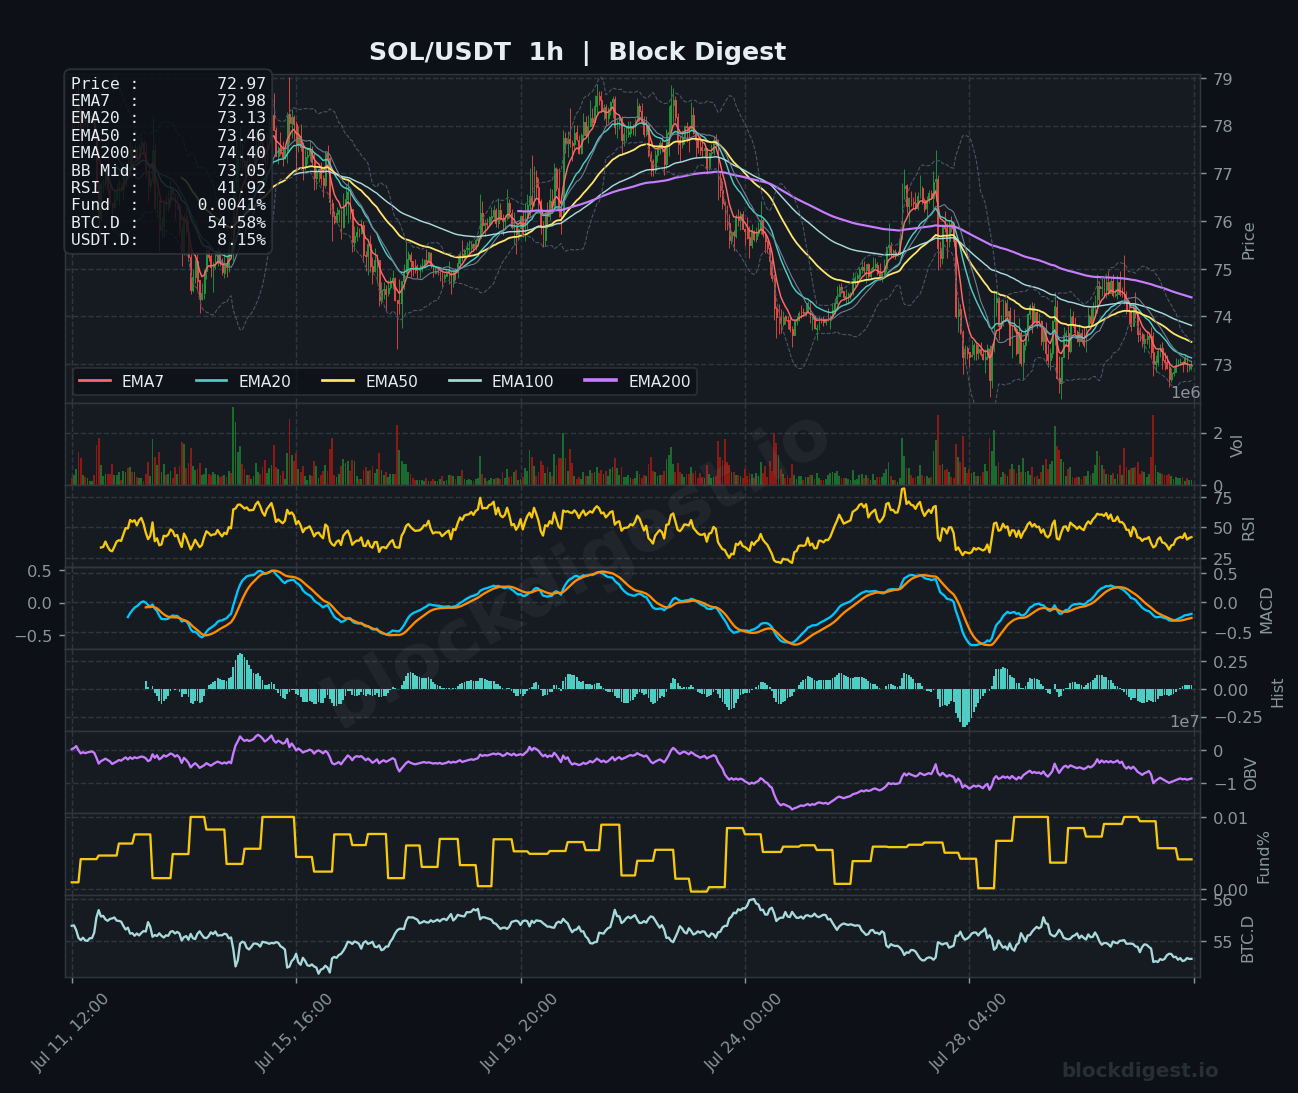
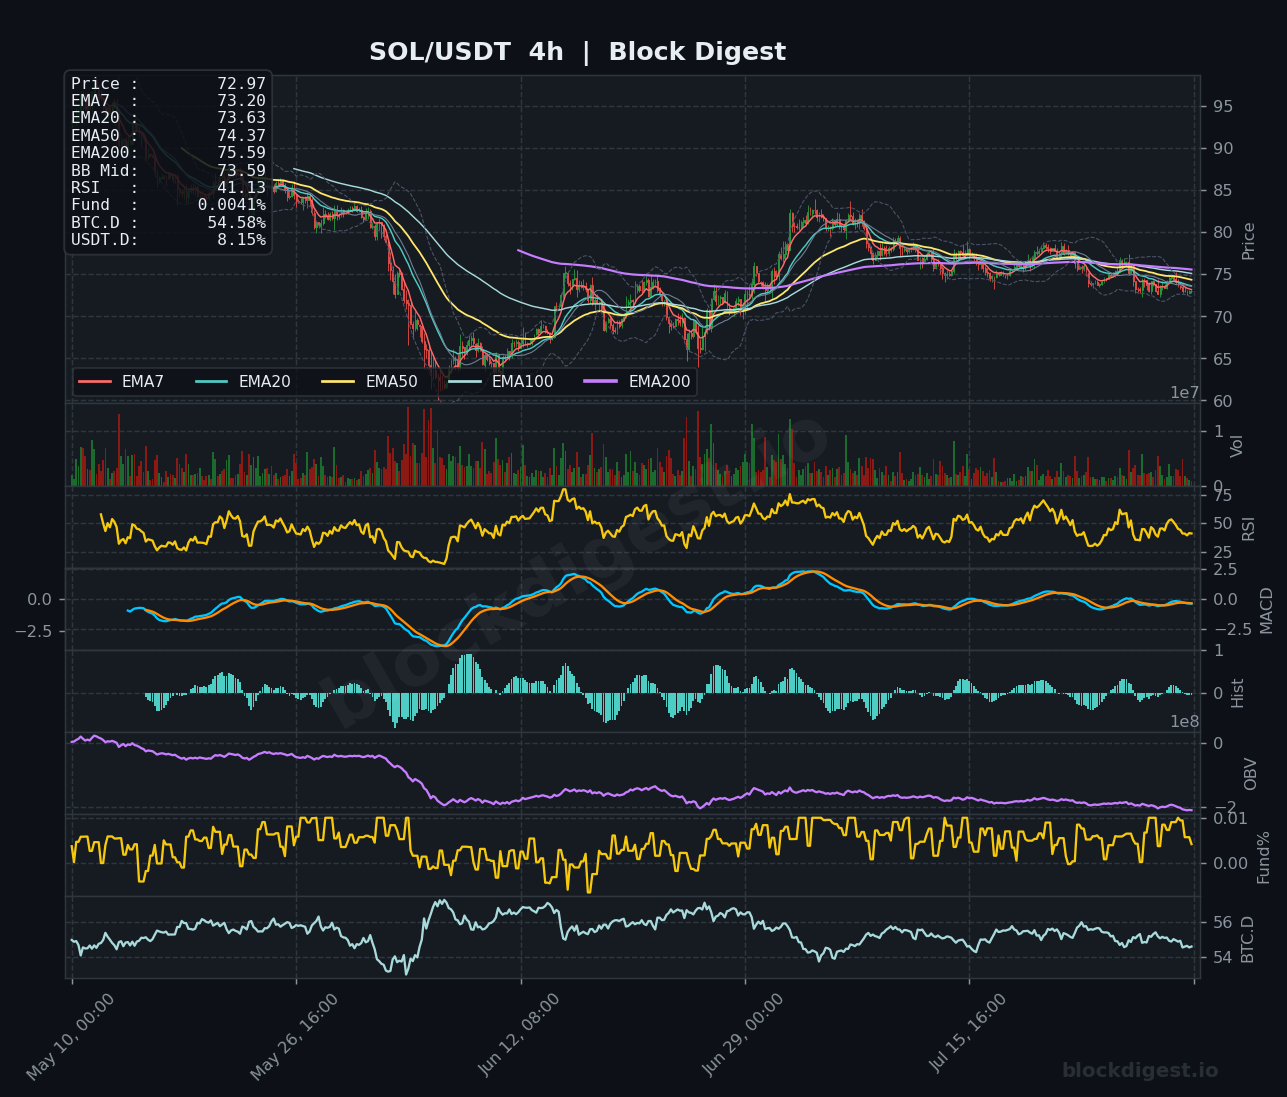
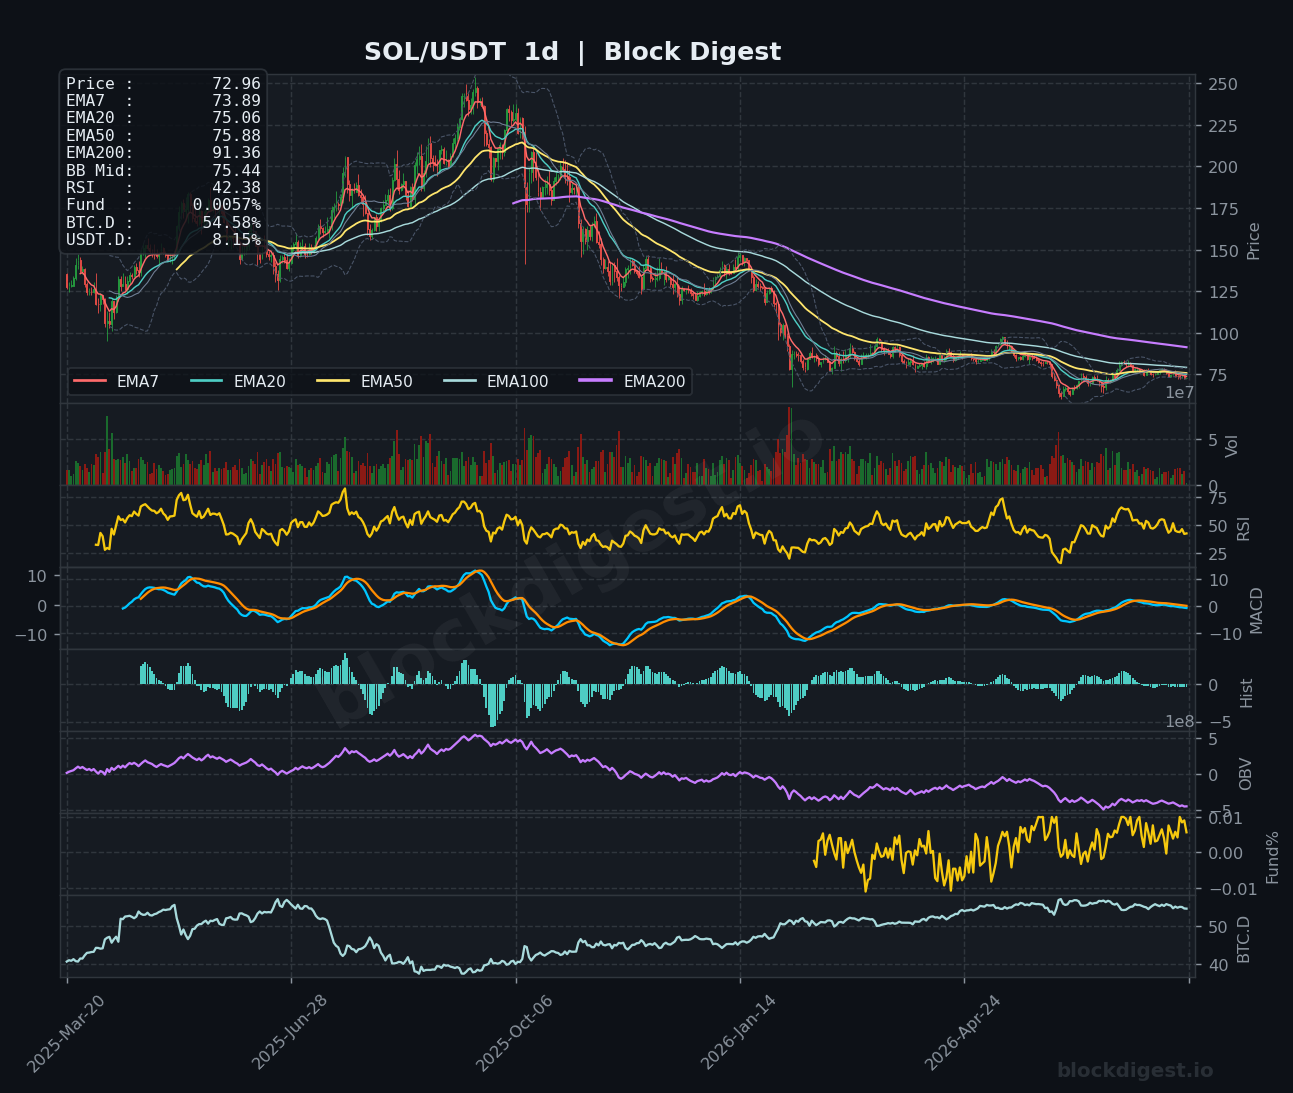
SOL is trading at $72.97, firmly beneath its key EMA cluster — the EMA20 at $73.13, EMA50 at $73.46, and EMA200 at $74.40 on the 1h chart — indicating that every short-term moving average is now acting as overhead resistance. The 4h chart tells a similarly bearish story, with price compressing below all major EMAs after a failed attempt to reclaim the $80 region, while the daily chart shows a prolonged downtrend from the highs above $200, with the EMA200 sitting far above at $91.36. The 1h RSI at 41.92 and the 4h RSI at 41.13 are both sub-neutral without reaching oversold territory, leaving room for further downside before a technically credible bounce materializes. MACD on the 4h is flattening near zero with minimal histogram conviction, keeping the short-term bias decidedly bearish with immediate resistance at $74–$75 and support to watch around $70.
XRP (XRP)
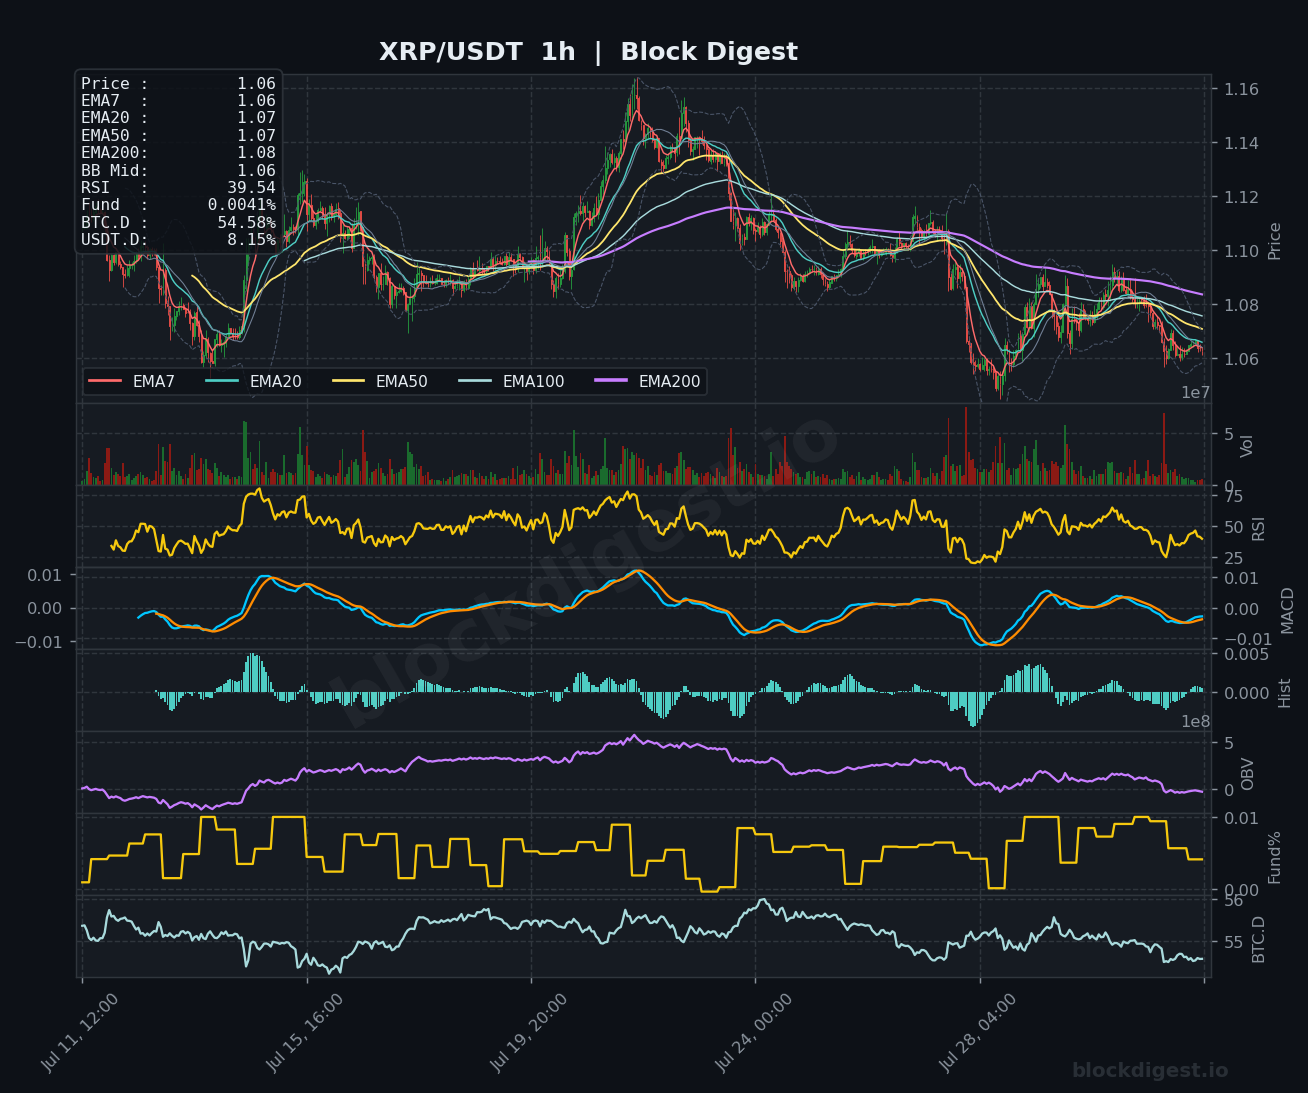
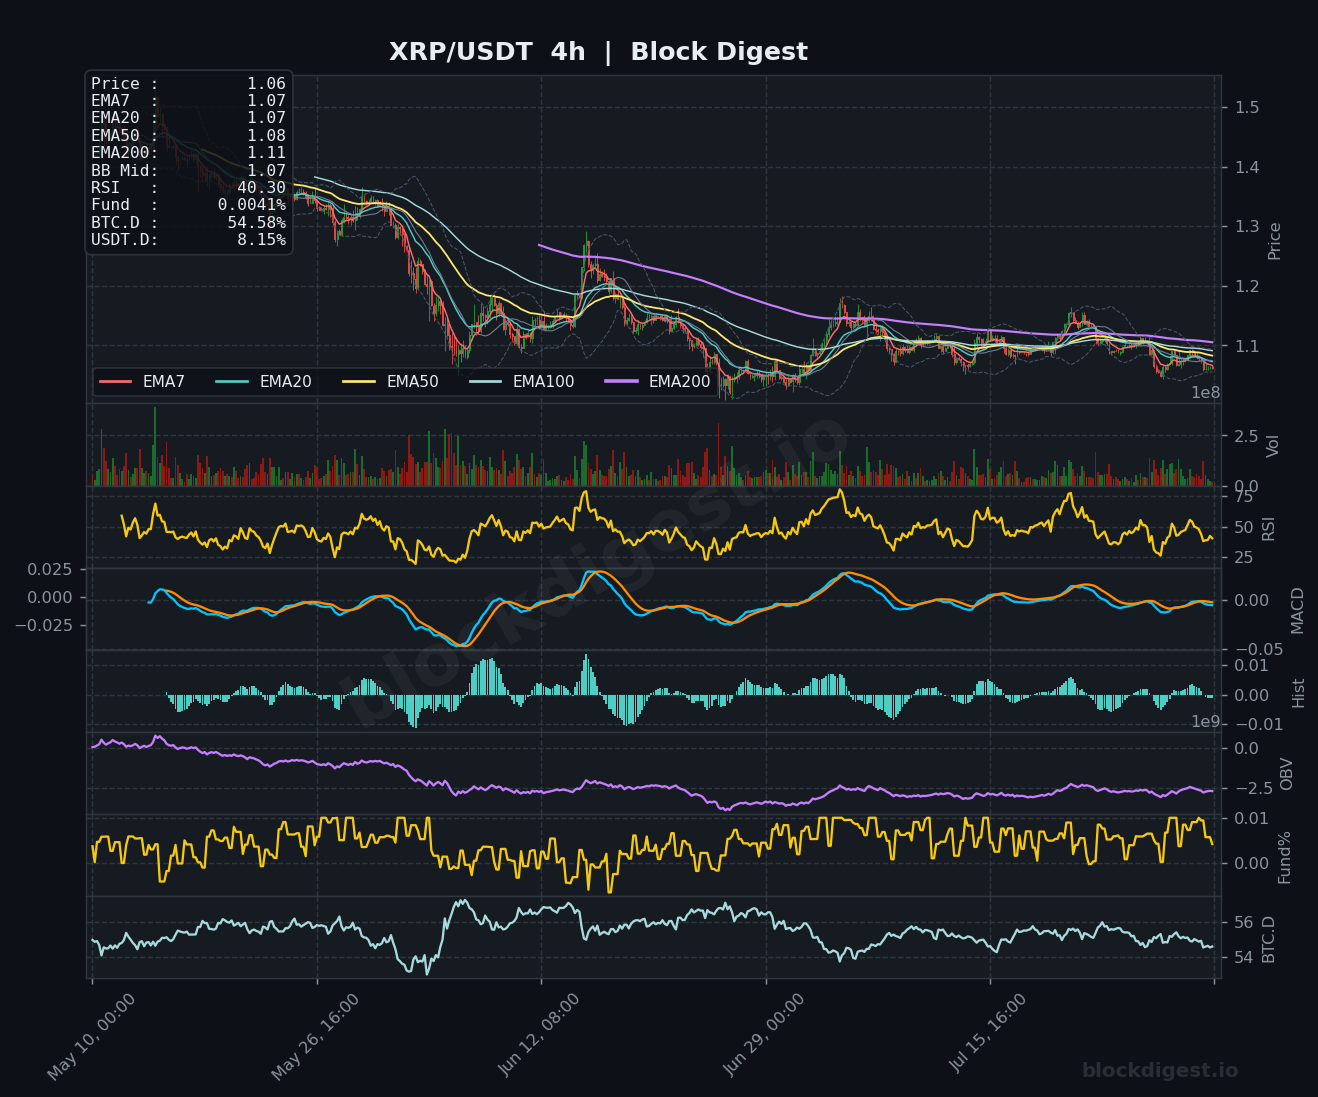
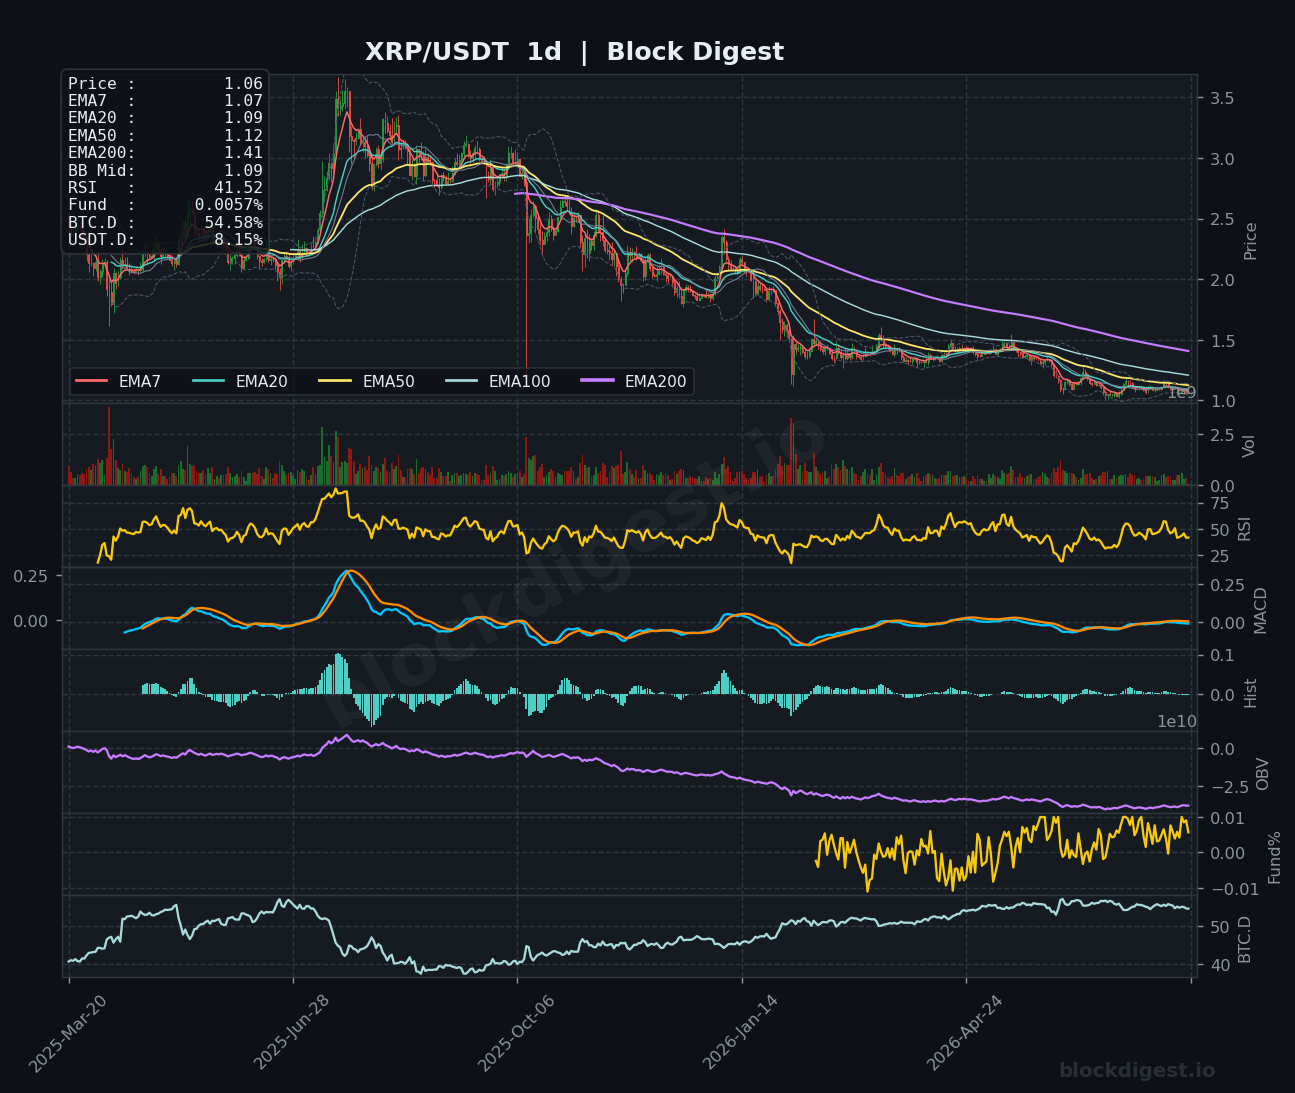
XRP is trading at $1.06, pinned below bearish EMA stacking on both the 1h (EMA20: $1.07, EMA50: $1.07, EMA200: $1.08) and the 4h timeframes, where all moving averages slope downward and converge tightly just above current price. The daily chart paints a harsh longer-term picture — XRP has shed the bulk of its prior bull run gains and the EMA200 at $1.41 looms as a distant ceiling, with price unable to sustain any meaningful recovery. Despite reports of XRP posting a 4% intraday bounce versus the broader market decline, the 1h RSI at 39.54 and 4h RSI at 40.30 remain below neutral, and the MACD on both timeframes continues to drift around zero without a bullish crossover. Immediate resistance sits at the $1.08–$1.10 zone; a failure to reclaim $1.10 on a closing basis keeps the short-term bias bearish, with support at $1.04.
BNB (BNB)
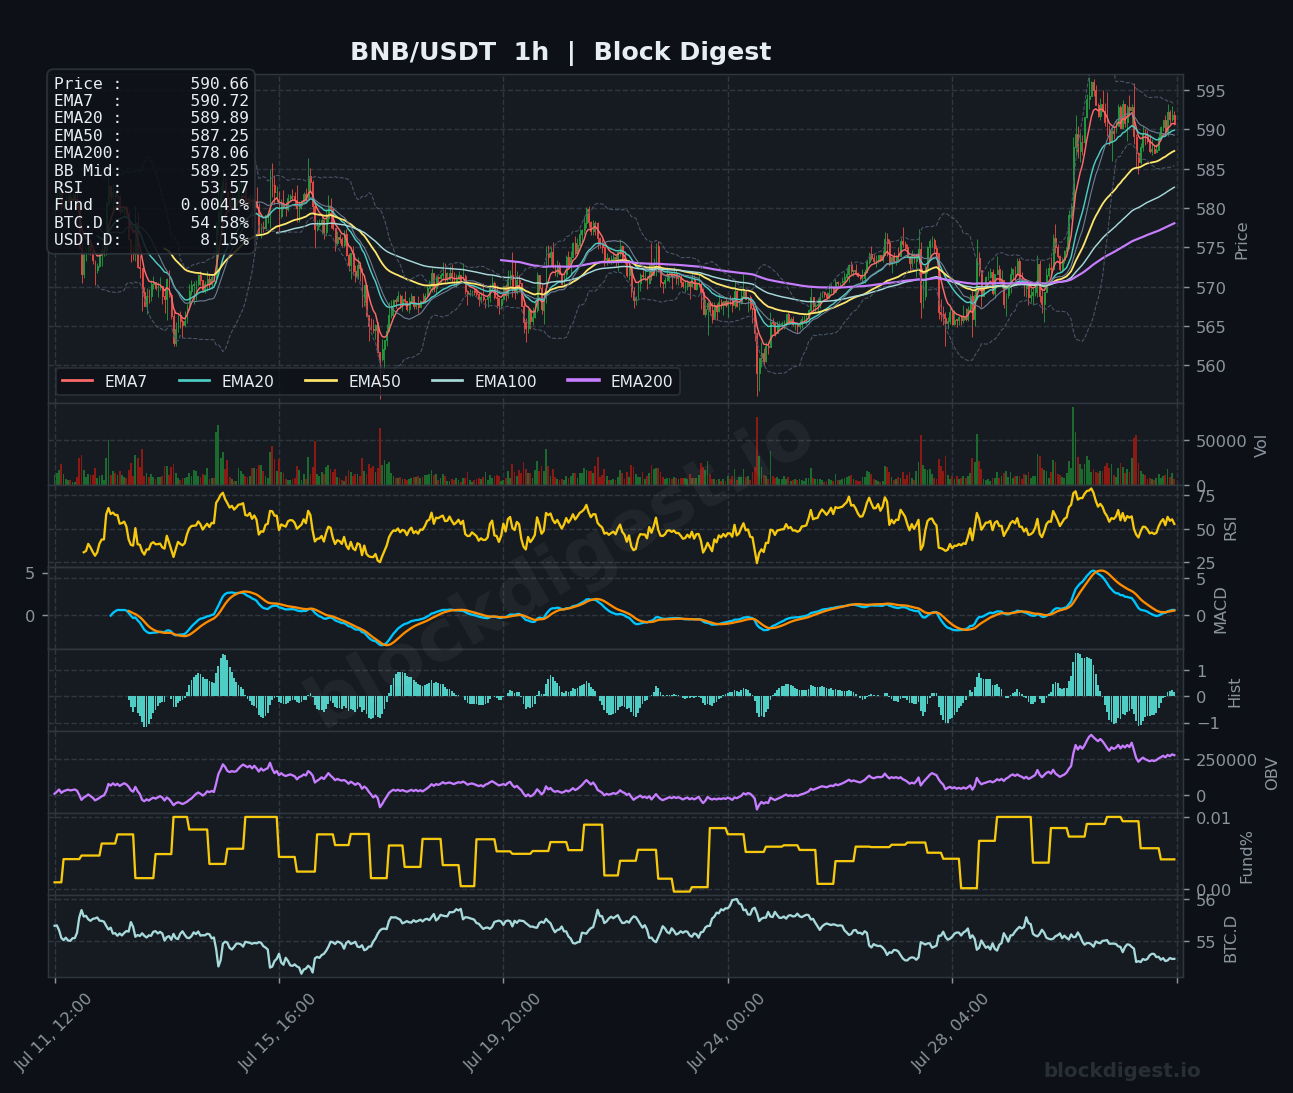
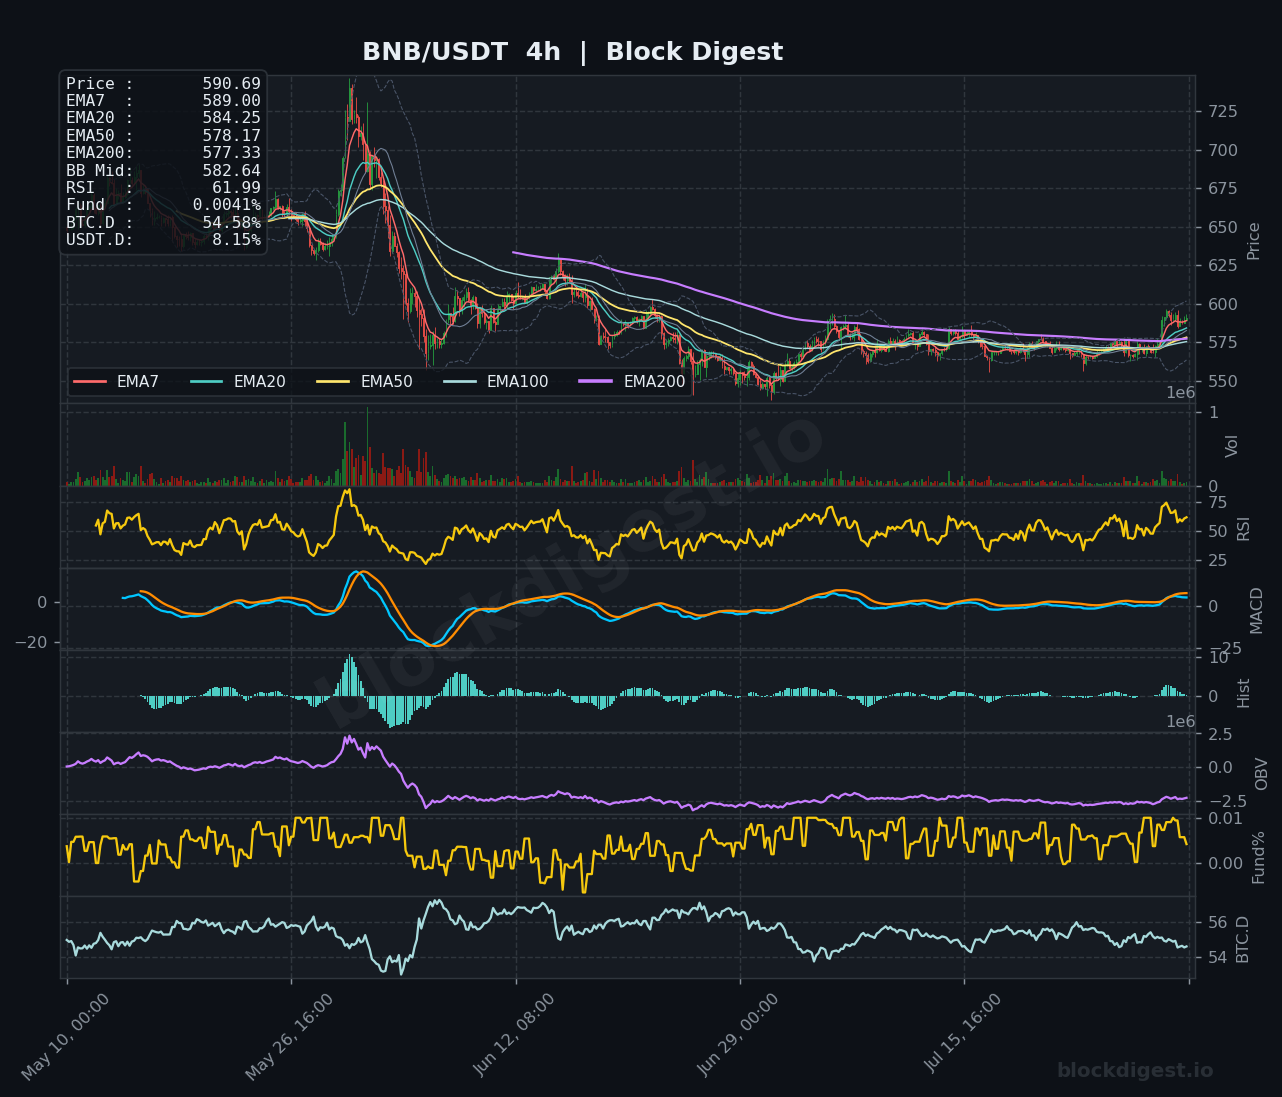
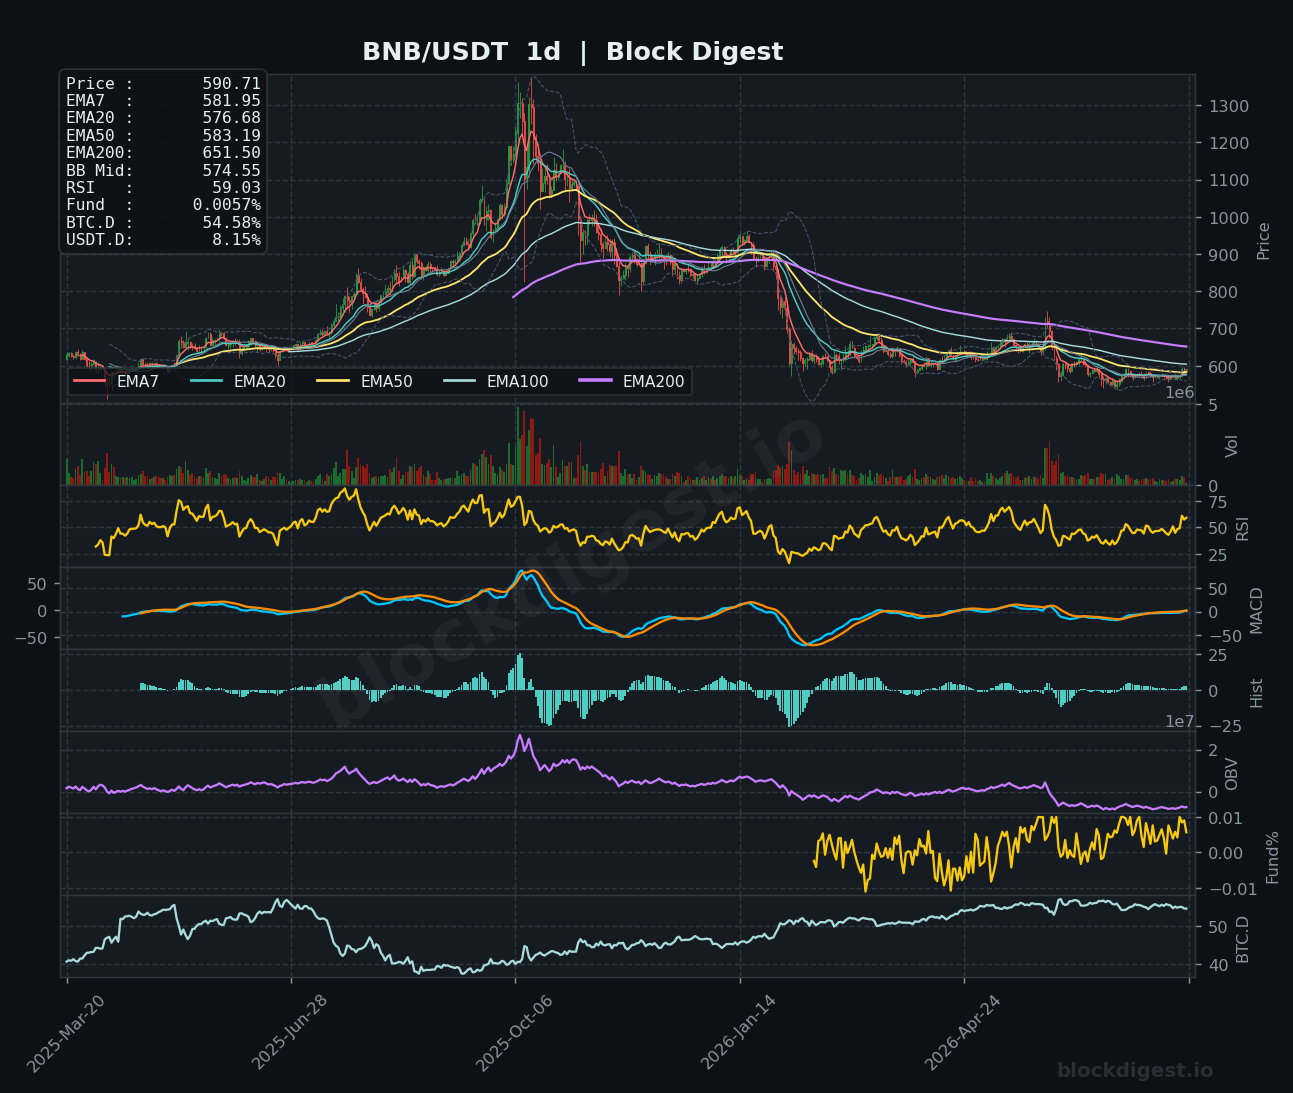
BNB stands out as the relative strength leader among today’s cohort, trading at $590.66 with its 1h RSI at 53.57 — the only asset in this roundup holding comfortably above the 50 midline. Price on the 1h chart has broken above its EMA cluster (EMA7: $590.72, EMA20: $589.89, EMA50: $587.25), with all short-term averages aligned bullishly beneath price for the first time in weeks. The 4h chart confirms improving momentum with RSI at 61.99 and MACD crossing positively, while the daily chart shows BNB attempting to recover from a prolonged correction, now pressing up against the EMA50 at $583.19 from below — a key level it appears to have just cleared. Resistance is clustered at $595–$600, and provided BNB holds above $585, the short-term bias is cautiously bullish, making it the single most constructive setup in today’s altcoin landscape.
Dogecoin (DOGE)
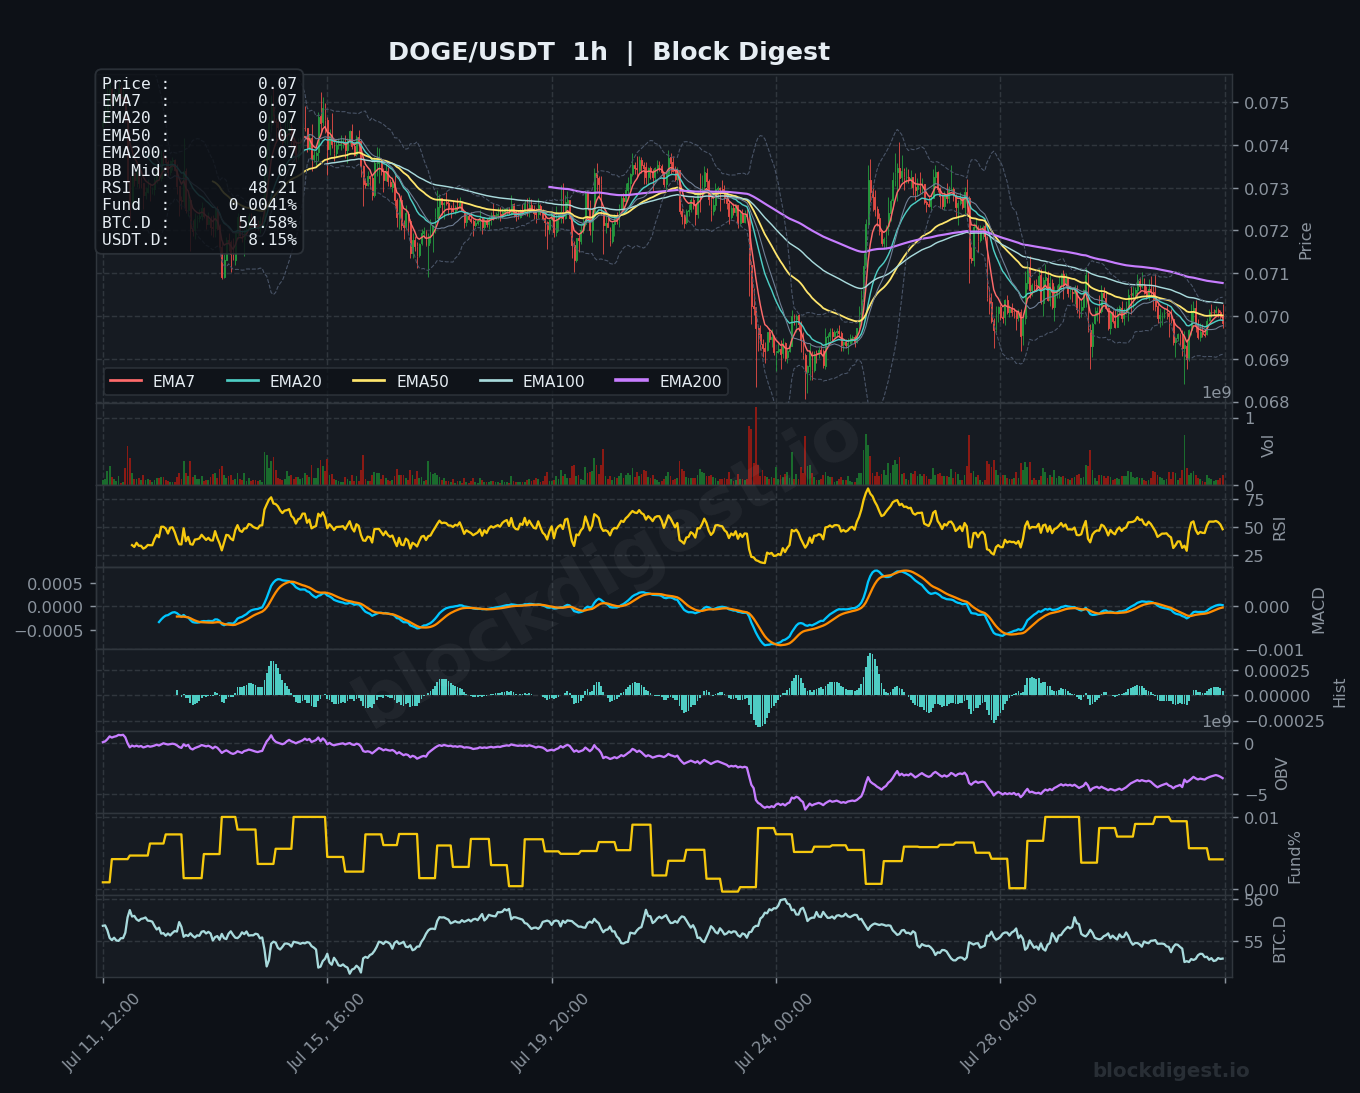
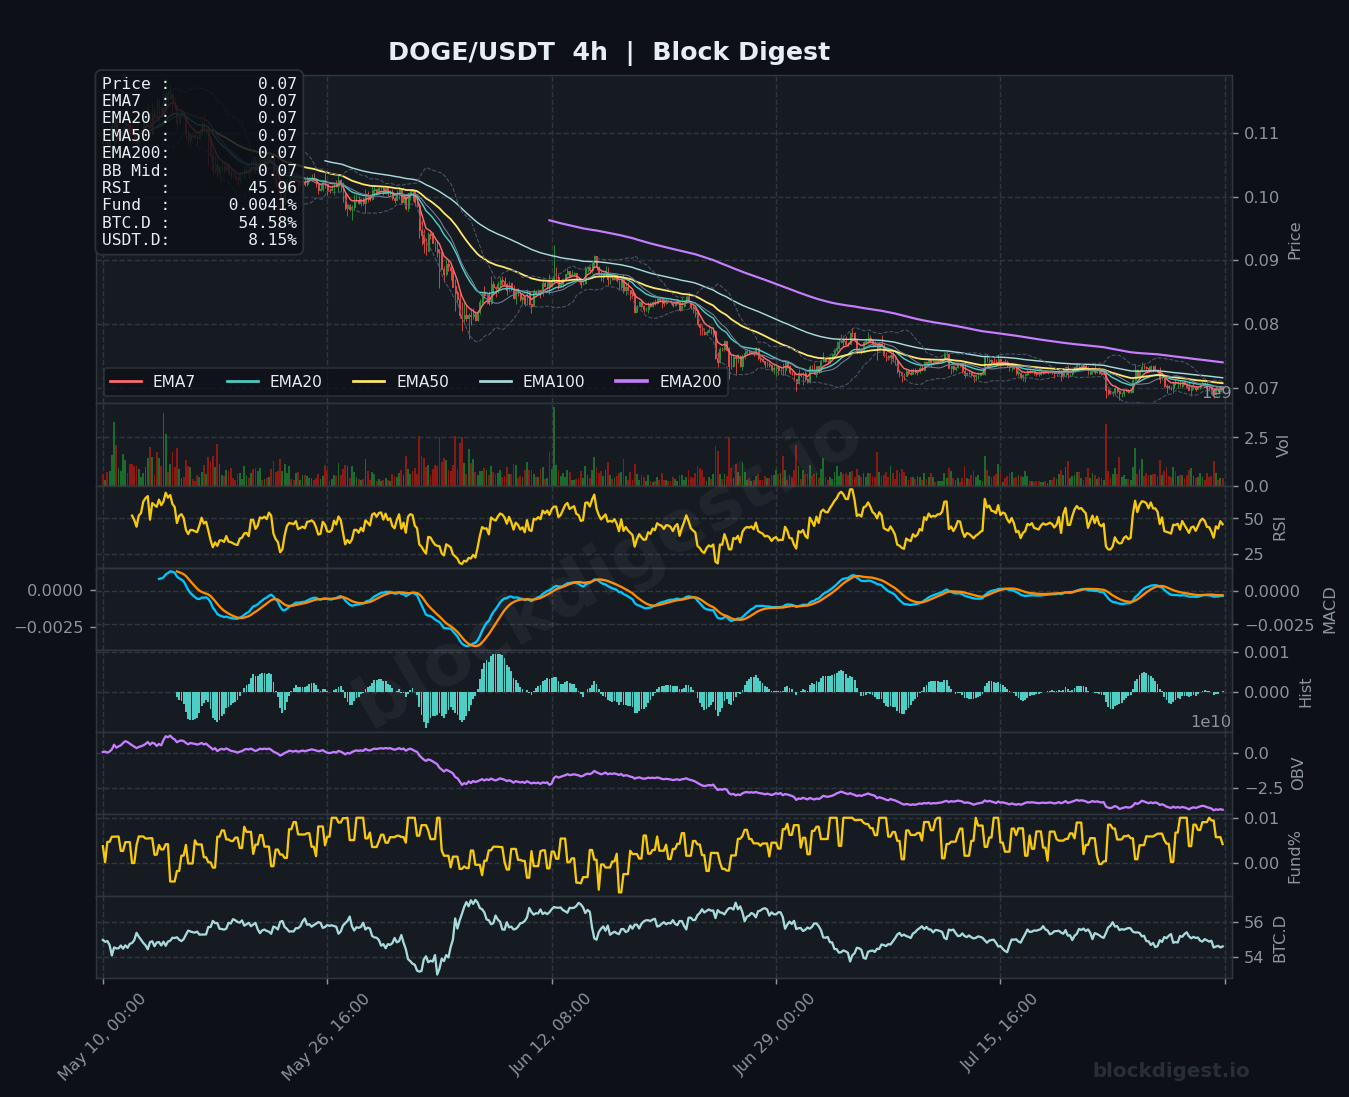
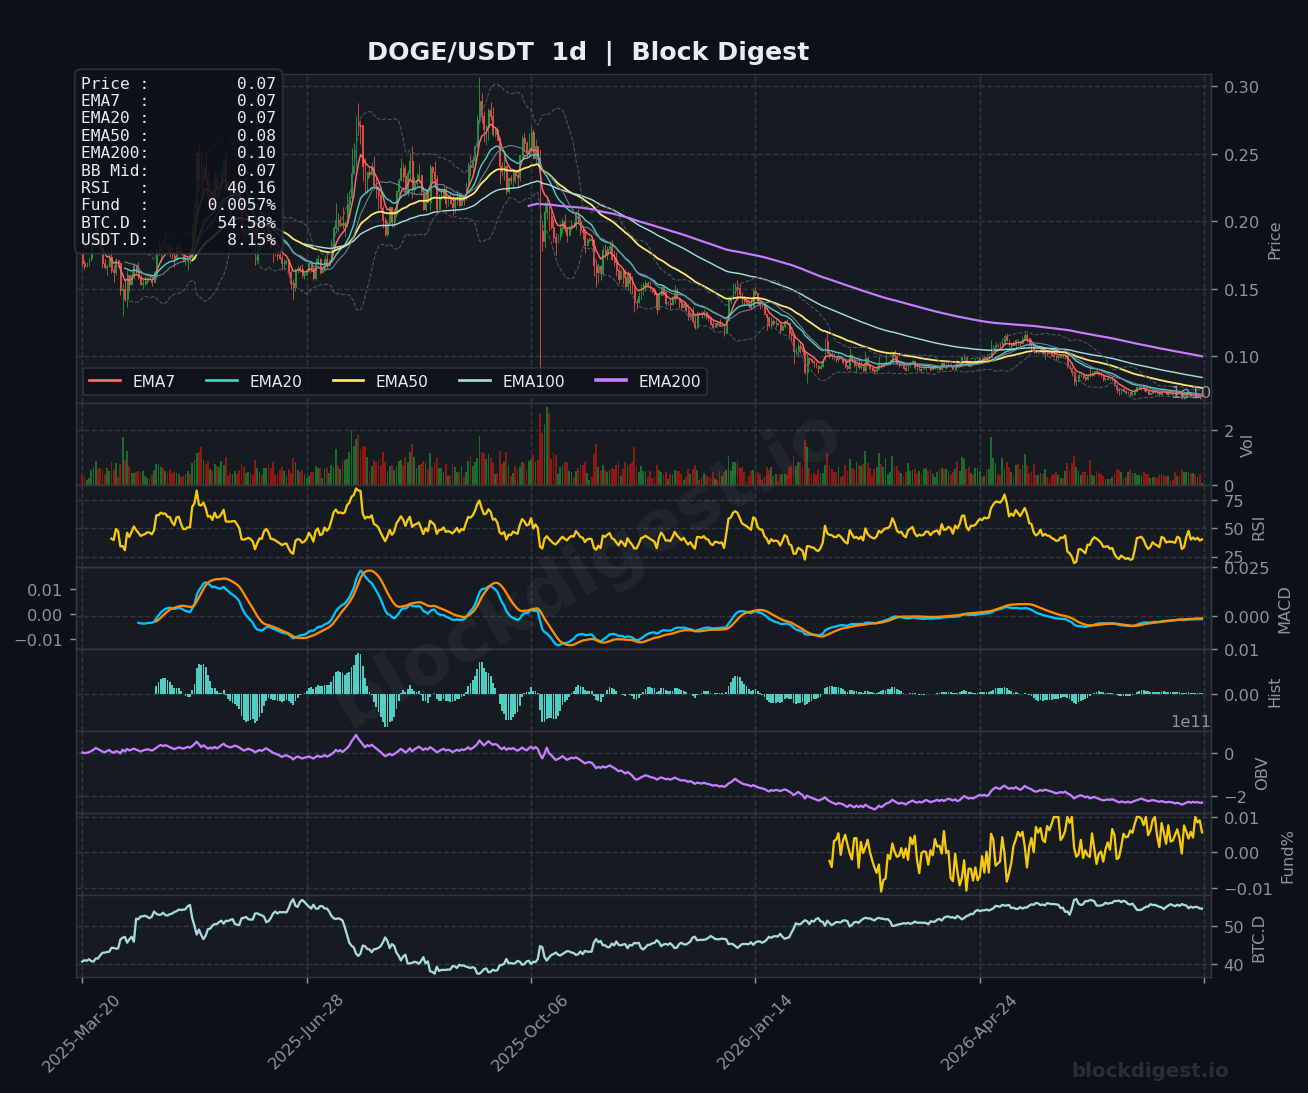
DOGE is trading at $0.070, compressed within a tight EMA cluster that reflects months of directionless price action following a significant decline from its prior highs above $0.25. The 1h RSI at 48.21 sits just below neutral, while the 4h RSI at 45.96 and daily RSI at 40.16 collectively point to weak and deteriorating momentum across timeframes. The daily chart is particularly concerning — price is trading below all major EMAs, with the EMA200 descending from $0.10, and OBV has trended steadily lower throughout the correction, confirming the absence of accumulation. With the MACD on the 4h barely recovering from negative territory and the daily histogram remaining subdued, the path of least resistance for DOGE remains to the downside; key support rests at $0.068–$0.069 with resistance at $0.072.
Litecoin (LTC)
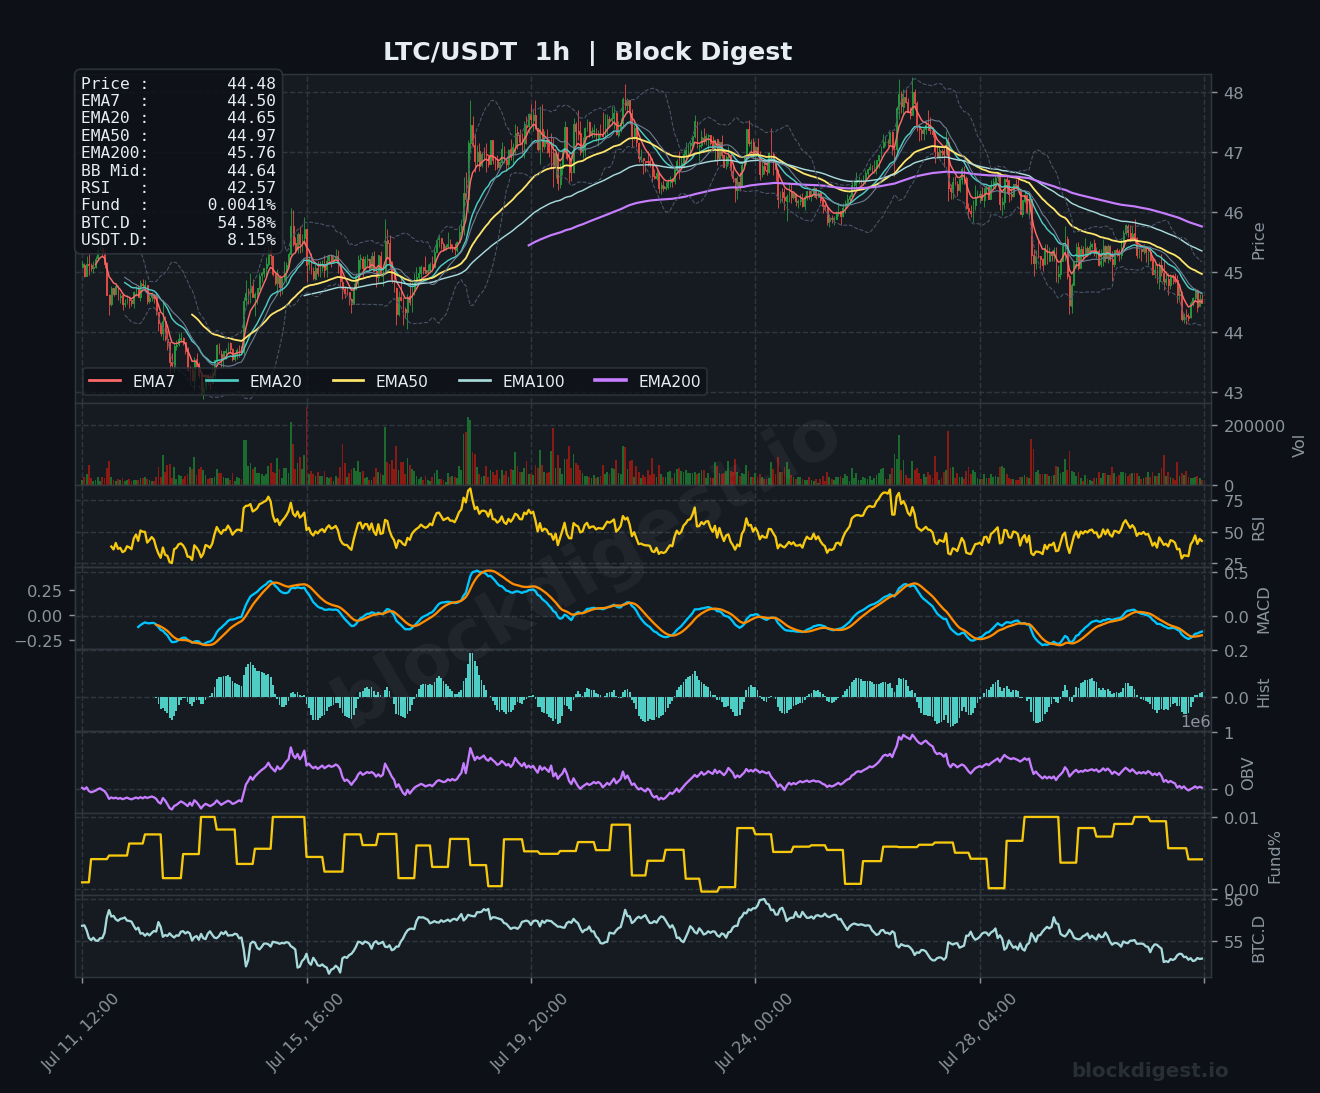
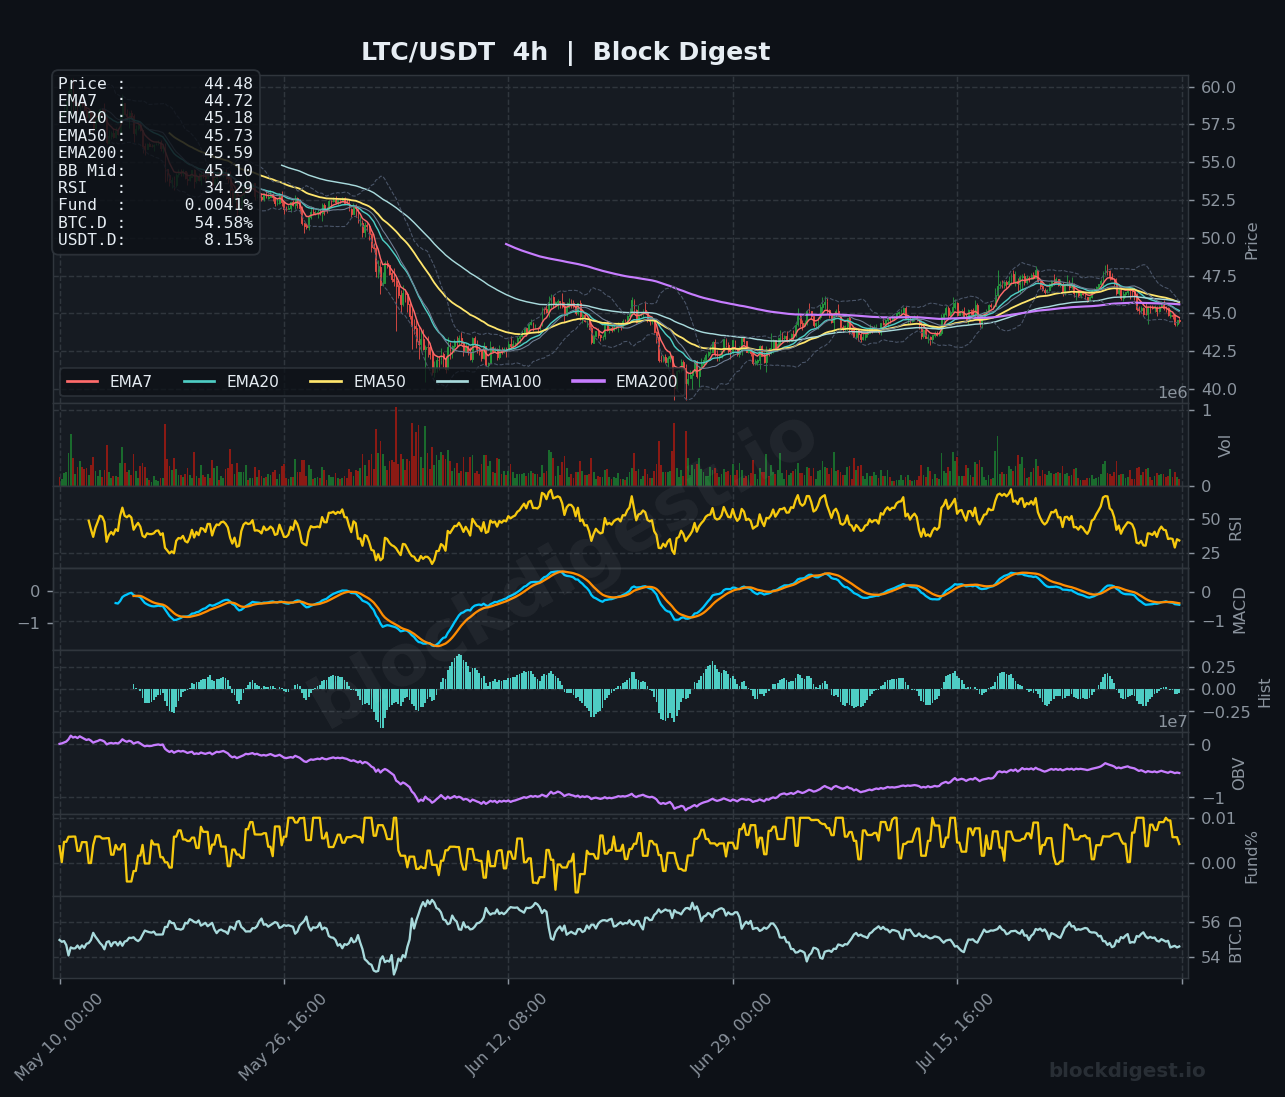
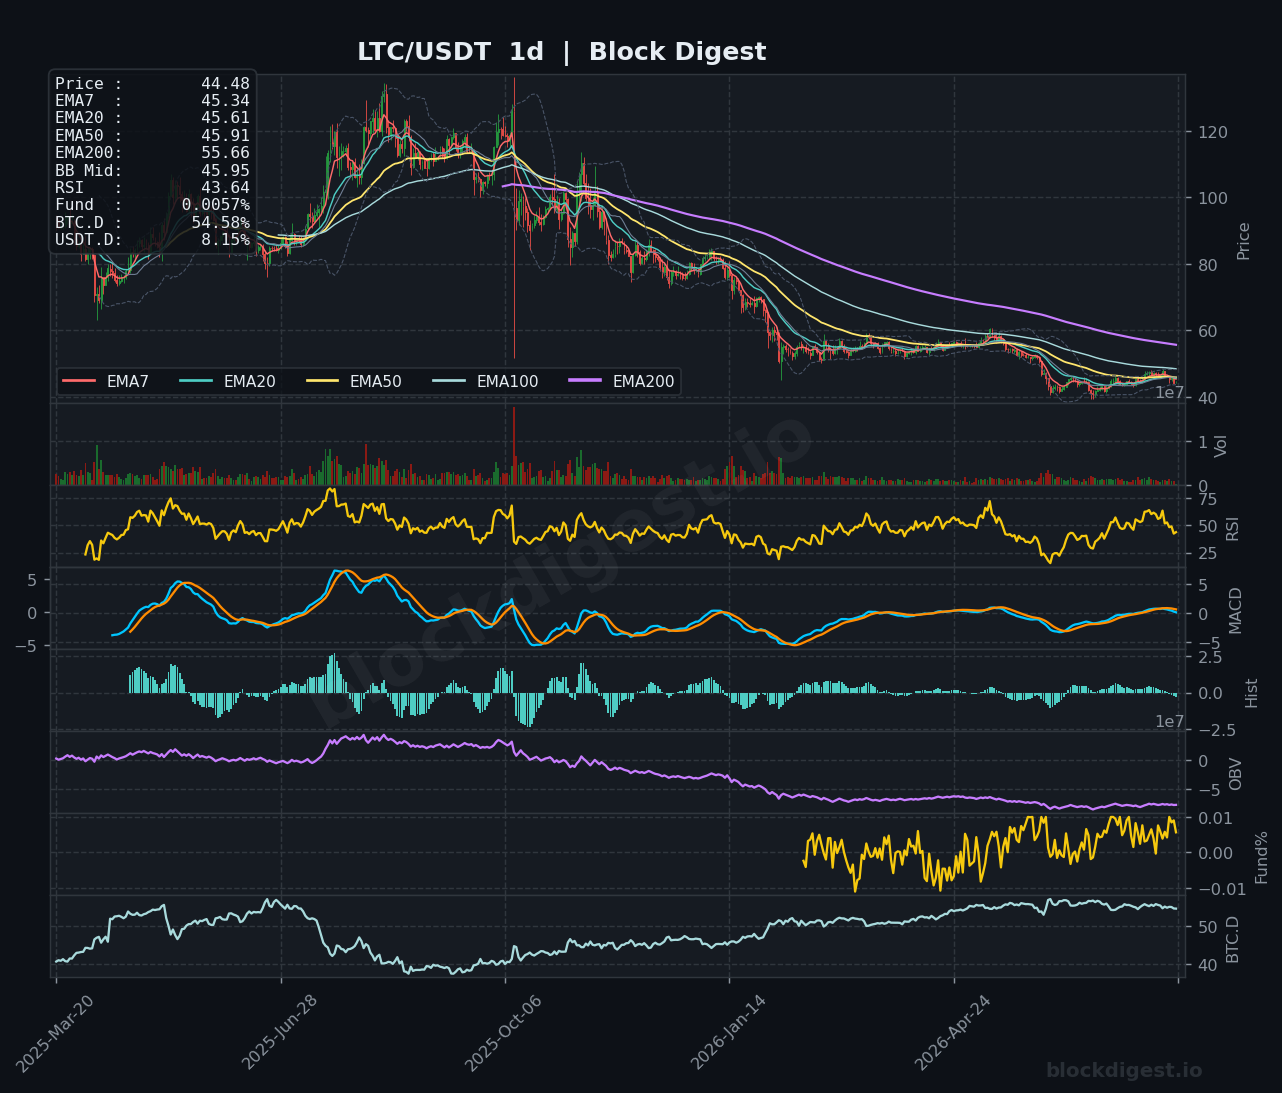
LTC is trading at $44.48, below all major moving averages on both the 1h (EMA200: $45.76) and the 4h (EMA200: $45.59, EMA50: $45.73), with the entire EMA structure sloping downward and acting as a layered resistance ceiling. The 4h RSI at 34.29 is approaching oversold territory but has yet to generate a meaningful bounce signal, and the MACD on that timeframe remains in negative territory with the signal line only just beginning to curl upward — a tentative development that requires confirmation. On the daily chart, LTC has been in an unbroken downtrend since its cycle peak above $120, with the OBV continuing to slide and the EMA200 at $55.66 well out of reach. The short-term bias is bearish; a reclaim of the $45.50–$46.00 zone would be the first signal worth monitoring, while a break below $43.50 would expose the next support shelf near $42.
TRON (TRX)
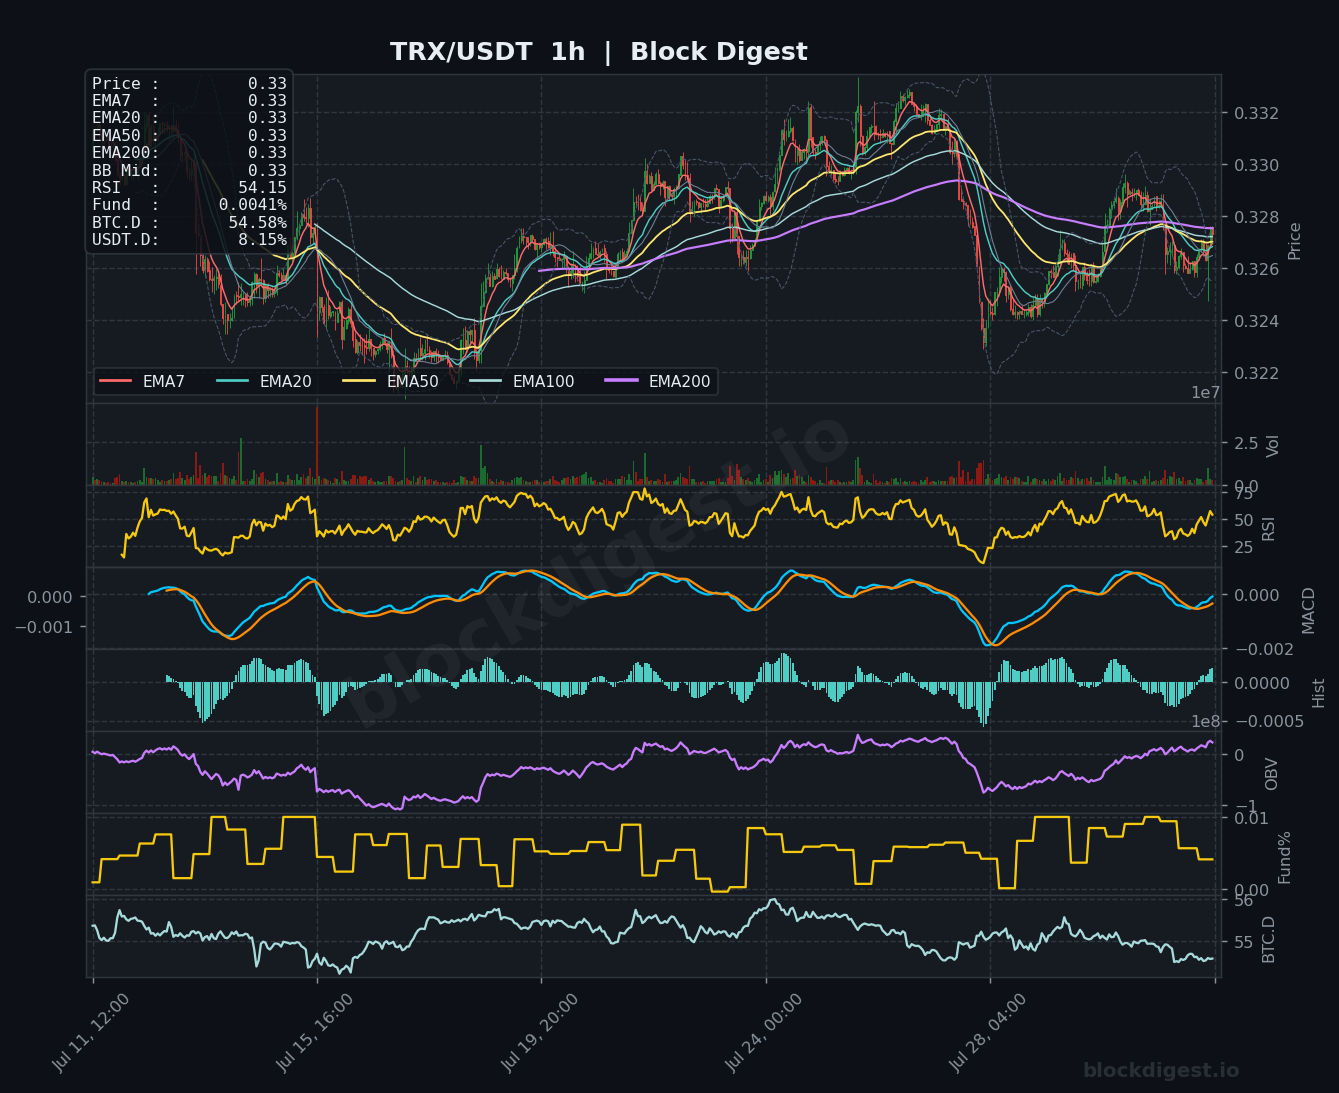
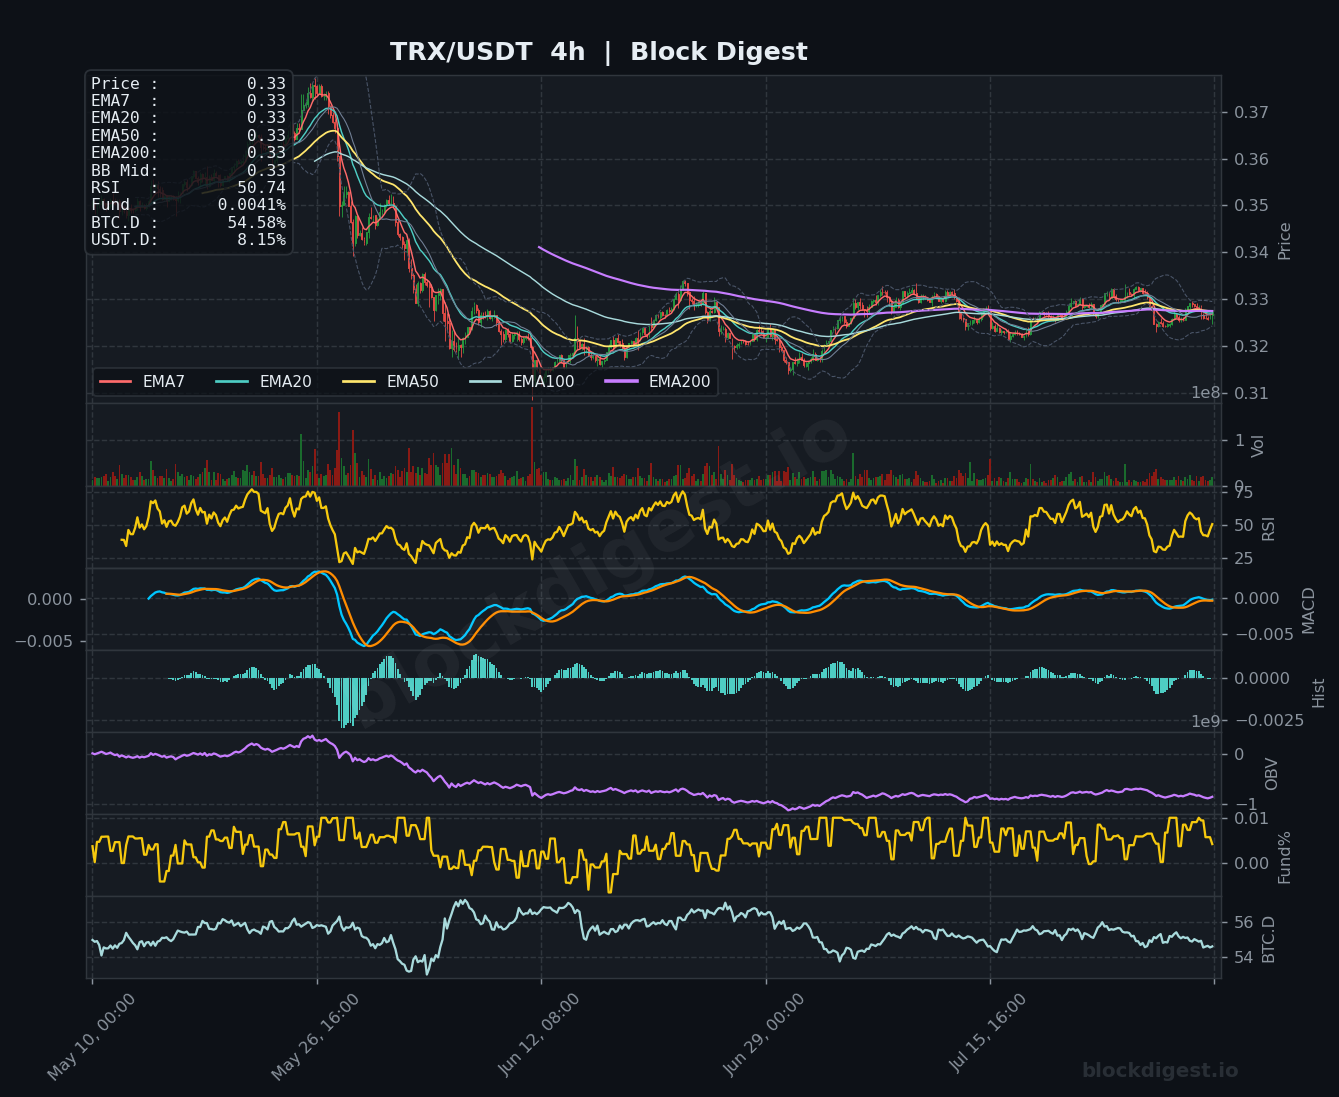
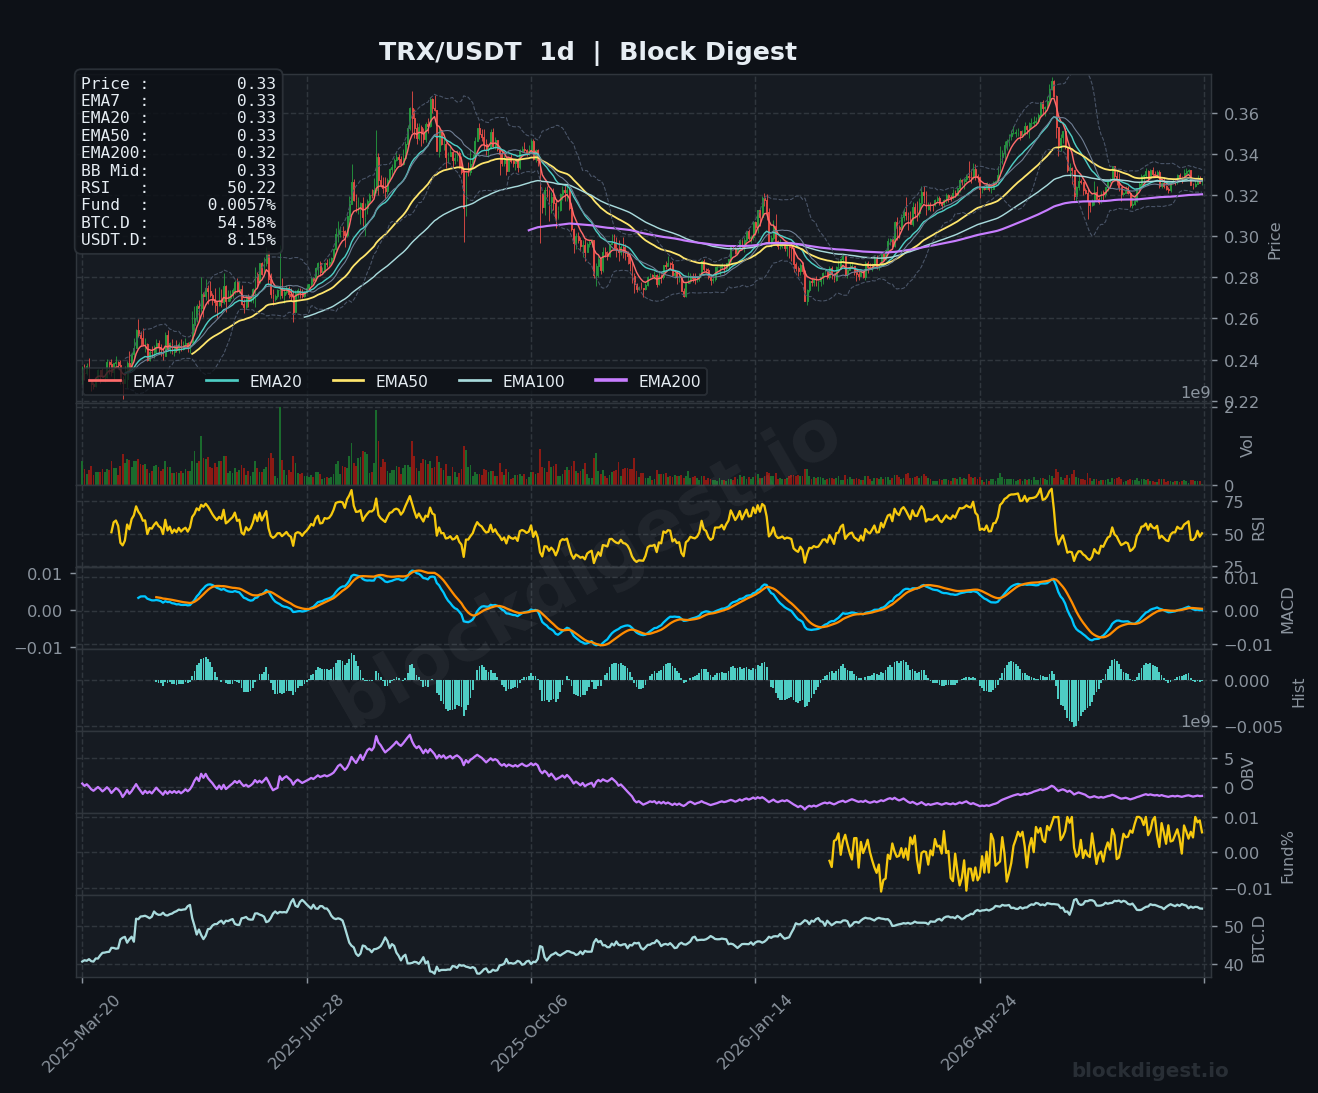
TRX is the most stable asset in today’s roundup from a structural standpoint, trading at $0.33 with all EMAs on the 1h tightly clustered at the same level — a reflection of genuine price consolidation rather than active trending. The daily chart tells a longer but more encouraging story relative to peers: TRX has maintained its EMA200 support (currently at $0.32), unlike most other alts, and the daily RSI at 50.22 sits right at the neutral midpoint, suggesting a market in balance. The 1h RSI at 54.15 and 4h RSI at 50.74 further reinforce this neutral-to-slightly-bullish short-term reading, and the 4h MACD is drifting near zero without a clear directional bias. Resistance sits at $0.332–$0.335 and support at $0.325–$0.326; the short-term bias is neutral with a slight bullish lean given TRX’s unique ability to hold its long-term moving average amid broad market weakness.
Altcoin Outlook
The overall altcoin setup for August 1st is bearish-to-neutral, with BNB and TRX the only assets displaying any relative technical resilience while SOL, XRP, LTC, and DOGE remain trapped below descending EMA structures with uninspiring momentum readings. Our BD Pulse Score of 24/100 is consistent with what the charts confirm: this is not an environment conducive to aggressive long positioning across the altcoin space, and the Long/Short Account Ratio of 2.21 — with 68.9% of accounts positioned long — suggests crowded positioning that could amplify downside if key supports fail. Traders should watch BNB’s ability to sustain above $585 as a bellwether for broader altcoin health, while a USDT.D rollover below 8% would be the clearest signal that risk appetite is returning. Until BTC dominance shows signs of topping and the BD Pulse Score recovers toward the 40–50 range, selective, disciplined positioning remains the prudent approach for the month ahead.
Disclaimer: This analysis is for informational purposes only and does not constitute financial advice. Cryptocurrency markets are highly volatile and unpredictable. All trading decisions should be made based on your own research and risk tolerance. Block Digest is not responsible for any financial losses incurred as a result of acting on this content.
Stay Ahead of the Market
Follow BlockDigest for crypto market intelligence, research and real-time updates.