ETH Daily Analysis — 2026-07-27 (Full Archive)
Market Overview
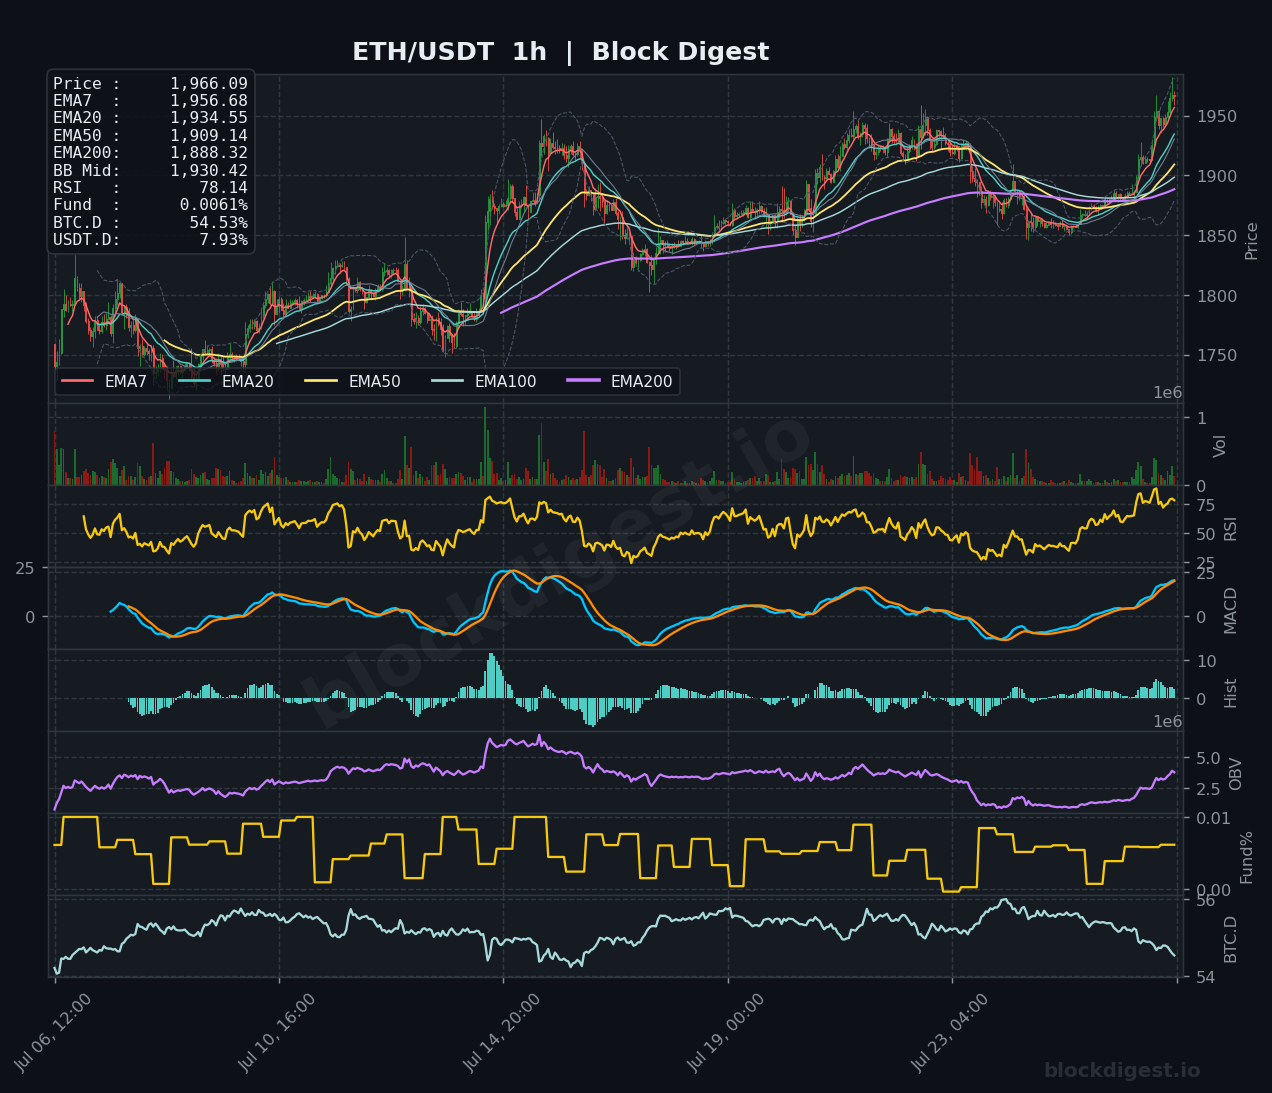
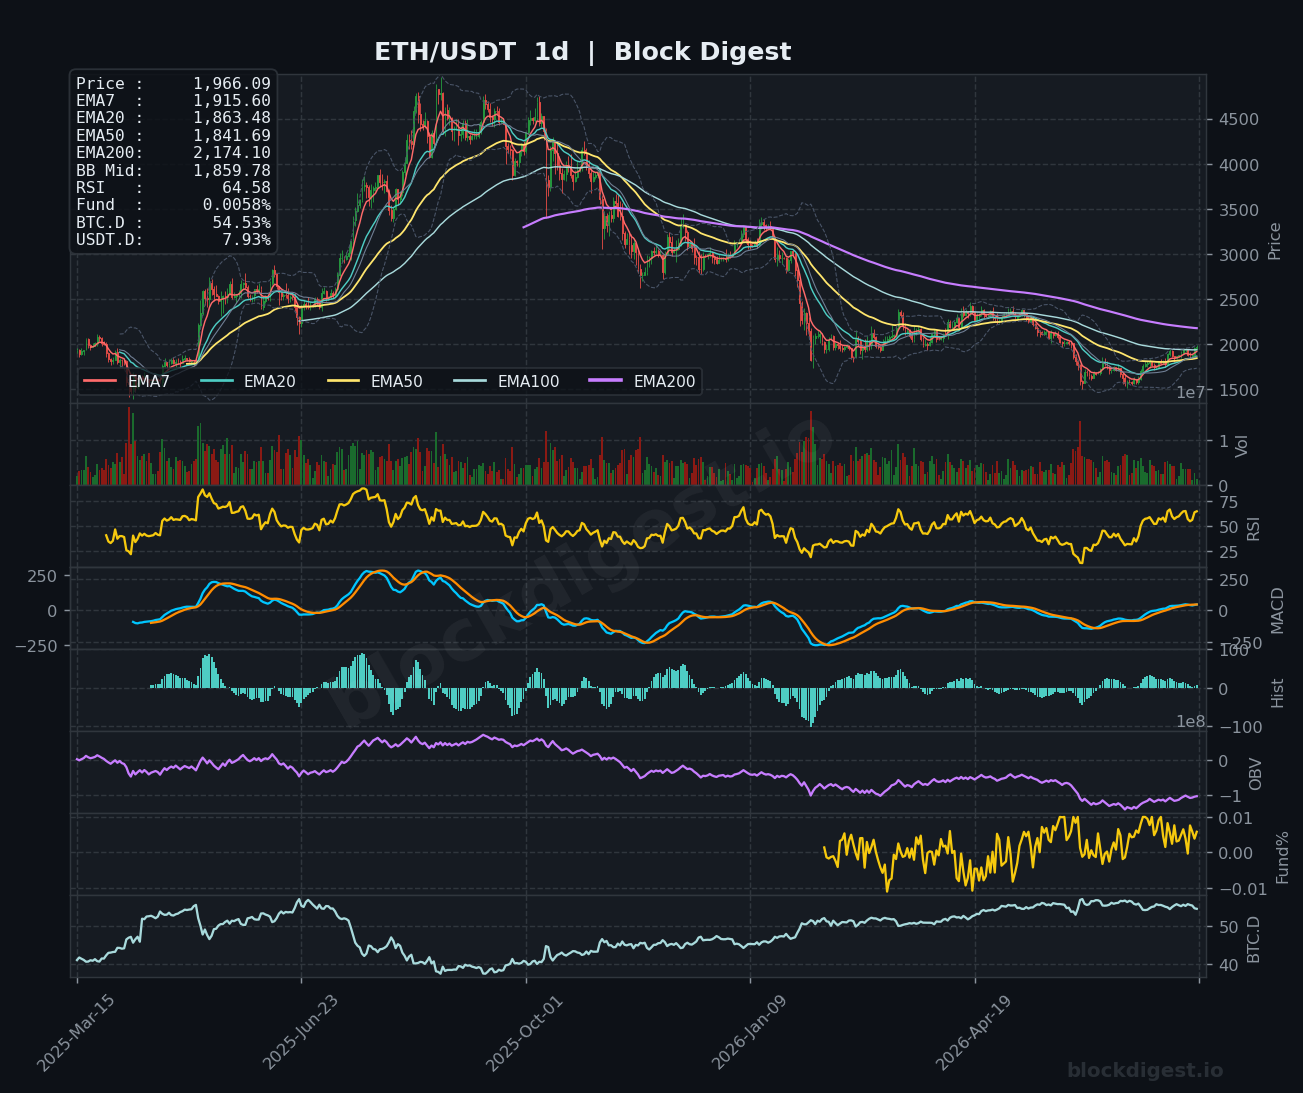
Ethereum is trading at $1,966.09, posting a meaningful recovery from its multi-month lows and currently sitting above all short-term EMAs on the 1-hour chart — with the EMA7 at $1,956.68, EMA20 at $1,934.55, and EMA50 at $1,909.14 all fanning upward beneath price. On the daily timeframe, ETH has broken above its BB midline ($1,859.78) and is now testing the upper Bollinger Band, reflecting a significant shift in momentum after an extended bear phase. The dominant daily structure remains a recovery off the cycle lows, though price is still trading well beneath the daily EMA200 at $2,174.10, which continues to act as the macro ceiling for any sustained bull case.
Multi-Timeframe Confluence
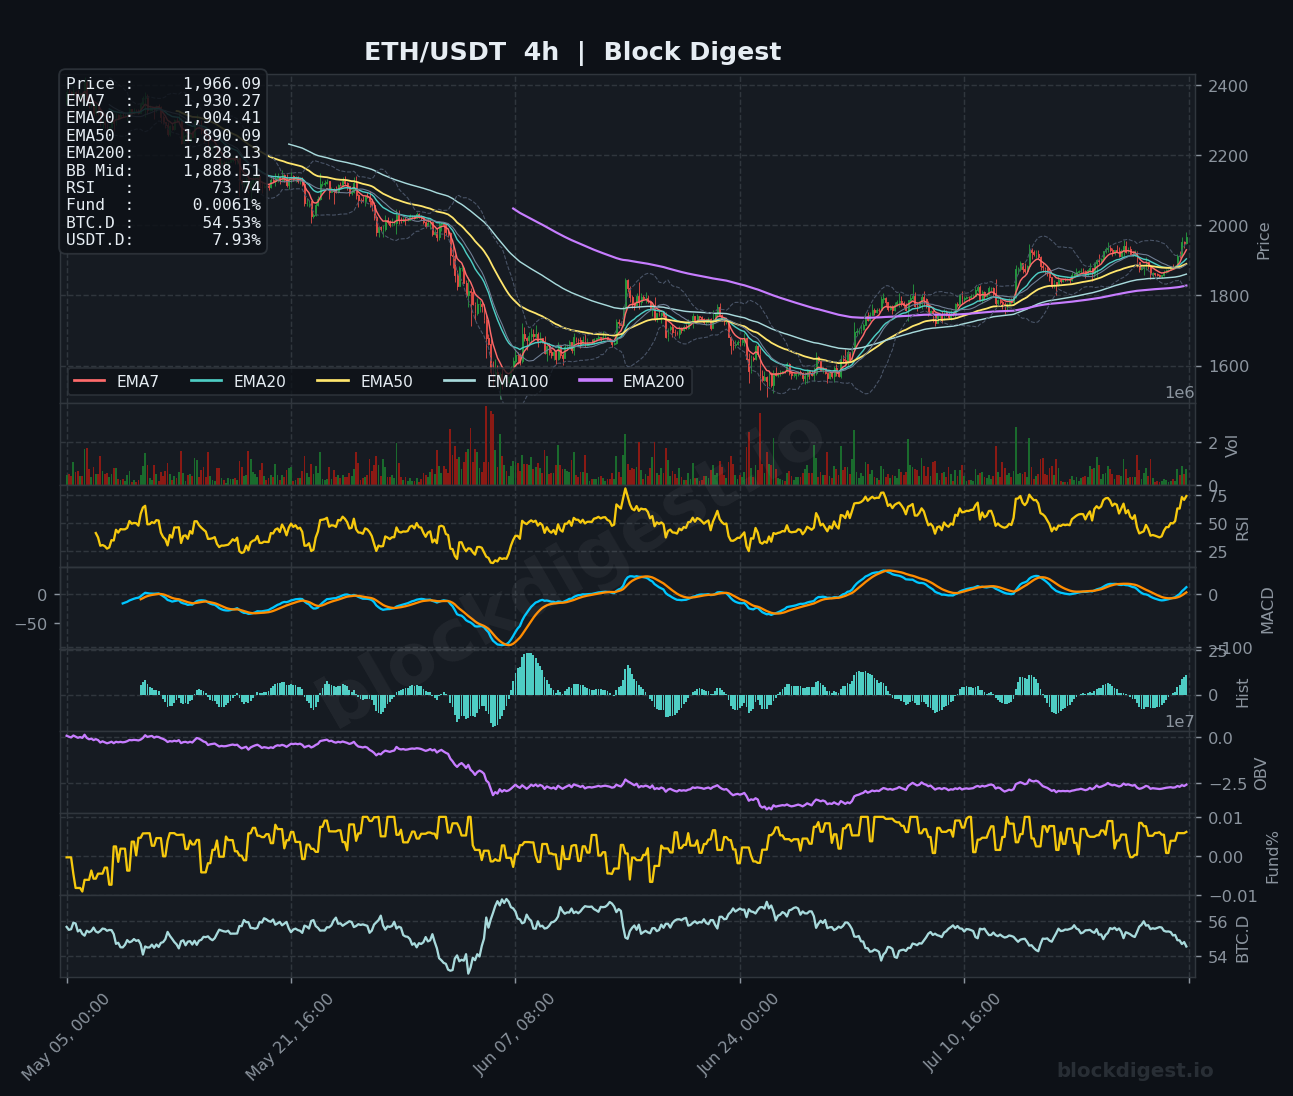
On the 1-hour chart, price is pushing the upper Bollinger Band with RSI at 78.14, indicating near-term overbought conditions that could invite a short-term pullback or consolidation. The 4-hour chart tells a more constructive story: price has cleared all major EMAs (EMA7 $1,930.27, EMA20 $1,904.41, EMA50 $1,890.09, EMA200 $1,828.13), with the RSI at 73.74 also elevated but the MACD histogram showing expanding positive bars — suggesting the 4H trend is intact and still accelerating. The daily timeframe confirms the broader recovery thesis, with RSI at 64.58 offering meaningful room before reaching overbought territory, and the MACD histogram turning firmly positive for the first time since the early-year downturn. Short-term overbought signals on lower timeframes slightly diverge from the higher timeframe momentum, suggesting intraday dips may present better entries rather than signaling a structural reversal.
Key Levels to Watch
Resistance:
- $1,980–$2,000: Psychological round number and upper Bollinger Band on the 1H chart; also a historically contested zone from previous consolidation ranges
- $2,050–$2,080: Structural resistance area visible on the 4H chart where price repeatedly failed during the prior downtrend
- $2,174.10: Daily EMA200, the most significant macro resistance level; reclaiming this on a closing basis would be a major structural milestone
Support:
- $1,930–$1,935: 1H EMA20 and recent breakout zone; first line of defense on any near-term pullback
- $1,888–$1,904: Confluence of the 4H EMA20 ($1,904.41) and 4H BB midline ($1,888.51); a deeper retest zone that should hold in a healthy bull continuation
- $1,828.13: 4H EMA200, the key higher-timeframe support that underpins the entire recovery structure
Momentum & On-Chain Signals
Block Digest’s BD Pulse Score currently reads 61/100 (Bullish), reflecting measured optimism without euphoria — consistent with a market in early-stage recovery rather than a speculative blow-off. The RSI on the daily (64.58) still has runway, though the 1H RSI at 78.14 and 4H at 73.74 both warrant caution for new entries at current levels. The MACD on the 4H is in a sustained bullish cross with a rising histogram, while the daily MACD signal lines are converging positively after an extended bearish phase — a potentially significant crossover in progress. The OBV trend on the 1H chart shows a renewed uptick after a brief dip, aligning with our BD Pulse OBV trend reading of +1, suggesting fresh accumulation is supporting this push rather than just short covering.
BTC Dominance & Market Sentiment
BTC dominance sits at 54.58% according to BD Pulse data (reflected as 54.53% on the charts), a level that has been trending gently lower in recent sessions — a modestly favorable signal for altcoin rotation, including ETH. USDT.D at 7.93% remains relatively contained, suggesting sidelined capital hasn’t made a dramatic flight to safety, which supports the cautious risk-on tone. With Ether ETFs reportedly drawing nearly proportional inflows relative to Bitcoin ETFs despite a fraction of the net assets, demand for ETH exposure specifically appears to be outpacing broader market expectations.
Risk Scenarios
Bullish case: A clean hourly close above $2,000 on strong volume would confirm the psychological breakout, opening a path toward $2,050–$2,080 in the near term, with the ultimate target being a test of the daily EMA200 at $2,174.10 over the following week. Progress on the Digital Asset Market Clarity Act before the Senate recess could serve as an additional catalyst to sustain institutional inflows.
Bearish case: Failure to hold $1,930 on a 4H closing basis would signal that the current push was a liquidity grab, shifting focus back toward the $1,888–$1,828 support band. A breakdown below $1,828 (4H EMA200) would invalidate the recovery thesis entirely and reopen risk toward the mid-$1,700s.
Outlook
ETH’s setup heading into July 27 is cautiously constructive: the daily trend has turned bullish for the first time in months, multi-timeframe EMA structures are aligned to the upside, and on-chain signals via BD Pulse support continued accumulation. However, the near-term risk of a short-term cooldown is real given overbought 1H and 4H RSI readings, and the $2,000 psychological level combined with the upper Bollinger Band could cap immediate upside. The critical triggers to watch in the next 24–48 hours are a sustained close above $2,000 for bull confirmation, or a loss of $1,930 that would warrant reassessing near-term momentum. As long as ETH holds above $1,888–$1,904 on any pullback, the higher-timeframe recovery structure remains intact and dips should be viewed as potential opportunities rather than reversal signals.
—
Disclaimer: This analysis is for informational purposes only and does not constitute financial advice. Cryptocurrency markets are highly volatile and unpredictable. All trading decisions should be made based on your own research and risk tolerance. Block Digest is not responsible for any financial losses incurred as a result of acting on this content.