BTC Weekly Analysis — Week of May 04, 2026
BTC Weekly Analysis – Week of May 04, 2026
Weekly Market Overview
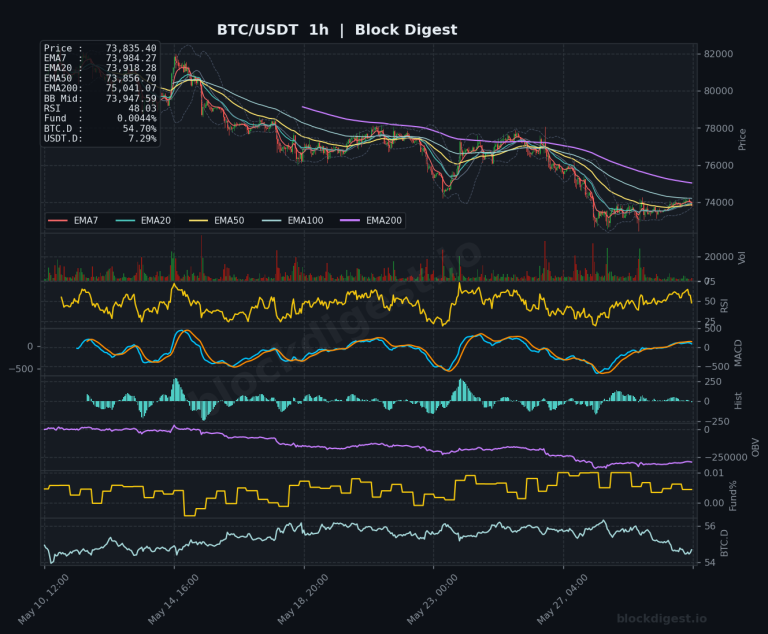
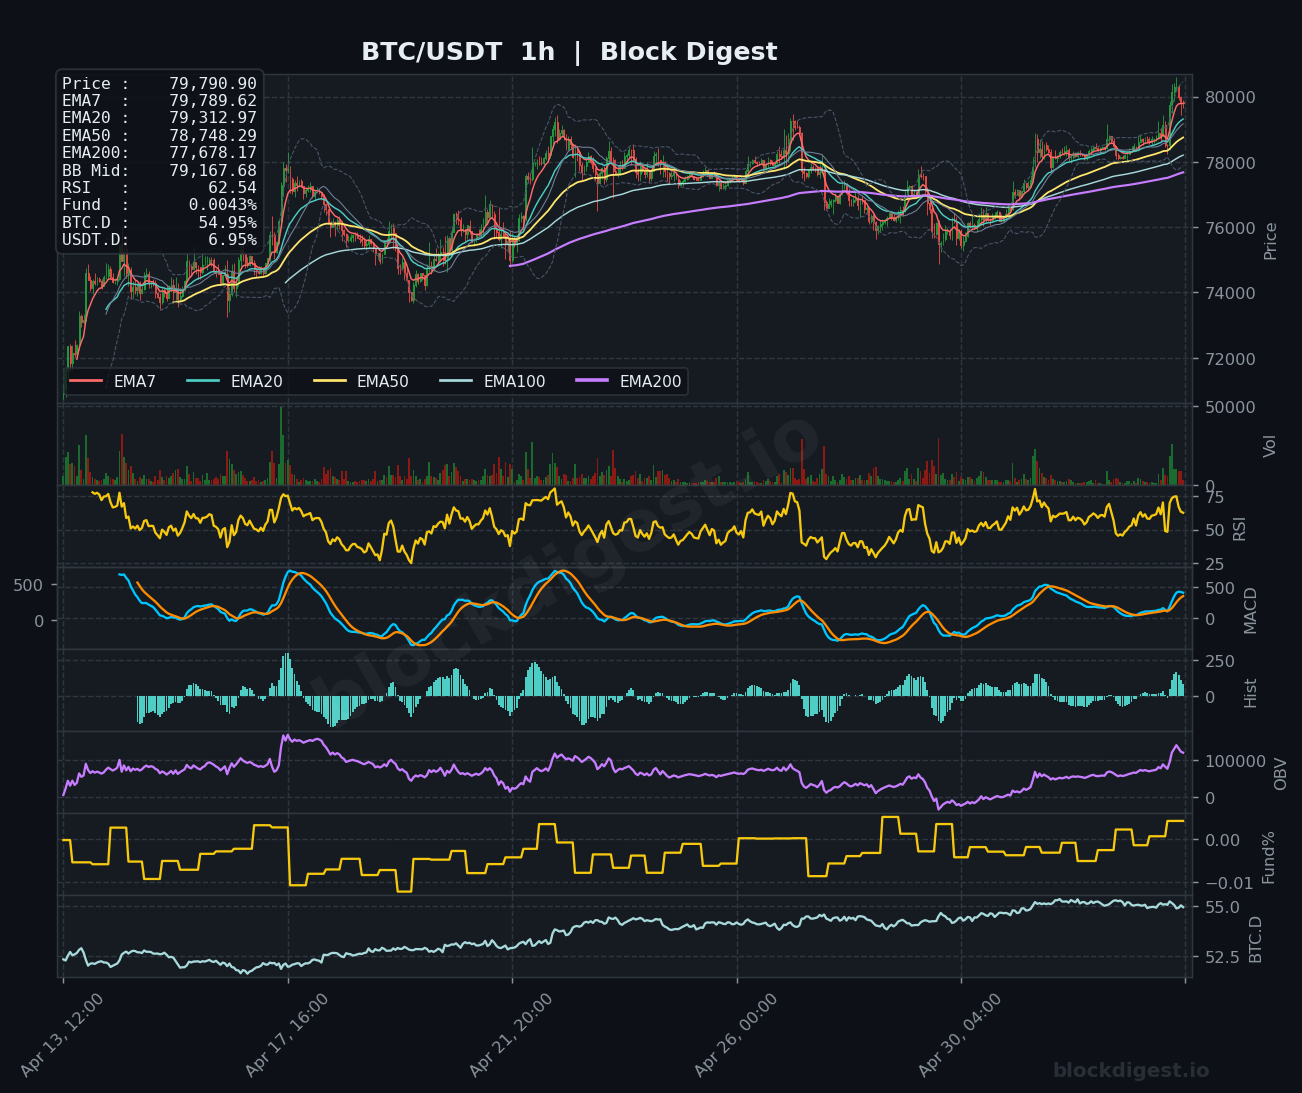
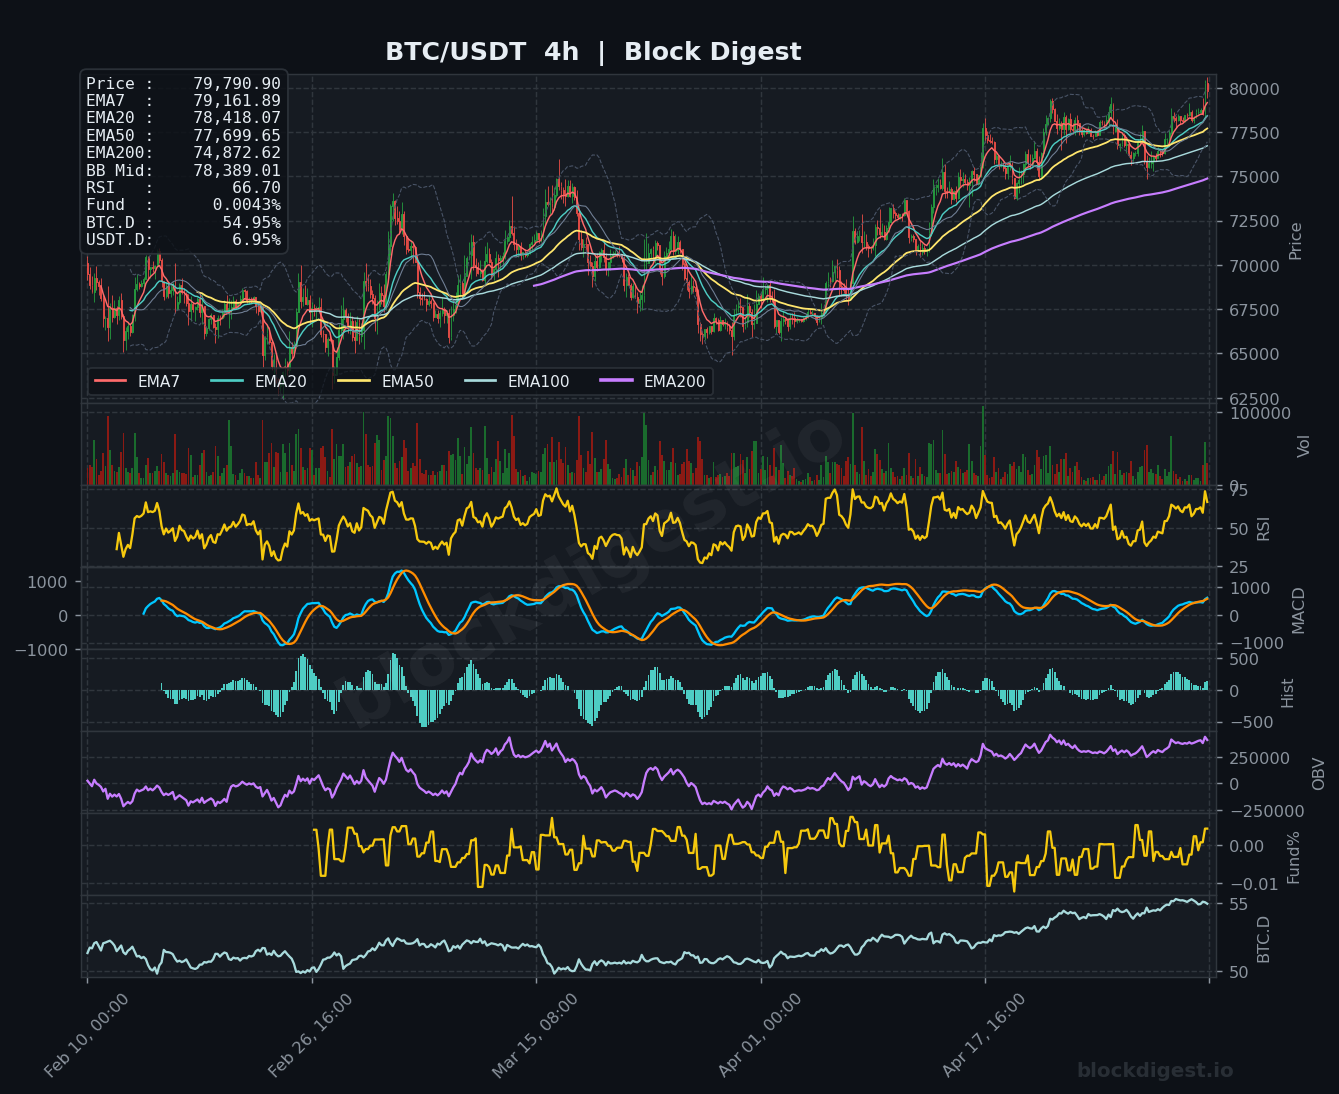
Bitcoin closed the week at $79,790, consolidating above a critical structural pivot after an impressive recovery from multi-month lows. The weekly candle formation shows a tight-range consolidation with price holding firmly above the $76,000-$78,000 support zone, suggesting potential accumulation before the next directional move. The current weekly structure indicates BTC is attempting to establish a higher low pattern following the sharp correction from the $100,000+ highs earlier in the cycle. This week’s price action demonstrates resilience as bulls defend key support levels while facing significant overhead resistance.
Higher Timeframe Structure
On the weekly timeframe, Bitcoin remains in a precarious position below all major EMAs except the EMA7 ($75,607), which price has reclaimed. The EMA20 ($78,126) and EMA50 ($85,715) continue to provide dynamic resistance overhead, while the EMA200 ($68,953) offers long-term support from below. Price is trading within the lower half of the weekly Bollinger Bands (Mid: $76,146), indicating the macro trend remains under pressure despite recent stabilization. The weekly RSI at 48.67 suggests neutral momentum with room to move in either direction, while the broader structure shows BTC attempting to build a base following the corrective phase from the cycle highs near $120,000 seen in historical data.
Multi-Timeframe Confluence
Multi-timeframe analysis reveals improving alignment as the 1-hour and 4-hour charts show bullish EMA crossovers with price trading above all short-term moving averages, while the daily timeframe has recovered above its EMA7 ($78,229) and EMA20 ($76,604). However, the weekly timeframe remains the primary constraint, with price still capped below the weekly EMA20 at $78,126. Confluent support exists at the $76,000-$77,000 zone where the weekly Bollinger Band midpoint, daily EMA50, and 4-hour EMA200 converge. The intraweek momentum surge visible on lower timeframes has yet to translate into a decisive weekly breakout, suggesting the macro structure requires more time to resolve.
Key Weekly Levels
Weekly Resistance:
- $82,200-$82,500 – Daily EMA200 and prior consolidation zone; reclaiming this level would signal trend reversal on daily timeframe
- $85,700-$86,000 – Weekly EMA50 confluence with historical resistance; critical macro level for bull market continuation
- $90,000-$92,000 – Psychological level and volume shelf from previous consolidation; break above confirms higher timeframe trend change
Weekly Support:
- $76,000-$77,000 – Weekly Bollinger Band midpoint and clustered daily/4h EMAs; primary defensive zone for bulls
- $74,000-$74,500 – Daily EMA50 and prior swing low; loss of this level would invalidate the higher low structure
- $68,900-$69,000 – Weekly EMA200 and major psychological support; final defense before deeper correction toward $60,000 range
Momentum & Volume Analysis
Weekly RSI at 48.67 shows neutral positioning after bouncing from deeply oversold conditions, leaving ample room for upside expansion without immediate overbought concerns. The weekly MACD remains in bearish territory but shows early signs of convergence, suggesting diminishing bearish momentum. On the daily timeframe, RSI at 65.14 indicates building bullish momentum, while the 4-hour RSI at 66.70 suggests near-term conditions are warm but not extended. OBV on the weekly chart shows stabilization after prolonged decline, though volume needs to increase significantly to confirm accumulation. The Funding Rate at 0.0043% indicates a neutral-to-slightly-bullish perpetual futures market with minimal leverage imbalance, suggesting spot-driven price action rather than overleveraged positioning that could lead to cascading liquidations.
BTC Dominance & Altcoin Implications
Bitcoin Dominance currently sits at 54.95%, maintaining elevated levels that typically coincide with risk-off behavior in crypto markets or BTC consolidation phases. The sustained high dominance suggests capital remains concentrated in BTC rather than rotating into altcoins, indicating broader market participants await clear directional resolution before deploying risk capital. USDT Dominance at 6.95% shows stable stablecoin positioning, neither signaling aggressive accumulation nor panic selling. This dominance structure implies that any BTC breakout above $82,000-$85,000 could trigger capital rotation into altcoins, potentially initiating an “alt season,” while breakdown below $74,000 would likely see dominance spike further as capital seeks safety in BTC or exits to stablecoins entirely.
Risk Scenarios
Bull case: A decisive weekly close above $82,000-$82,500 would reclaim the daily EMA200 and trigger a structural shift toward bullish continuation. This scenario requires sustained volume above 150,000 BTC per day and funding rates remaining positive but below 0.01% to avoid overleveraged conditions. Target progression would see initial resistance at $85,700 (weekly EMA50), followed by $92,000 and eventually a retest of the $100,000 psychological level. A golden cross of weekly EMA50 above EMA200 would confirm macro trend reversal with targets extending toward new cycle highs.
Bear case: Failure to hold the $76,000-$77,000 support zone would invalidate the higher low structure and expose the $74,000 level, with breakdown below triggering cascading stops toward the weekly EMA200 at $68,900. This scenario would likely see daily RSI collapse back below 40, weekly MACD extend deeper into bearish territory, and BTC dominance spike above 58% as altcoins suffer disproportionate losses. Ultimate downside targets would include the $65,000-$60,000 range representing the 0.618 Fibonacci retracement of the entire bull cycle advance.
Weekly Outlook
The week ahead presents a critical juncture for Bitcoin as price consolidates at the intersection of competing macro forces. The bias slightly favors continuation of the recovery attempt given improving daily and 4-hour momentum, reclaimed short-term EMAs, and neutral funding rates suggesting sustainable spot-driven demand. However, traders should monitor the $78,000-$78,500 resistance zone closely, as this represents the confluence of weekly EMA20 and daily EMA7, making it the near-term battleground for directional control. Key catalysts include any macro liquidity events, institutional flow data, and ETF activity which could provide the momentum needed for a weekly EMA breakout. The optimal risk/reward setup favors waiting for either a confirmed break above $82,000 with volume for long entries or a breakdown below $76,000 for short positions. Until weekly structure provides clear resolution, range-bound trading between $76,000-$82,000 remains most probable, with the ultimate weekly close determining May’s trajectory.
Disclaimer: This analysis is for informational purposes only and does not constitute financial advice. Cryptocurrency markets are highly volatile and unpredictable. All trading decisions should be made based on your own research and risk tolerance. Block Digest is not responsible for any financial losses incurred as a result of acting on this content.