Bitcoin Daily Technical Analysis
Market Overview
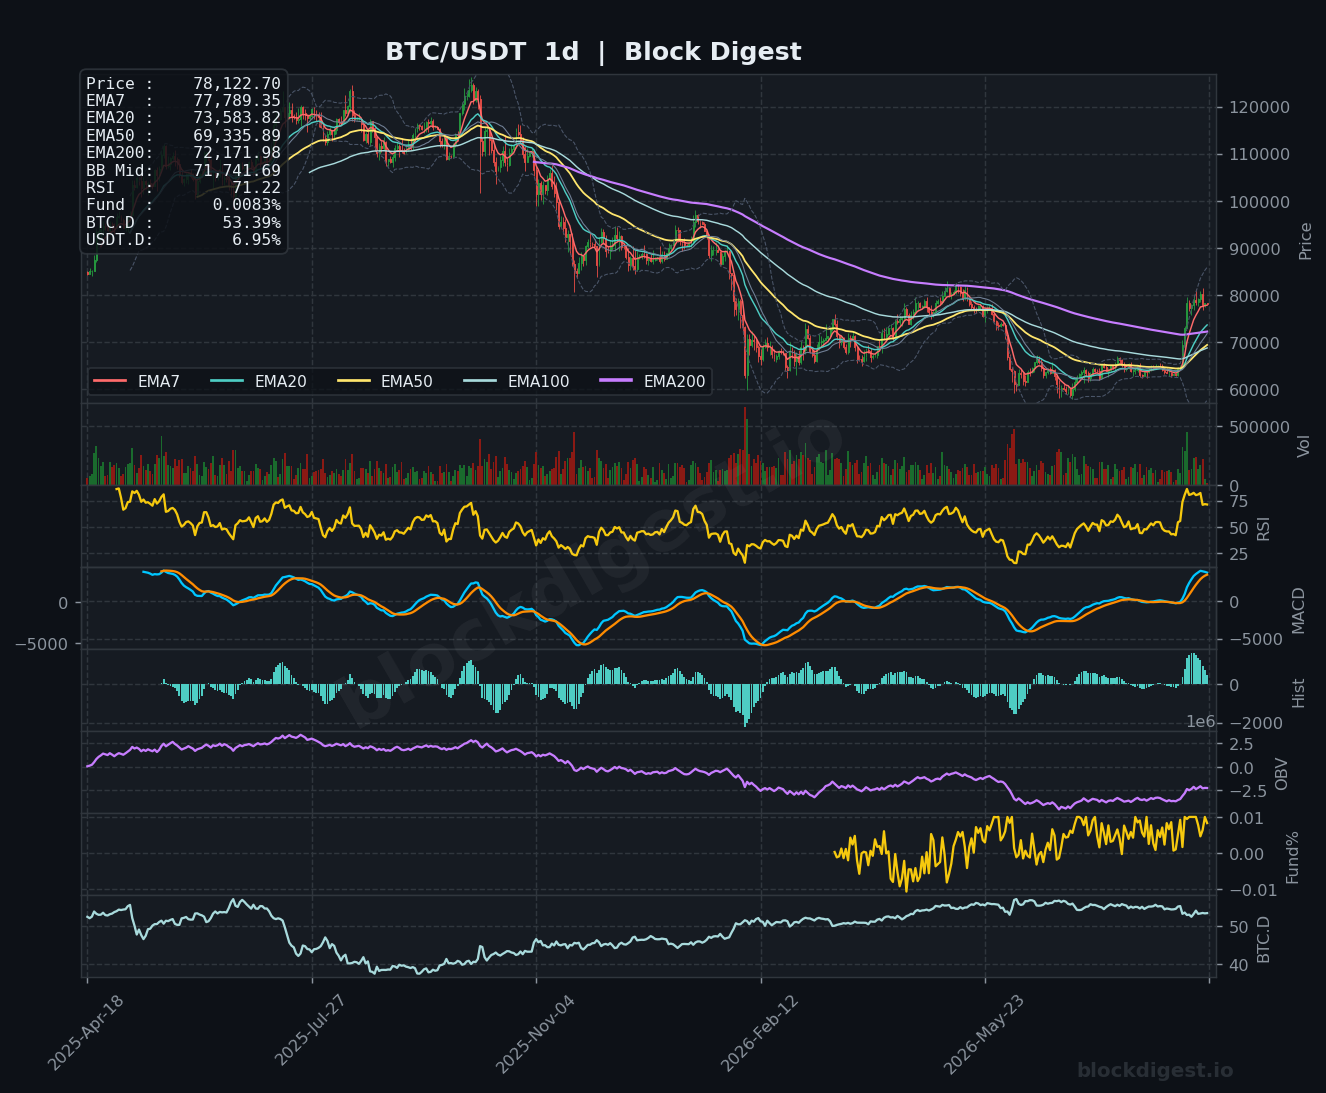
Bitcoin is currently exhibiting strong bullish momentum, trading at $78,122.70, which places it comfortably above all major daily EMAs. The price action is consolidating near the daily Bollinger Band mid-line of $71,741.69, having recently reclaimed key structural levels. The daily trend remains firmly upward, supported by a constructive alignment of short-term EMAs over longer-term averages, signaling a robust recovery phase.
Multi-Timeframe Confluence
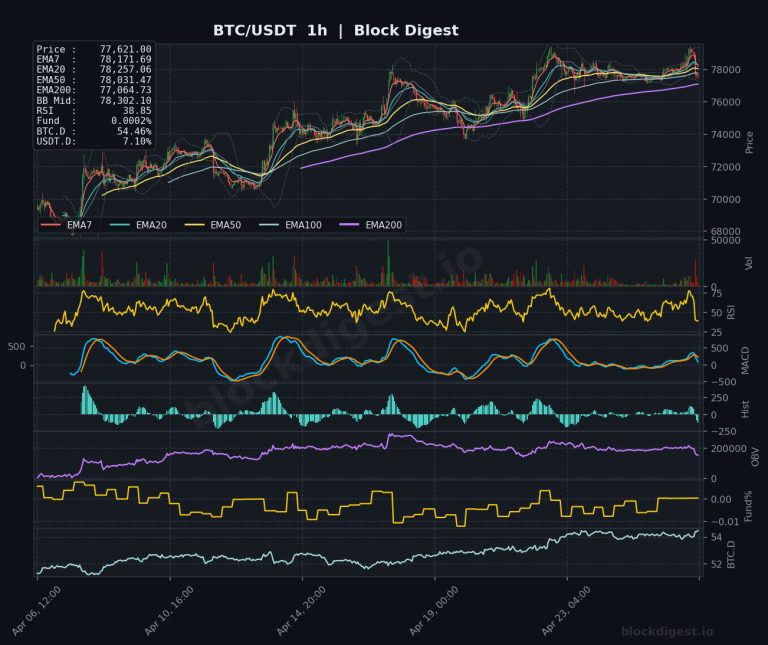
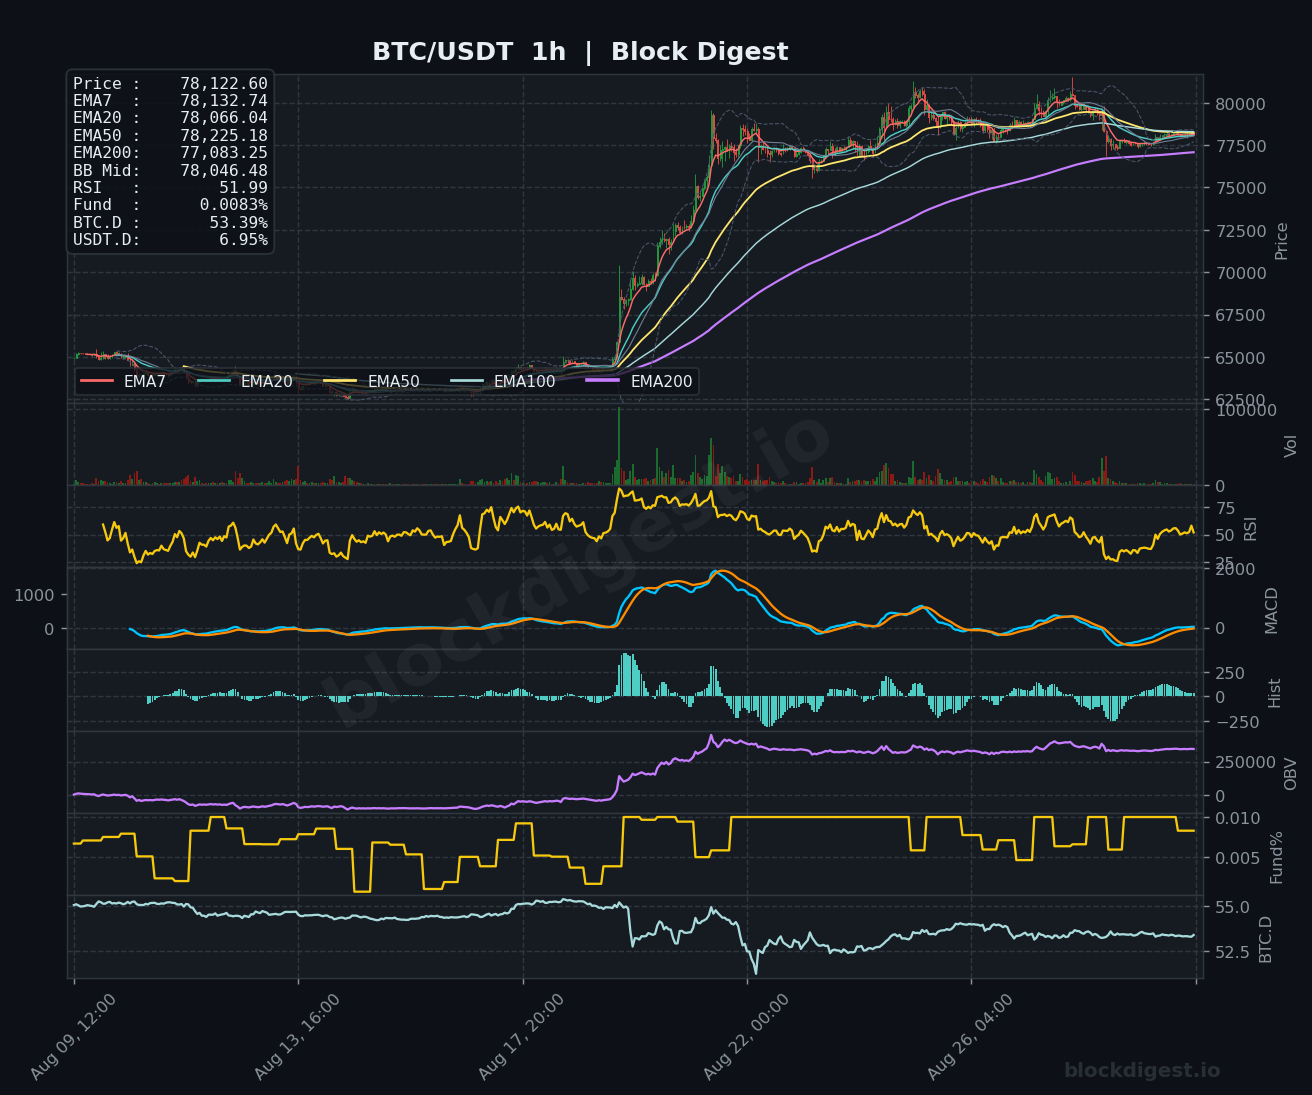
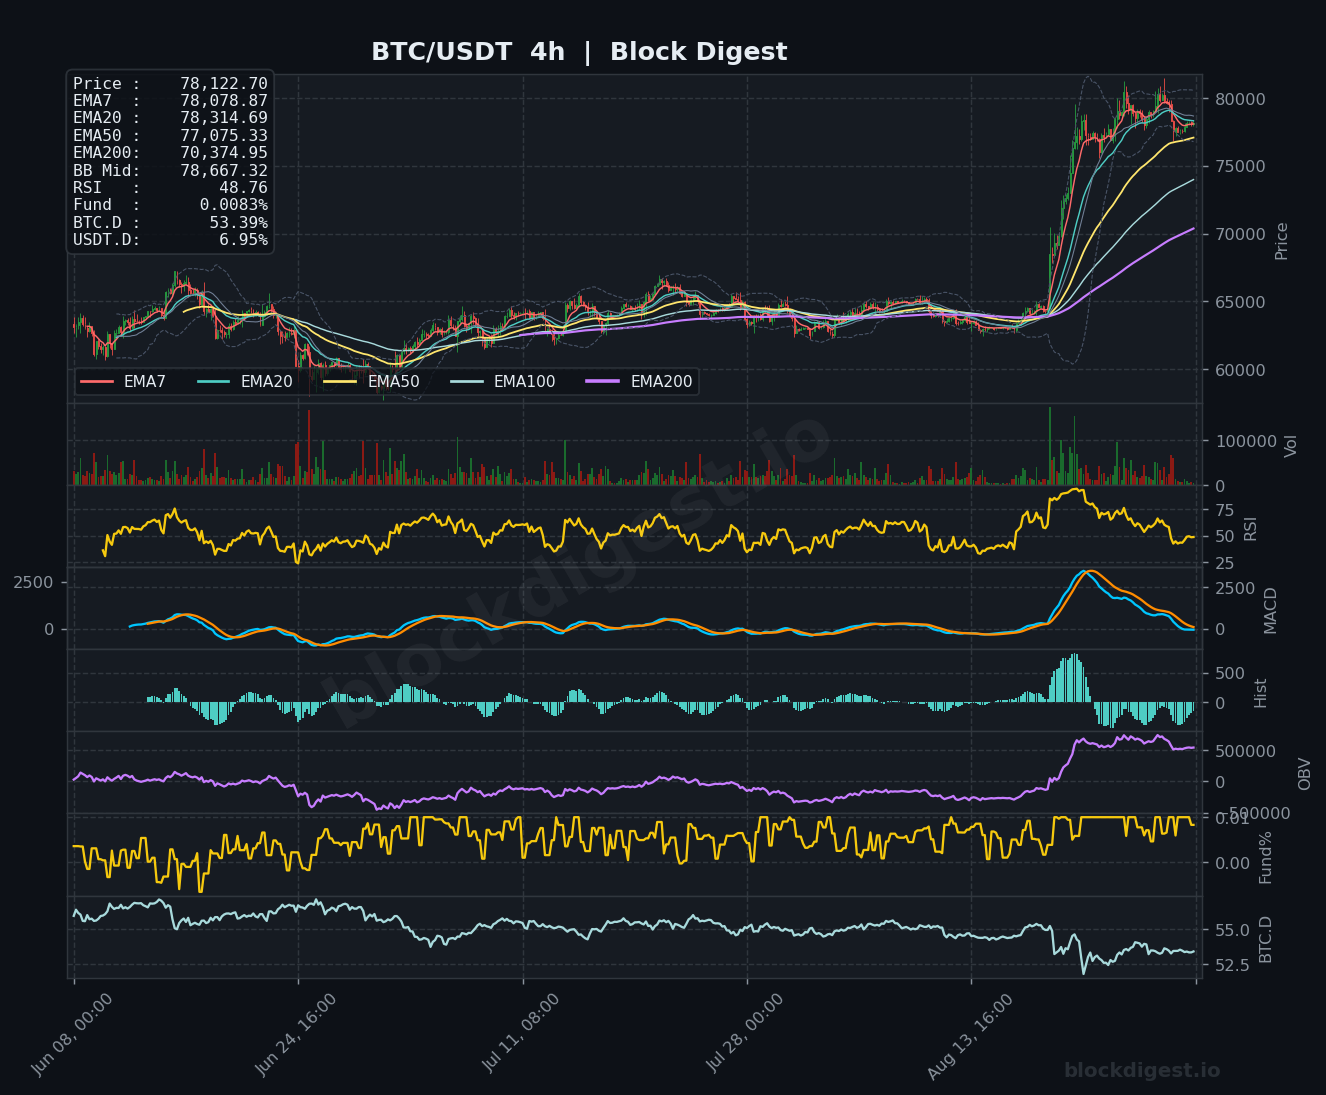
The 1h and 4h timeframes show a period of consolidation following the recent impulsive move, with the 1h price hovering right at the EMA7 ($78,132.74) and EMA20 ($78,066.04). On the 4h chart, the price is slightly below the EMA20 ($78,314.69), suggesting a minor cooling-off period before the next potential leg up. The daily timeframe provides the necessary macro support, with the price well clear of the EMA200 ($72,171.98), confirming that the broader market structure remains supportive of higher valuations despite short-term volatility.
Key Levels to Watch
- Resistance:
- $80,560: The 4h upper Bollinger Band, representing the immediate ceiling for a breakout attempt.
- $85,830: The daily upper Bollinger Band, serving as the primary target for an extended bullish rally.
- $81,000: A psychological barrier that aligns with recent local highs and serves as a pivot for further expansion.
- Support:
- $76,774: The 4h lower Bollinger Band, which acts as the first line of defense against a deeper correction.
- $73,583: The daily EMA20, representing a critical structural support level to maintain the current bullish trend.
- $72,171: The daily EMA200, the ultimate line in the sand for long-term trend integrity.
Momentum & On-Chain Signals
Momentum remains elevated, evidenced by a daily RSI of 71.22, which suggests the asset is entering overbought territory. Our proprietary BD Pulse indicator confirms this intensity with a score of 83/100, though the BD Extreme Index at +1.81σ warns that the market is stretched and prone to a mean-reversion pull. While the 1h MACD shows a positive histogram of 30.19, indicating renewed buying interest, the funding rate of +0.0094% reflects a market that is leaning bullish but not yet excessively leveraged, keeping the current rally relatively healthy.
BTC Dominance & Market Sentiment
BTC Dominance sits at 53.36%, indicating that Bitcoin continues to absorb the lion’s share of market liquidity, leaving altcoins in a secondary position. With USDT dominance at 6.95%, the market is showing a clear preference for risk-on assets, suggesting that capital is actively rotating into Bitcoin rather than sitting on the sidelines in stablecoins.
Risk Scenarios
- Bullish case: A decisive 4h candle close above the $78,667 mid-band would likely trigger a retest of the $80,560 resistance, potentially opening the door for a move toward $85,000.
- Bearish case: A failure to hold the $76,774 support level would likely invite a retest of the $73,583 daily EMA20, signaling a potential shift toward a deeper consolidation phase.
Outlook
The overall setup remains bullish, with the market showing resilience as it digests recent gains. Traders should monitor the $78,000 level closely; as long as the price maintains this threshold, the path of least resistance remains upward. We expect volatility to persist in the next 24-48 hours as the market balances the current overbought conditions against the strong underlying accumulation trend.
Disclaimer: This analysis is for informational purposes only and does not constitute financial advice. Cryptocurrency markets are highly volatile and unpredictable. All trading decisions should be made based on your own research and risk tolerance. Block Digest is not responsible for any financial losses incurred as a result of acting on this content.