Ethereum Weekly Analysis: Ethereum at $1,862 amid inflation and geopolitical tensions
Weekly Market Overview
Ethereum enters the week of July 20, 2026 trading at approximately $1,862, clinging to a tentative recovery structure after what has been a prolonged and punishing bear trend from the 2025 highs above $4,000. The week’s price action has been shaped by competing forces: a softer-than-expected U.S. inflation print briefly propelled ETH above $1,900, but sustained geopolitical headwinds — including a sixth consecutive day of U.S. airstrikes against Iran — have repeatedly capped upside attempts, dragging price back below that psychological threshold. The weekly candle is currently printing a relatively compressed body, reflecting indecision between buyers defending the recent oversold bounce and sellers leaning on macro uncertainty. On balance, the structure remains a corrective rebound within a broader downtrend rather than a confirmed trend reversal.
Higher Timeframe Structure
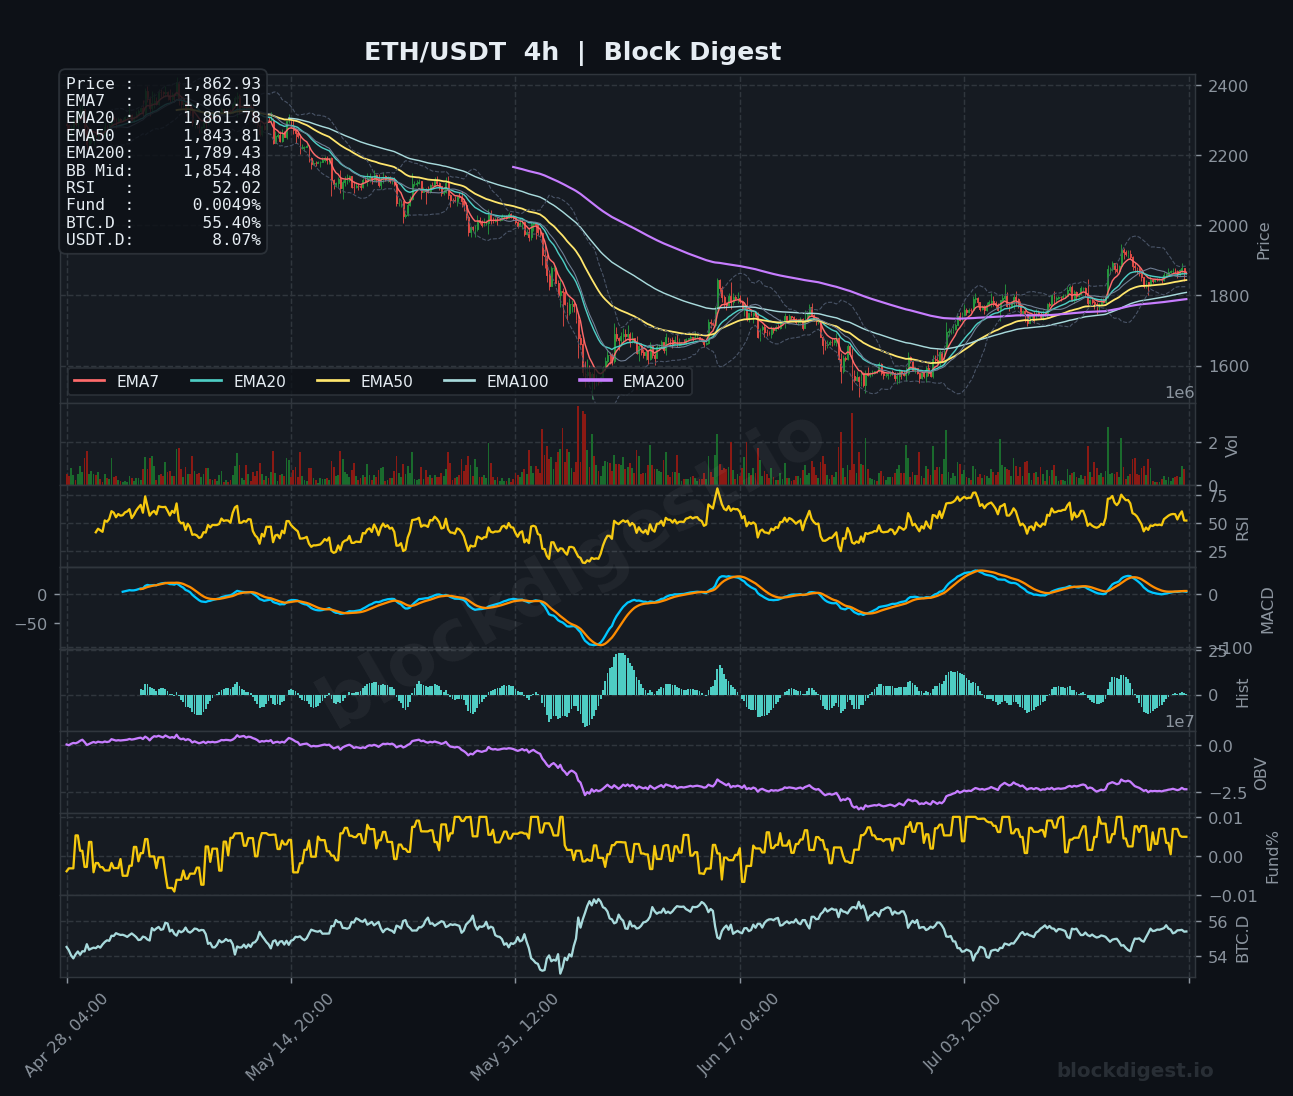
On the weekly chart, the EMA stack tells a sobering story: price is trading well below the EMA20 ($2,023), EMA50 ($2,422), EMA100, and EMA200 ($2,487), with only the EMA7 ($1,833) turning constructively beneath current price. This full bearish EMA alignment — price trapped under all major weekly averages — is the dominant macro reality for ETH right now. The weekly Bollinger Band midline sits at $2,004, acting as the first meaningful resistance level that would need to be reclaimed to signal any genuine structural shift. Historically, this configuration mirrors the protracted base-building phases seen in late 2022 and mid-2023, suggesting that while a bottom may be forming, any recovery will likely be slow and contested rather than explosive.
Multi-Timeframe Confluence
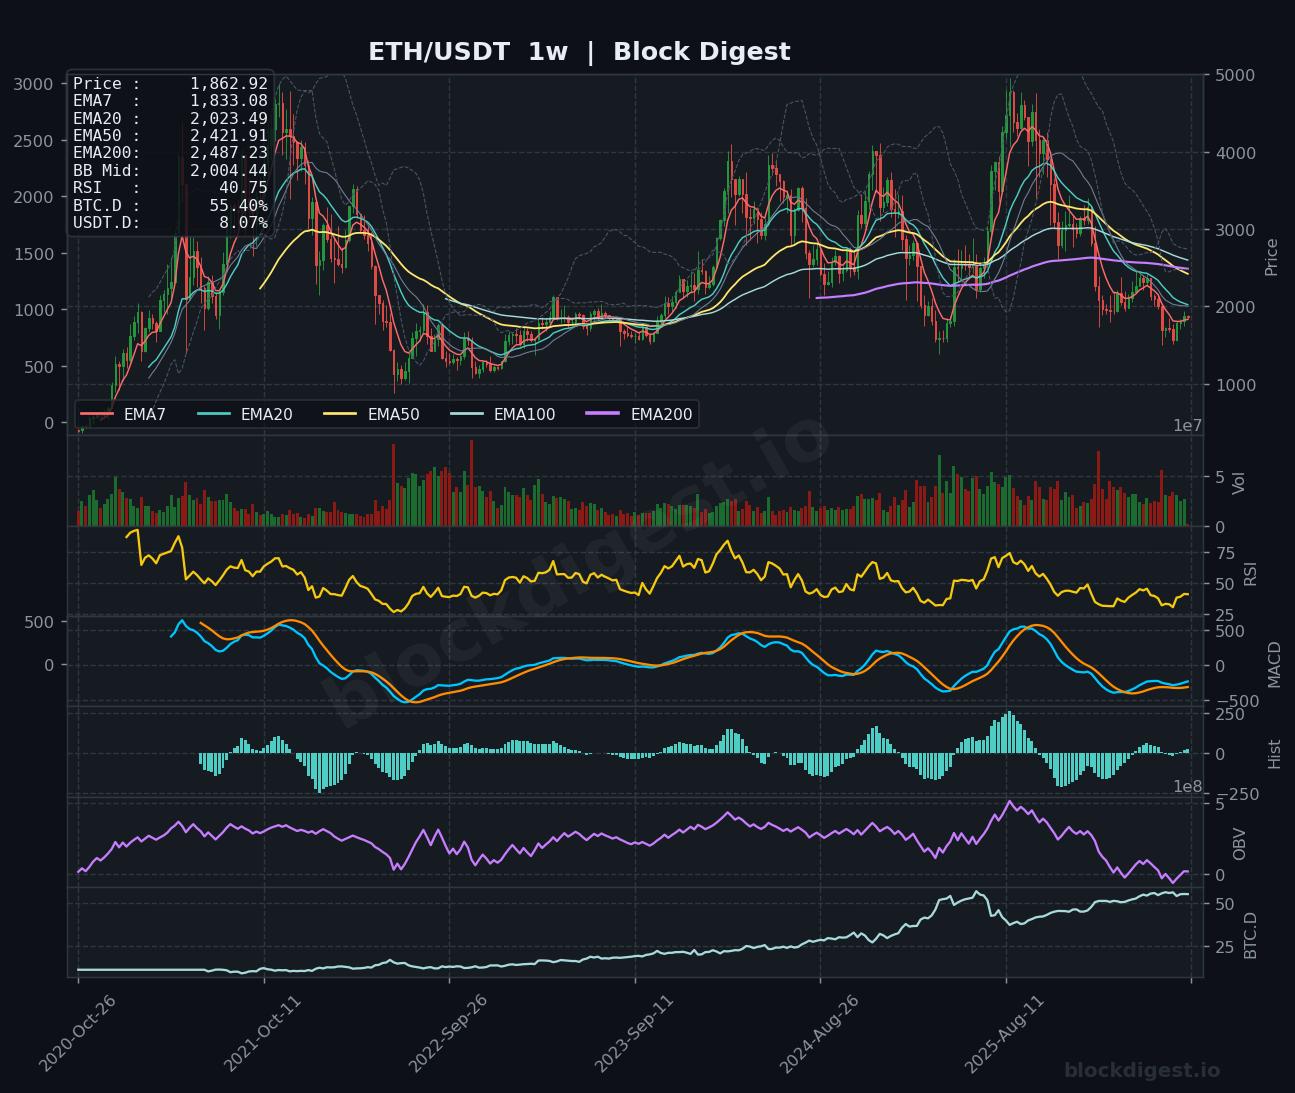
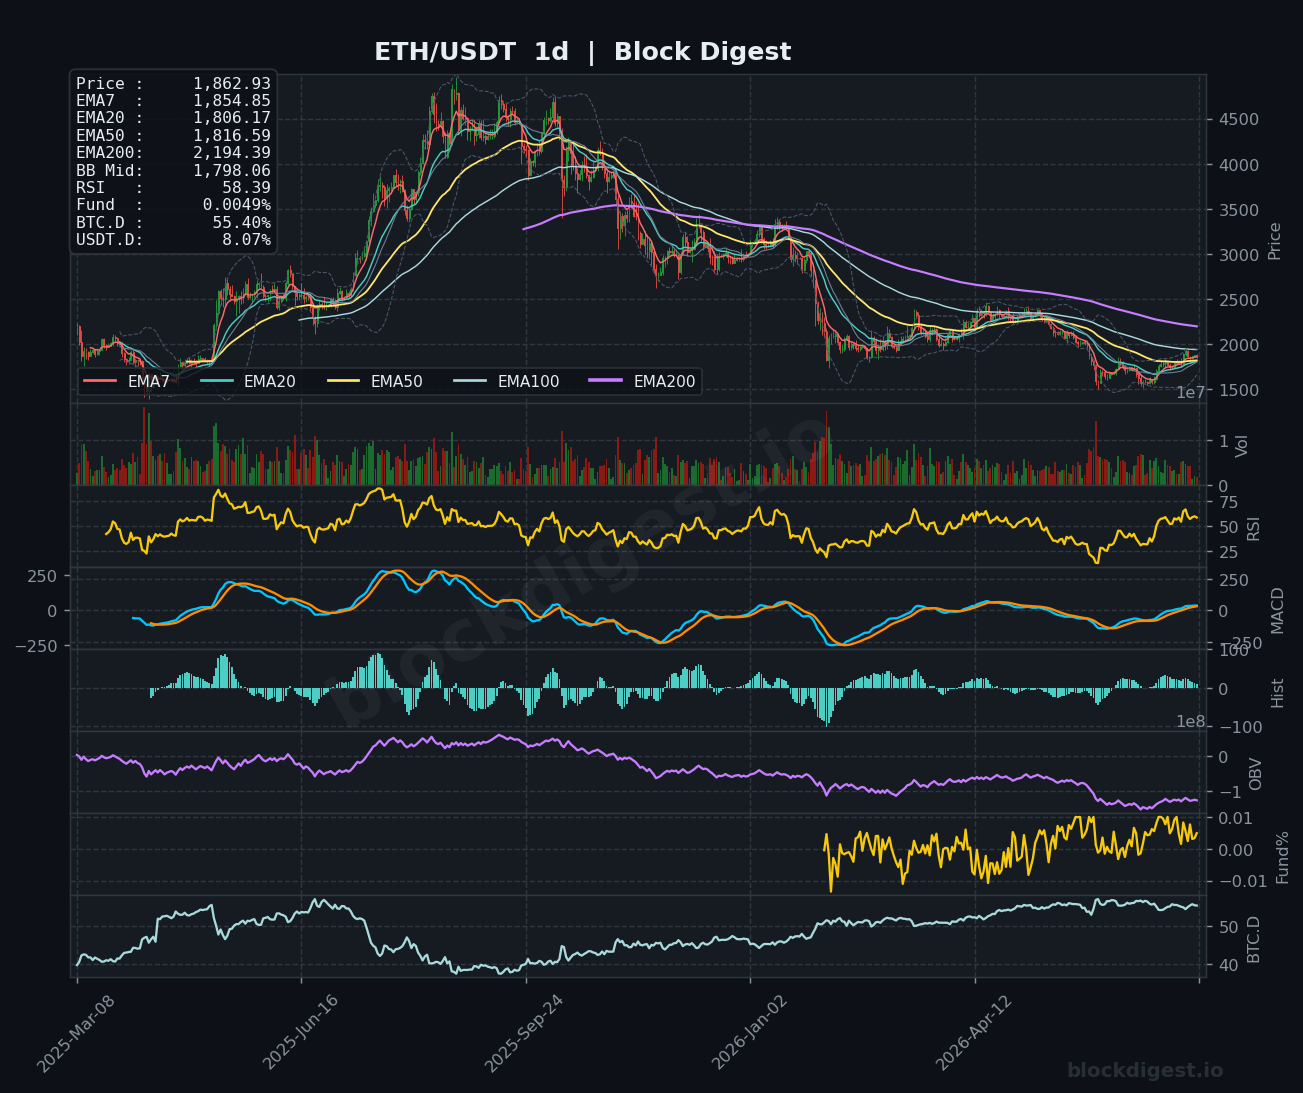
Zooming into the daily timeframe, a more encouraging picture emerges: ETH has reclaimed its daily EMA7 ($1,855) and EMA20 ($1,806), and both the EMA50 ($1,817) and EMA20 have been crossed to the upside, indicating the near-term trend has shifted from aggressively bearish to cautiously bullish. The 4-hour chart reinforces this, with price sitting just above a tightly compressed EMA cluster (EMA7 at $1,866, EMA20 at $1,862, EMA50 at $1,844), suggesting a potential short-term consolidation or minor continuation move. The key confluent zone to watch is the $1,900–$1,950 range, where both the daily chart’s recent rejection zone and the weekly chart’s structural compression overhead converge into a meaningful resistance band.
Key Weekly Levels
- Weekly Resistance: $1,900–$1,920 (recent intraweek high, psychological round number, prior consolidation ceiling); $2,004 (weekly BB midline, first major structural reclaim target); $2,194 (daily EMA200, the macro resistance wall that capped all prior recovery attempts)
- Weekly Support: $1,800–$1,816 (daily EMA50/EMA20 cluster and key short-term demand zone); $1,700–$1,720 (prior swing low from the June capitulation, critical structural floor); $1,580–$1,600 (multi-year support region visible on the weekly chart, last line of defense before deeper drawdown territory)
Momentum & Volume Analysis
The weekly RSI currently sits at 40.75 — still technically below the neutral 50 threshold and firmly in bearish momentum territory, though notably recovering from what appeared to be a deeply oversold condition closer to 25-30 in recent weeks. The daily RSI at 58.39 is considerably more constructive, signaling that the shorter timeframe momentum has shifted meaningfully higher, while the 4-hour RSI at 52.02 reflects a balanced but slightly bullish near-term posture. Our BD Pulse Score of 27/100 — deep in bearish territory — confirms that the on-chain picture has yet to validate the price recovery, and the OBV trend reading of -1 is a notable caution flag: volume is not yet flowing convincingly into the rally, raising questions about its sustainability. The funding rate at +0.0057% is mildly positive but not indicative of frothy leverage, suggesting the current bounce is not yet built on excessive speculation.
BTC Dominance & Altcoin Implications
BTC dominance is currently sitting at 55.38%, a level that has historically acted as a ceiling before capital begins rotating more meaningfully into altcoins — yet it has remained stubbornly elevated throughout this recovery period, suggesting Bitcoin is still absorbing the majority of inbound flows. USDT dominance at 8.07% remains elevated, indicating that a significant portion of the market is still sitting in stablecoins on the sidelines, which is a double-edged signal: dry powder for a potential rally, but also a reflection of persistent risk-off sentiment. Until BTC dominance shows a confirmed rollover from current levels, ETH’s outperformance will likely remain a short-term tactical trade rather than the beginning of a sustained altseason.
Risk Scenarios
- Bull case: A clean daily close above $1,920, followed by a weekly close reclaiming the $2,004 BB midline, would confirm the recovery thesis and open the door toward $2,194 (daily EMA200) as the next major target. Continued softness in U.S. macro data, de-escalation on the geopolitical front, and BTC dominance breaking below 54% would all serve as accelerants for this scenario.
- Bear case: Failure to hold the $1,800–$1,816 support cluster on any retest would signal that the bounce has exhausted itself, exposing the $1,700 swing low as the next destination. A deterioration in geopolitical risk, a hawkish macro surprise, or a breakdown in Bitcoin’s own structure below $60,000 could rapidly drain the remaining bid and push ETH toward the $1,580–$1,600 weekly support zone.
Weekly Outlook
The directional bias for the week of July 20 is cautiously neutral-to-bullish on the short timeframes, but firmly bearish on the macro weekly structure — a tension that demands careful level management rather than aggressive directional conviction. The $1,900 level is the immediate battleground: ETH has now tested and failed it twice in quick succession, and a third clean rejection would likely trigger a pullback toward the $1,816–$1,840 daily EMA cluster. Conversely, a sustained hold above $1,900 through the week’s open would shift short-term probability in favor of a push toward $1,950–$2,000. Key catalysts to monitor include any further developments on the Iran conflict, Federal Reserve commentary, and whether BTC can establish a foothold above $65,000 to provide broader market support. With the BD Pulse Score at just 27/100 and weekly OBV still trending lower, the burden of proof remains squarely on the bulls to demonstrate that this recovery has genuine conviction behind it — without that confirmation, rallies are best treated as opportunities to manage risk rather than chase entries.
Disclaimer: This analysis is for informational purposes only and does not constitute financial advice. Cryptocurrency markets are highly volatile and unpredictable. All trading decisions should be made based on your own research and risk tolerance. Block Digest is not responsible for any financial losses incurred as a result of acting on this content.