Altcoin Daily Analysis: BTC Dominance Holds 55.38% During Altcoin Consolidation
Market Context
The altcoin market is navigating a cautious consolidation phase, with BTC dominance holding firm at 55.38% — a level that continues to suppress meaningful capital rotation into altcoins. USDT.D at 8.07% remains elevated, signaling that sidelined capital has yet to redeploy aggressively into risk assets. Our BD Pulse Score of 57/100 reflects a mildly bullish undercurrent, though the Long/Short Account Ratio of 1.45 (59.2% long) suggests positioning is leaning optimistic without conviction — a setup that warrants caution if key support levels are tested.
Solana (SOL)
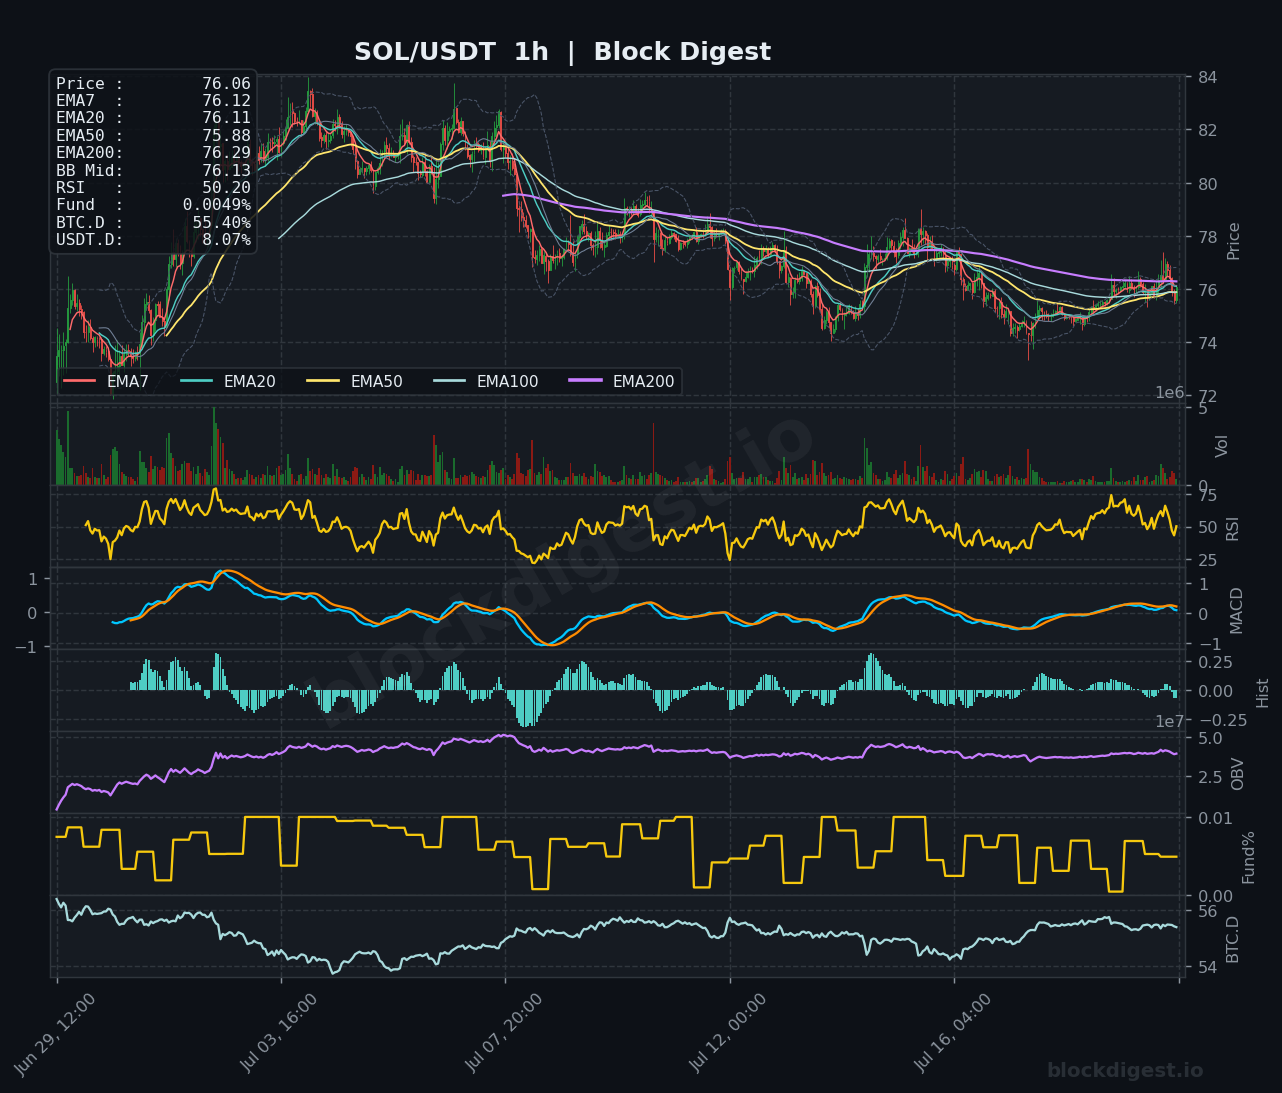
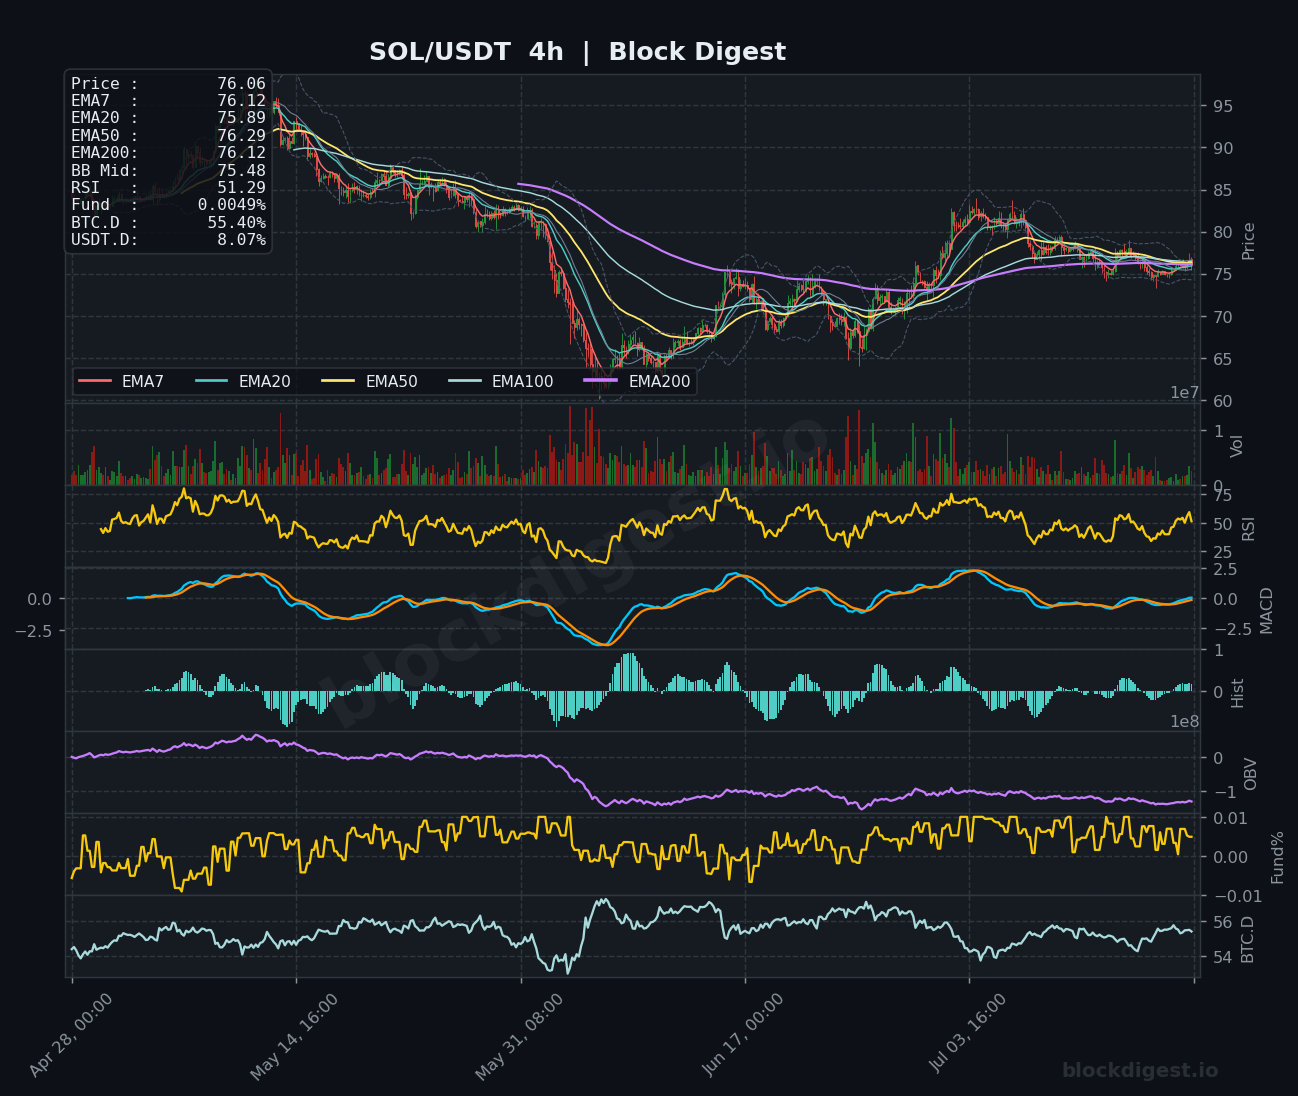
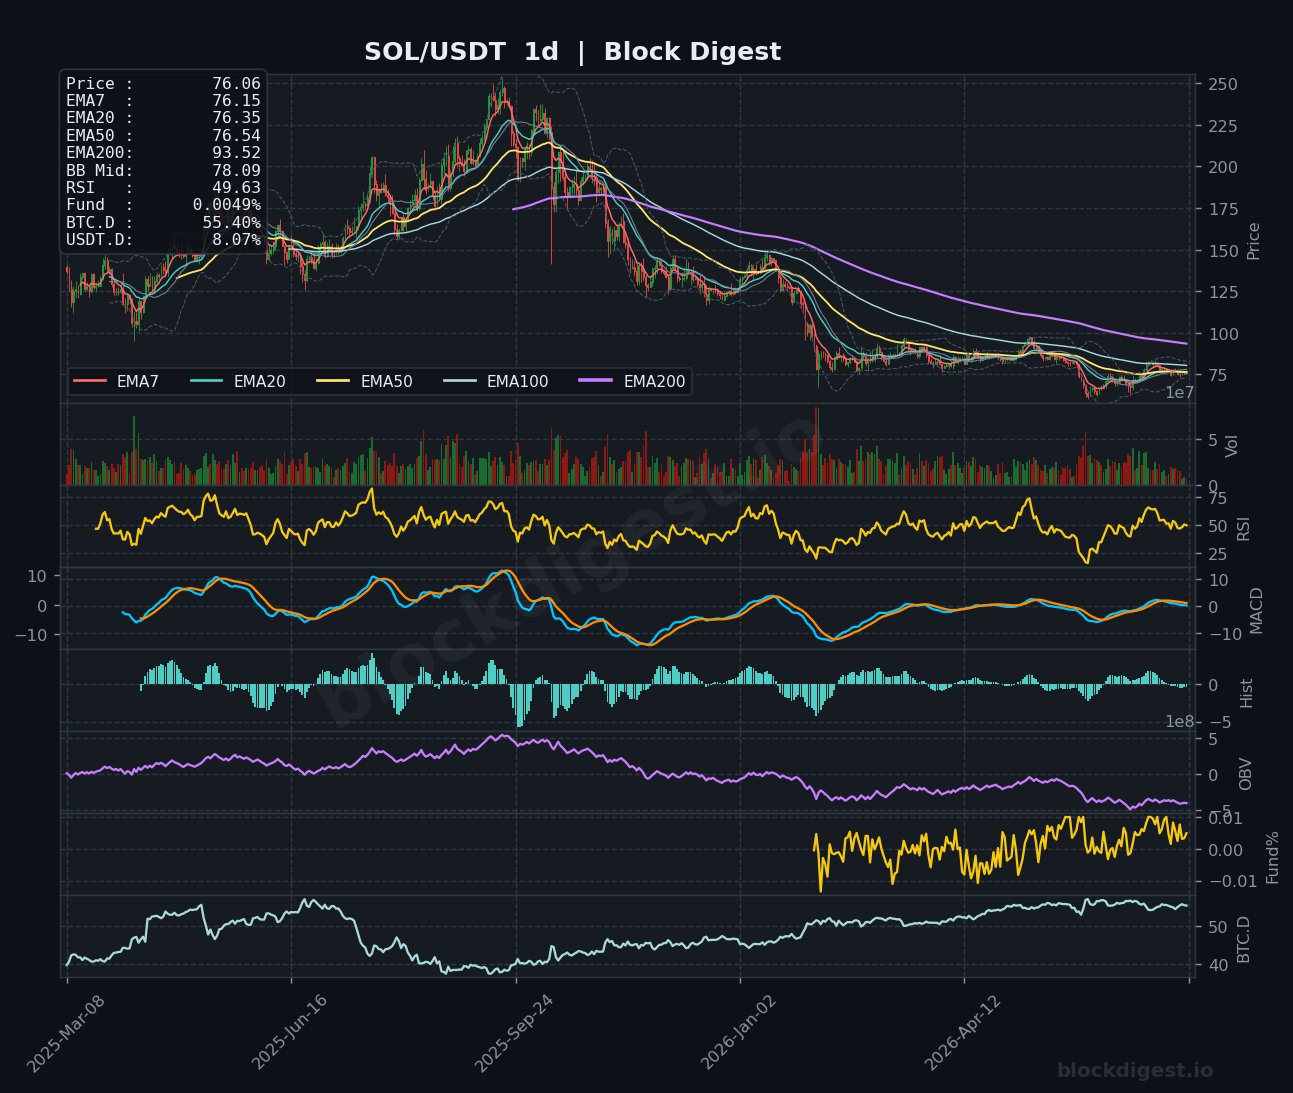
SOL is trading at $76.06, compressed tightly between its short-term EMAs (EMA7 at $76.12, EMA20 at $76.11, EMA50 at $75.88) — a cluster that reflects deep indecision following a sustained decline from the $84 range. On the daily chart, price remains well beneath the EMA200 at $93.52, confirming the broader downtrend is still structurally intact. The 1h RSI sits at 50.20 and the 4h RSI at 51.29, both hovering in neutral territory with MACD lines nearly flat, offering no directional conviction. Immediate resistance lies at the $78.00 Bollinger Band midpoint, with support at the recent consolidation floor near $74.50; a clean break above $78 would be needed to shift the short-term bias bullish.
XRP (XRP)
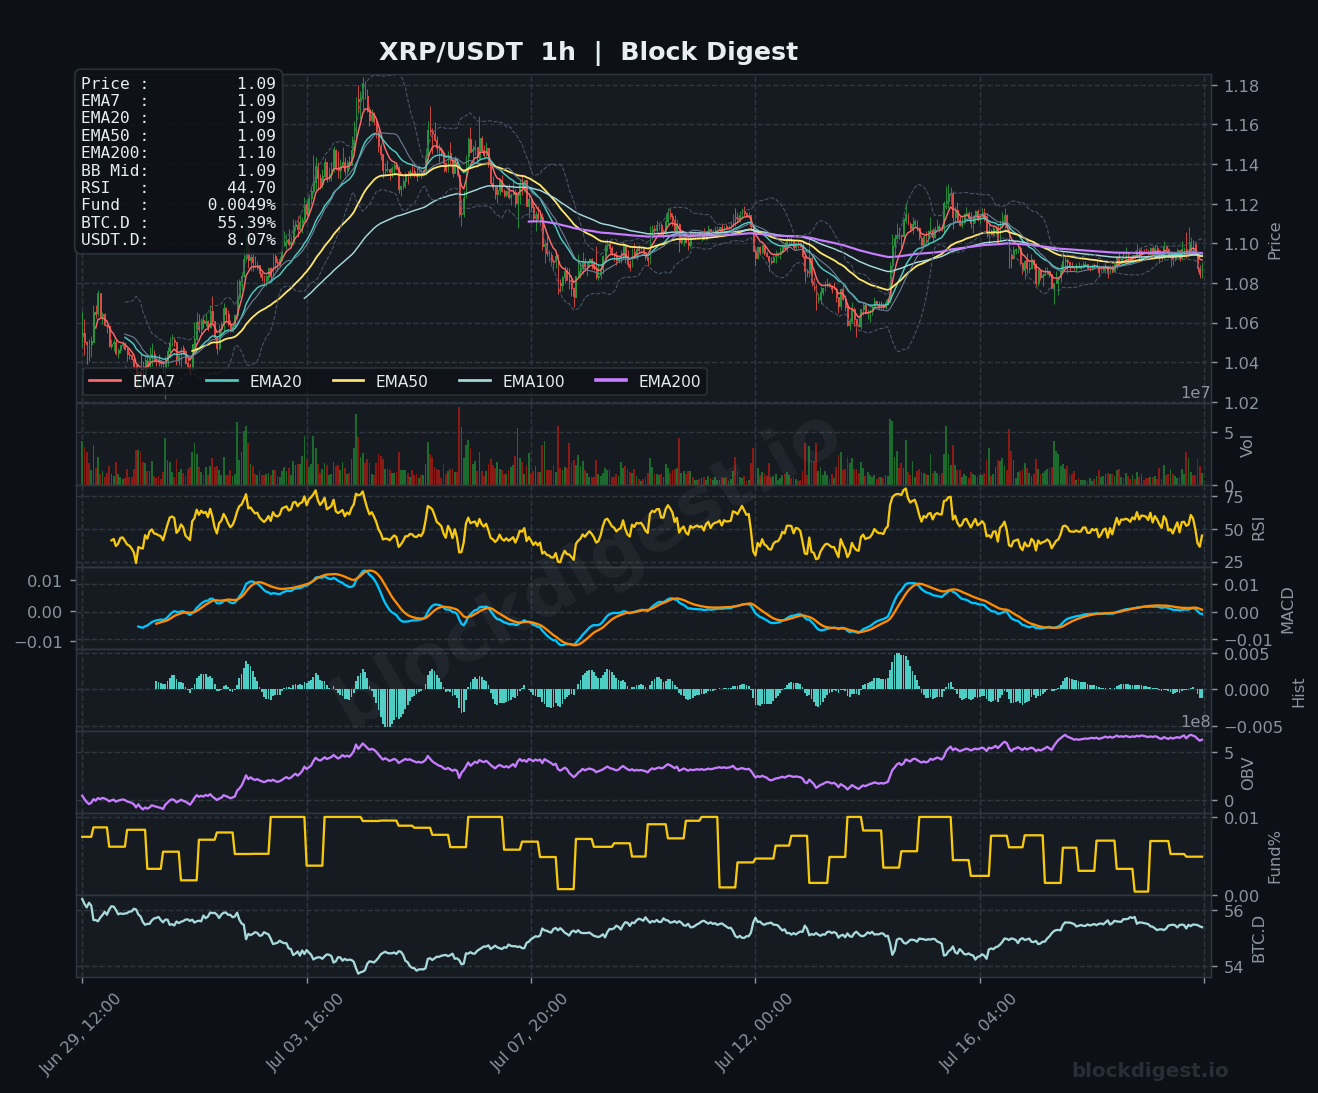
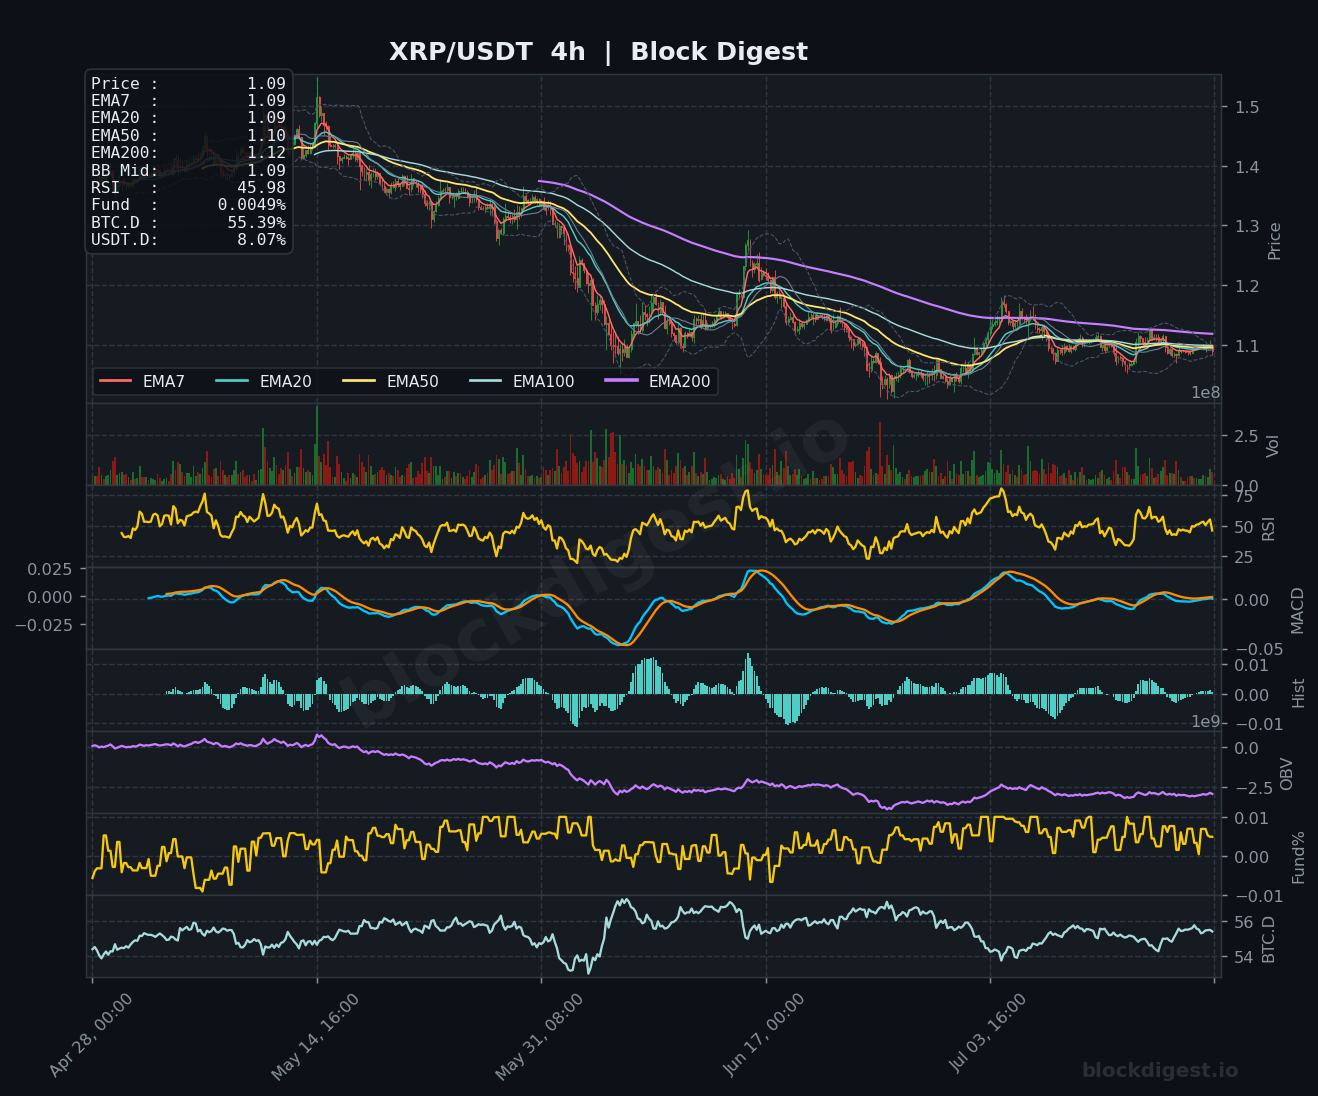
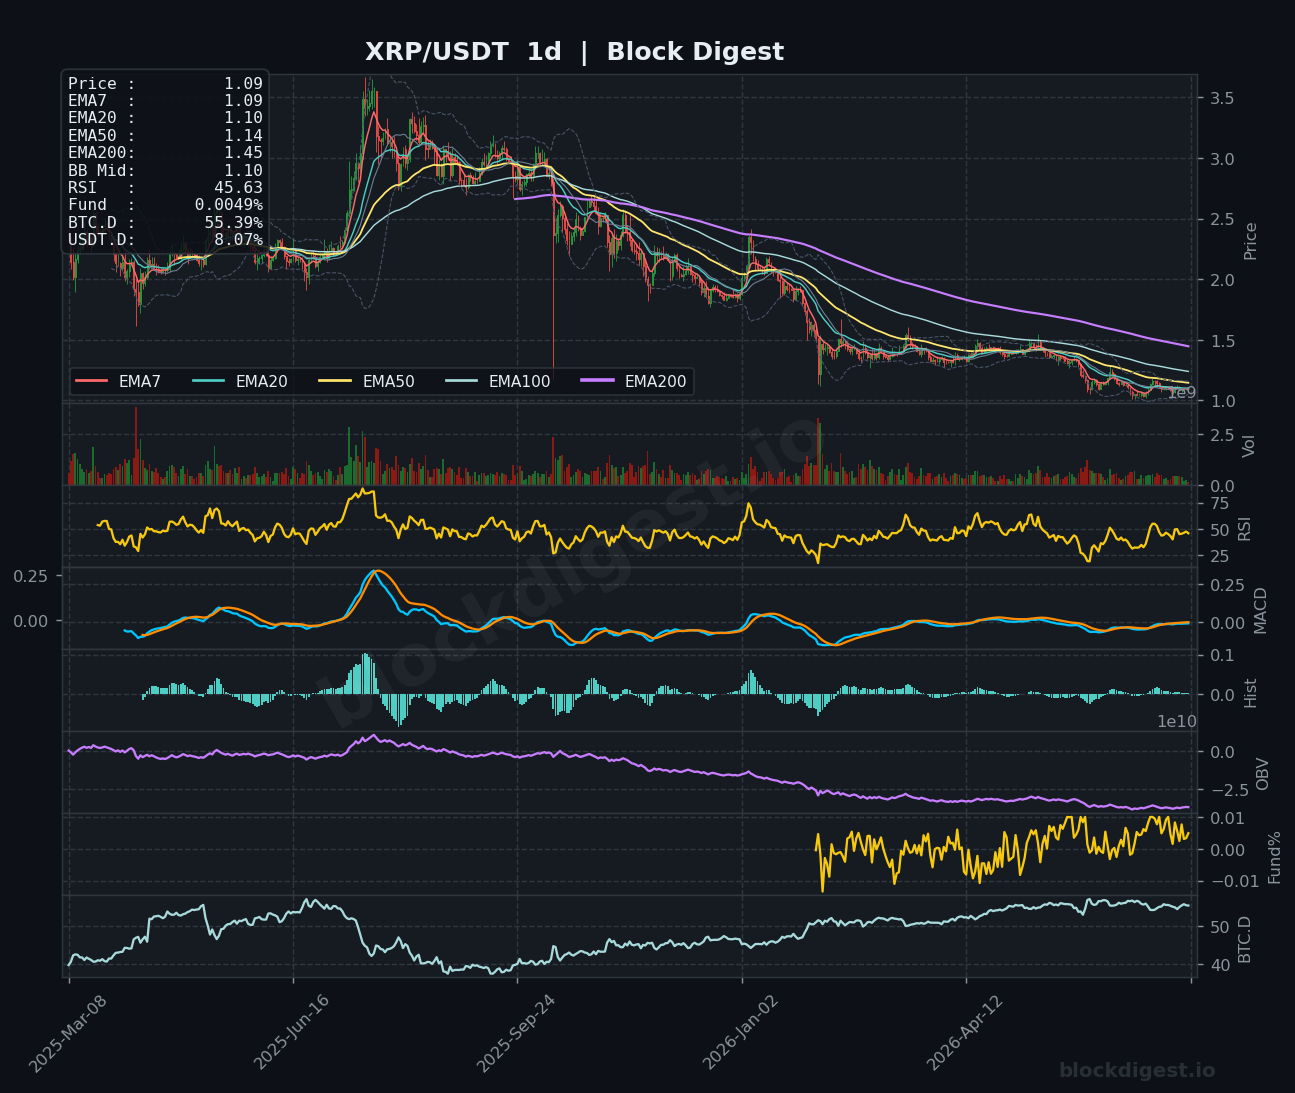
XRP is trading at $1.09, pinned beneath a bearish EMA stack on both the 4h and daily charts, where the EMA50 ($1.14) and EMA200 ($1.45) loom as significant overhead resistance. The 1h RSI at 44.70 and 4h RSI at 45.98 are both sub-50, leaning softly bearish, while the daily MACD continues to curl in a shallow recovery that lacks histogram conviction. Despite broader market chatter about XRP Ledger ecosystem strength, the on-chain OBV trend on the daily chart remains in a persistent decline from the highs, suggesting that volume is not supporting a sustained recovery. Near-term support sits at $1.07–$1.08, and bulls need a decisive reclaim of $1.12 to open a path toward $1.20.
BNB (BNB)
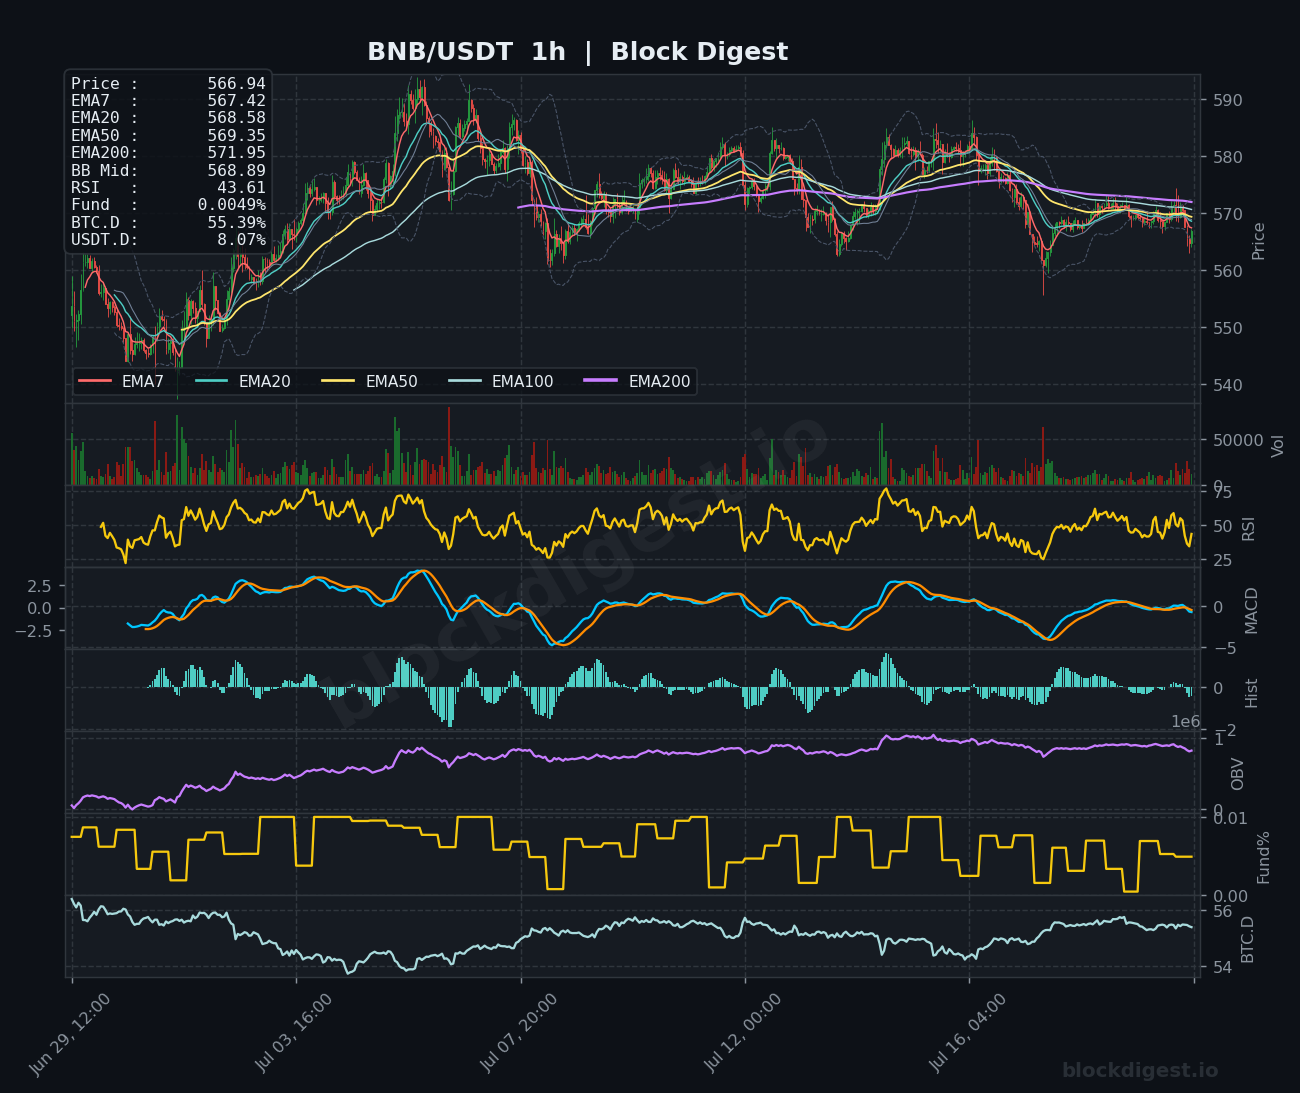
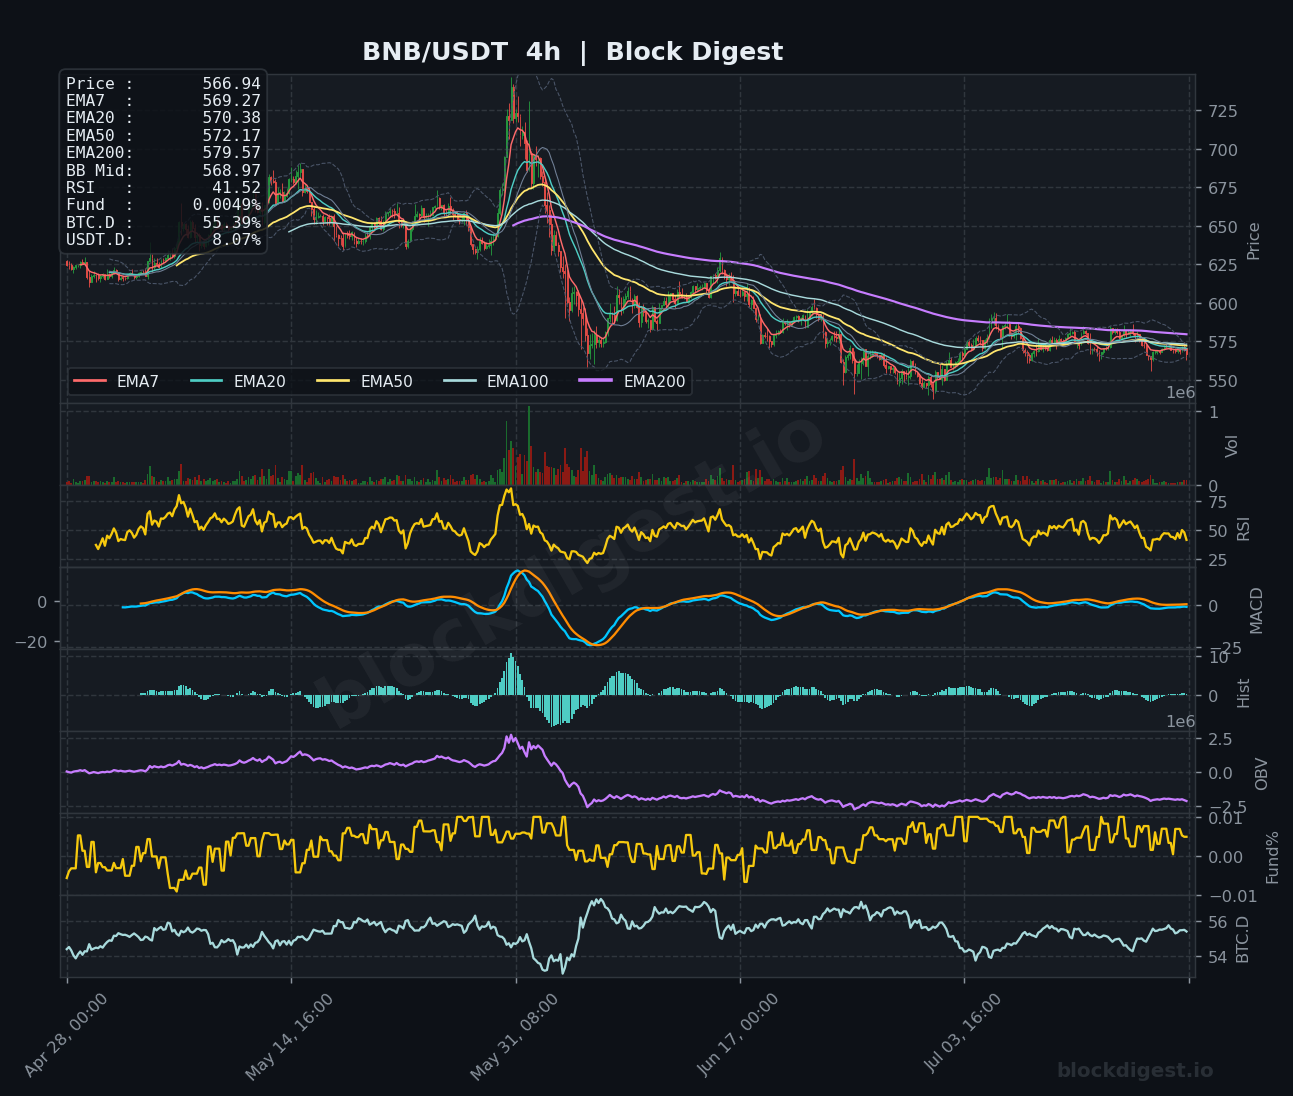
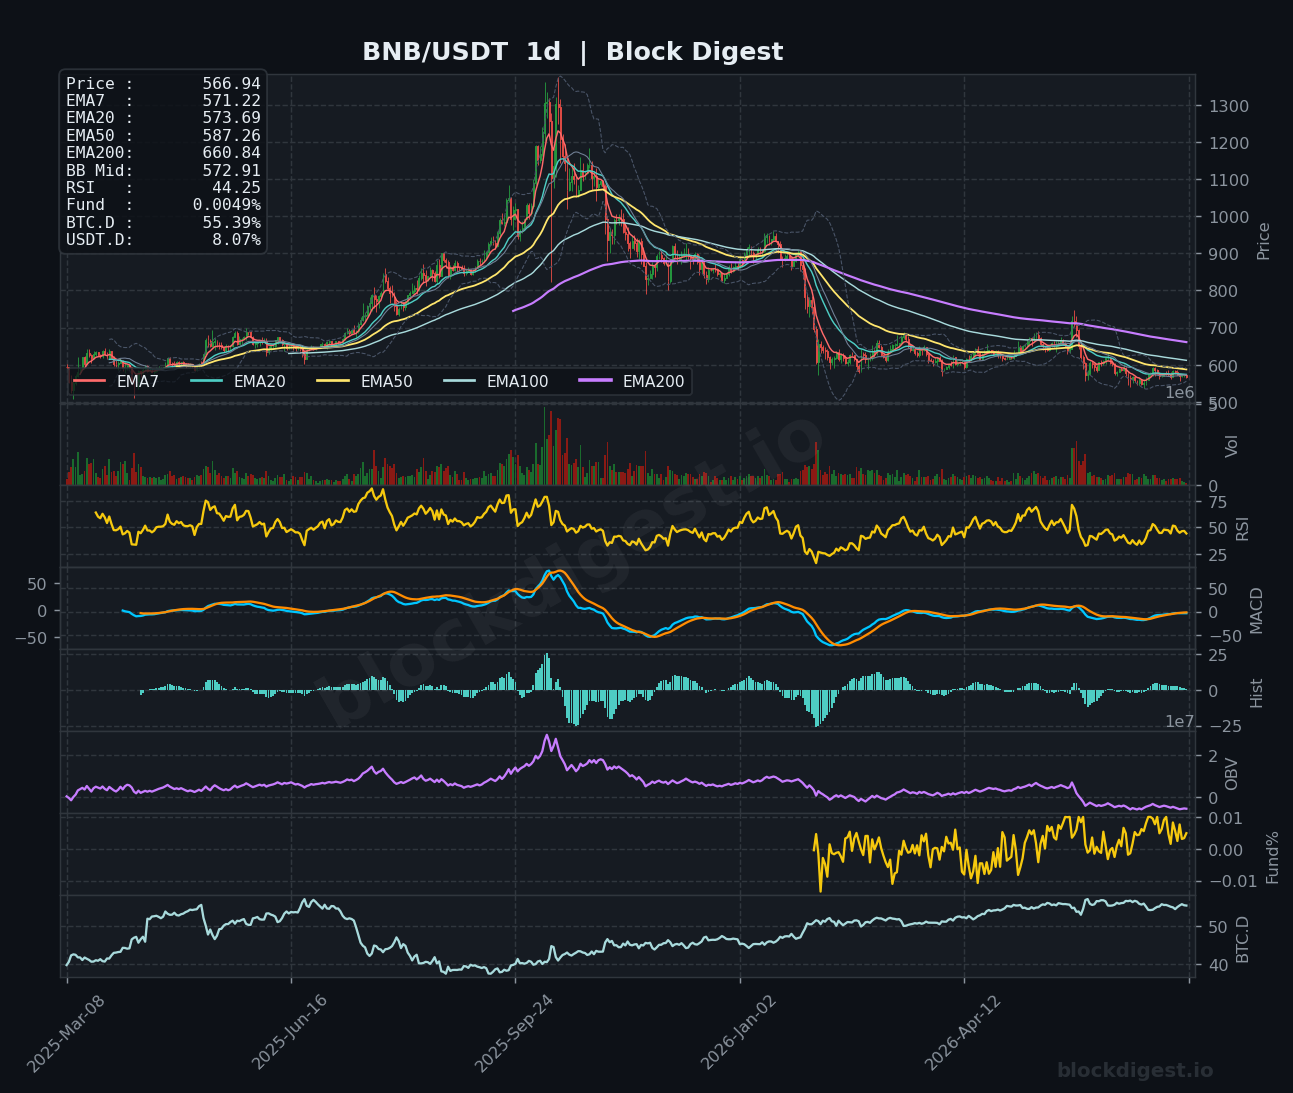
BNB is trading at $566.94, below all key short-term EMAs — EMA7 ($567.42), EMA20 ($568.58), EMA50 ($569.35), and EMA200 ($571.95) — signaling that sellers remain in control on the hourly timeframe. The 4h RSI at 41.52 and daily RSI at 44.25 are both in bearish territory, with MACD on the 4h chart producing only weak histogram readings near the zero line after a prolonged recovery attempt. On the daily chart, the EMA200 sits far overhead at $660.84, reinforcing the macro downtrend that has been in place since the prior cycle peak. Key support is the $560 zone; failure there would expose $545, while a recovery above $572–$575 would be the minimum threshold to consider any bullish re-engagement.
Dogecoin (DOGE)
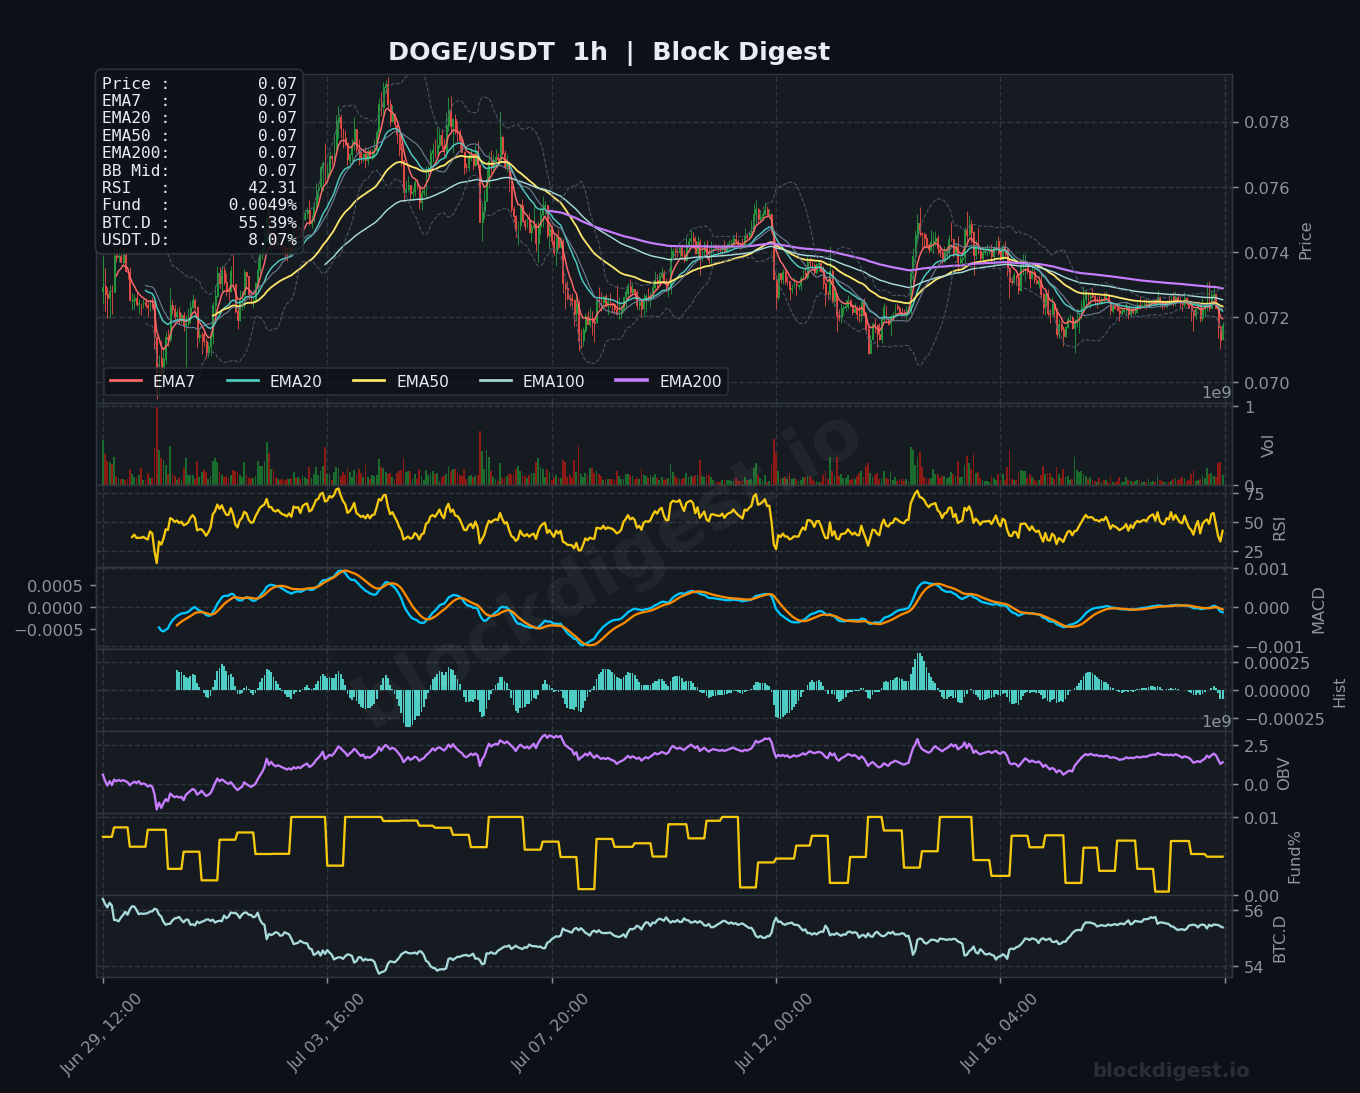
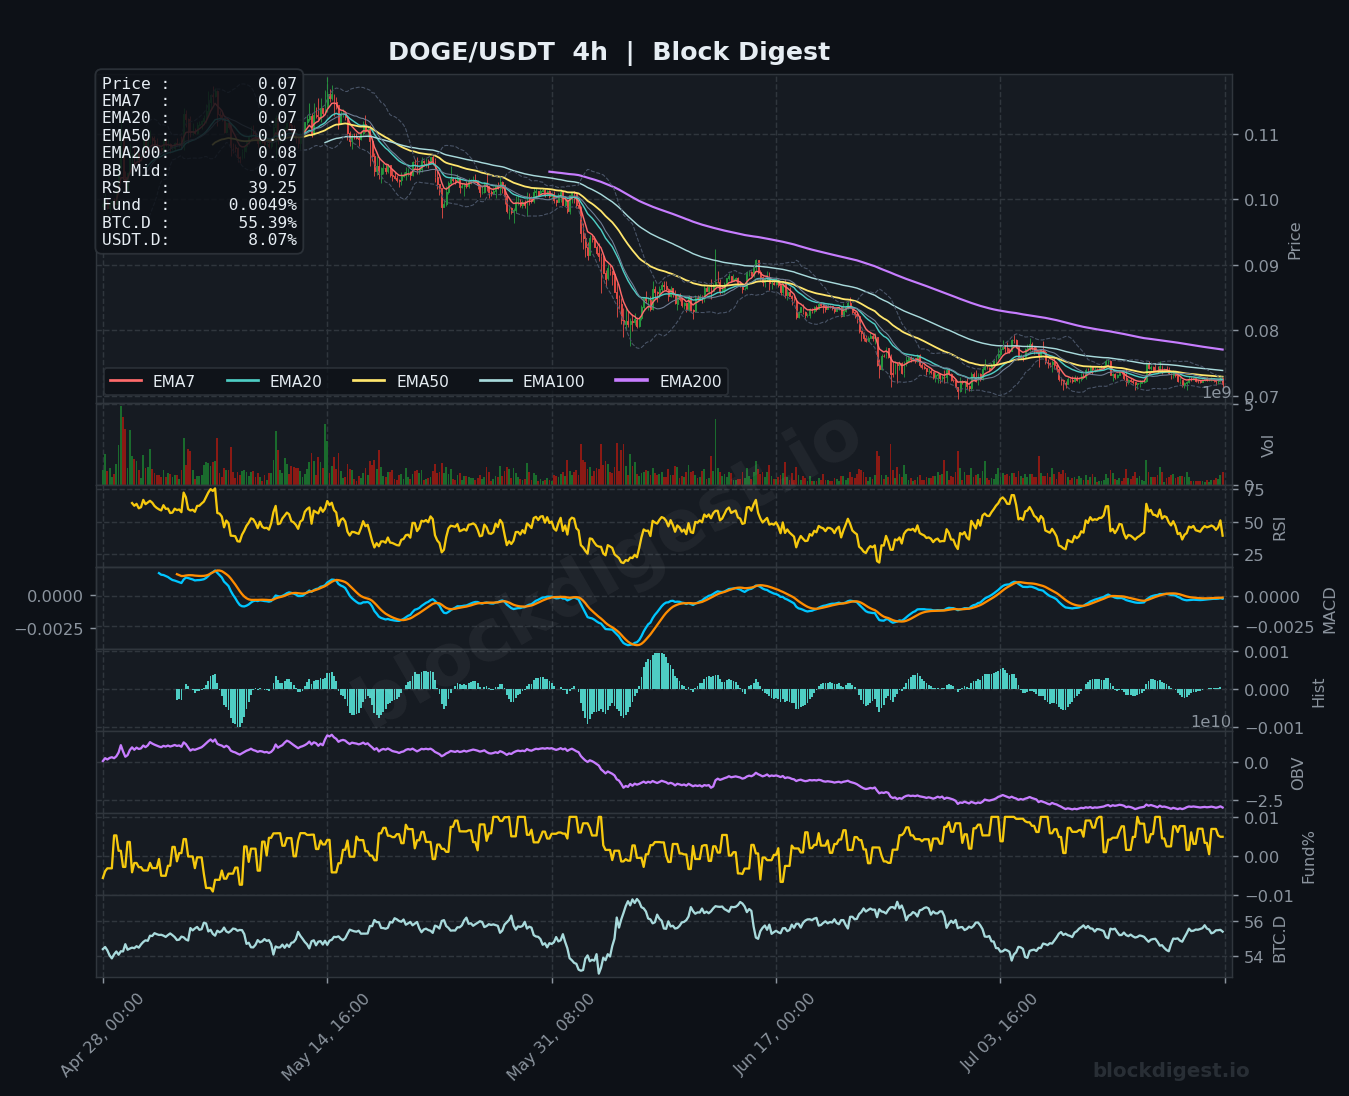
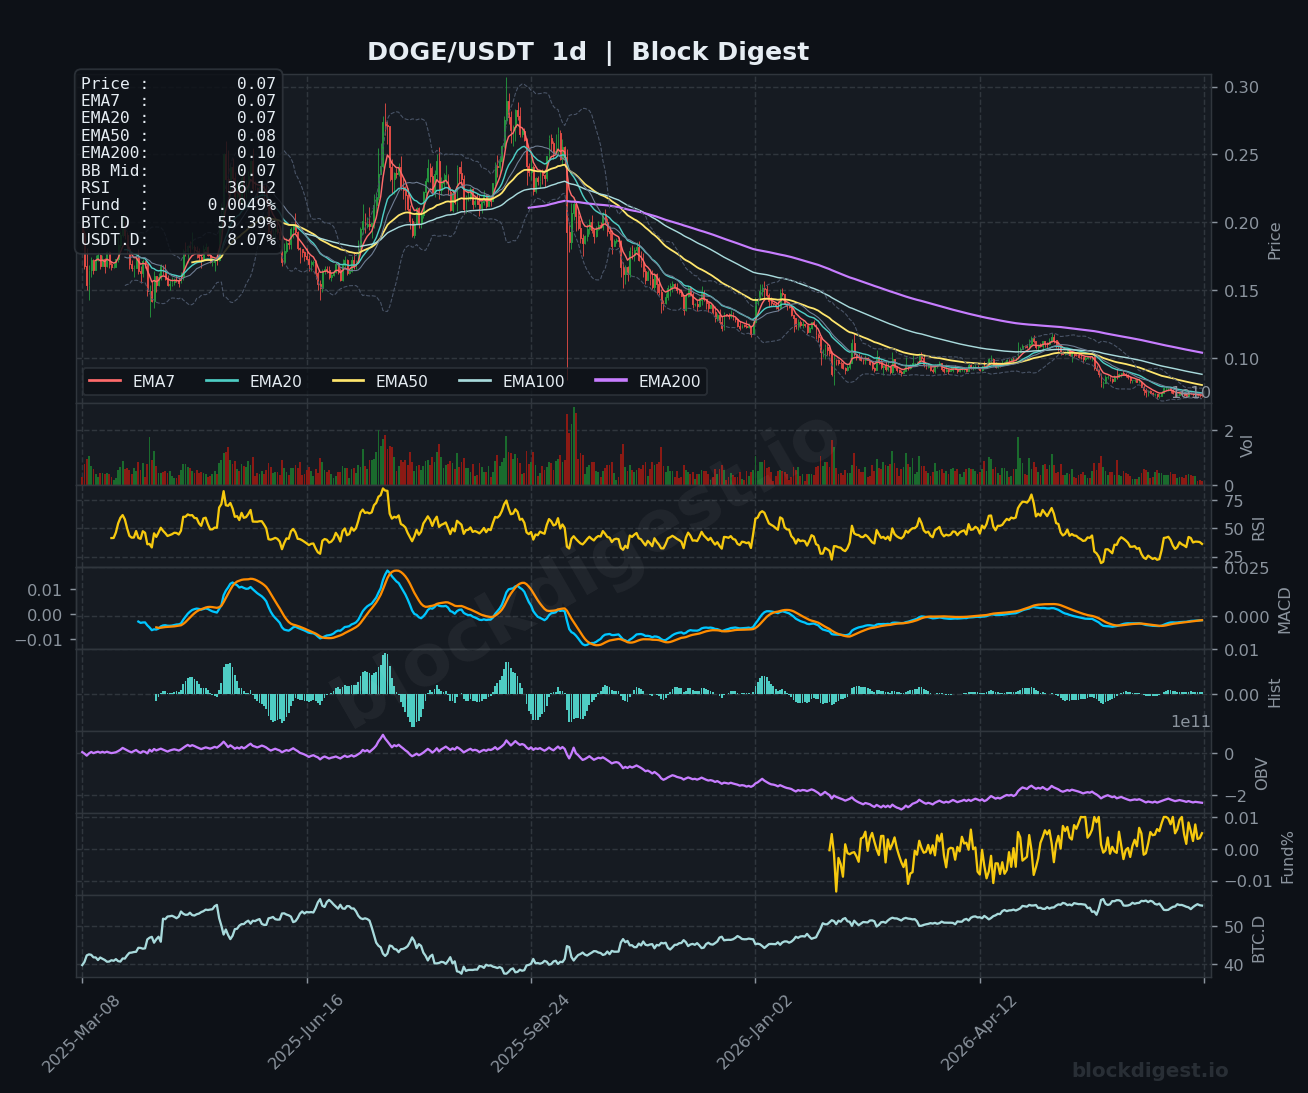
DOGE is trading at $0.0738, in one of the weakest technical setups among today’s coverage. The daily RSI has slipped to 36.12 — approaching oversold territory — while the 4h RSI at 39.25 confirms sustained selling pressure without meaningful relief. All EMAs on the daily chart are sloping downward, with EMA200 at $0.10 acting as a distant structural ceiling, and the OBV curve on all timeframes trending lower, reflecting consistent distribution. The BD Pulse OBV Trend reading of -1 aligns with this picture, underscoring the lack of accumulation. Immediate support is the $0.071–$0.072 zone; a breakdown below $0.070 would open up a test of the $0.065 handle, while a recovery above $0.076 is needed to suggest any meaningful stabilization.
Litecoin (LTC)
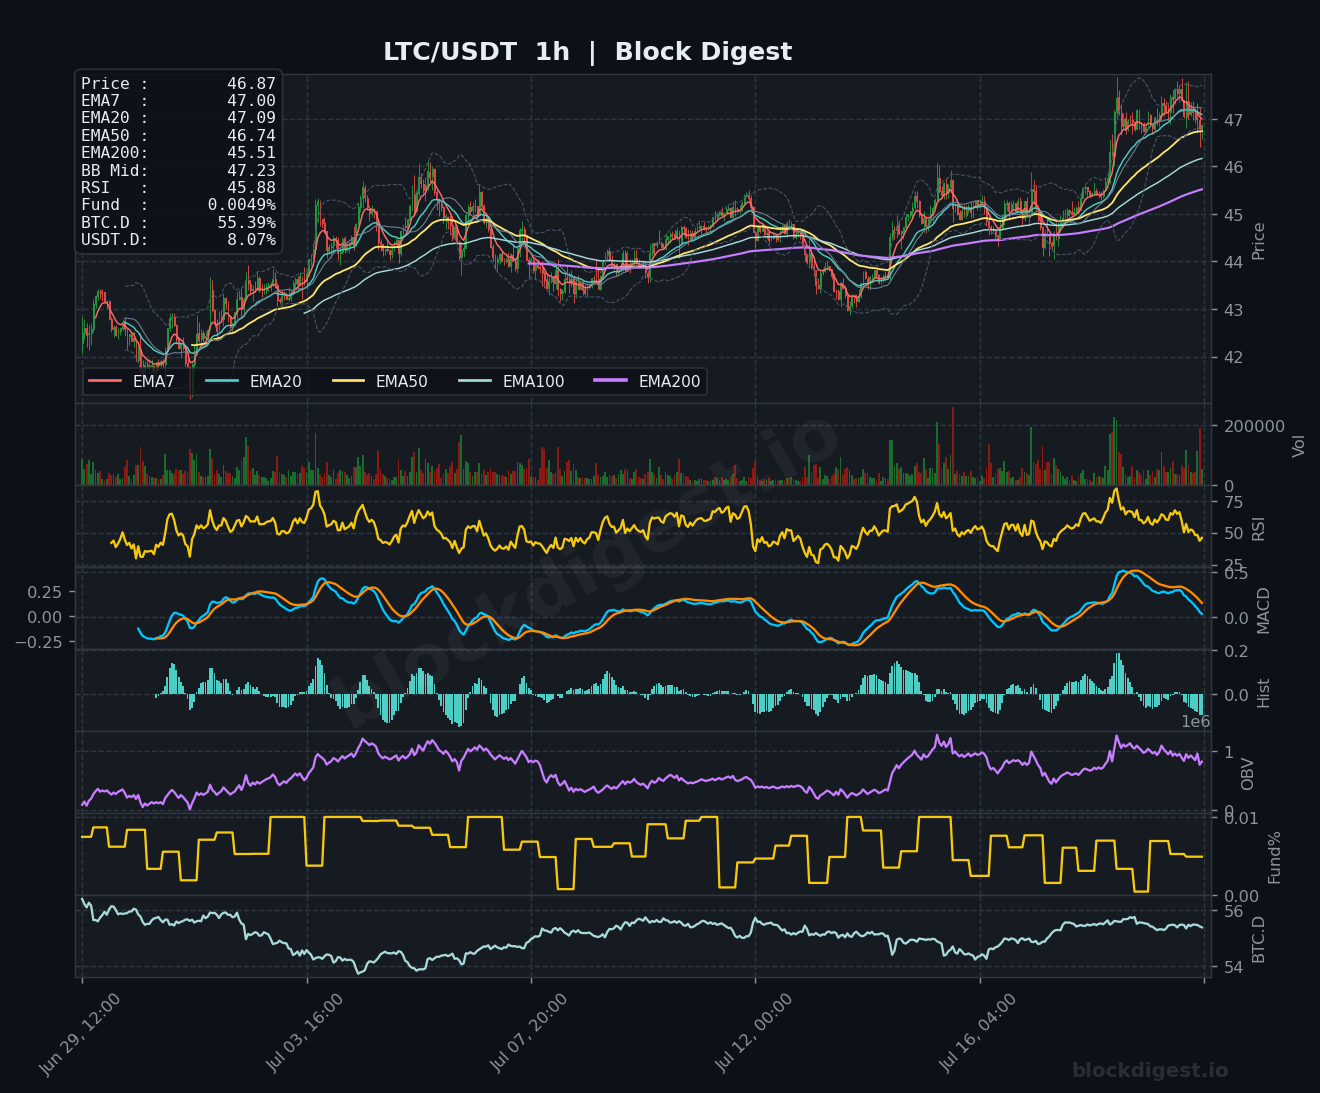
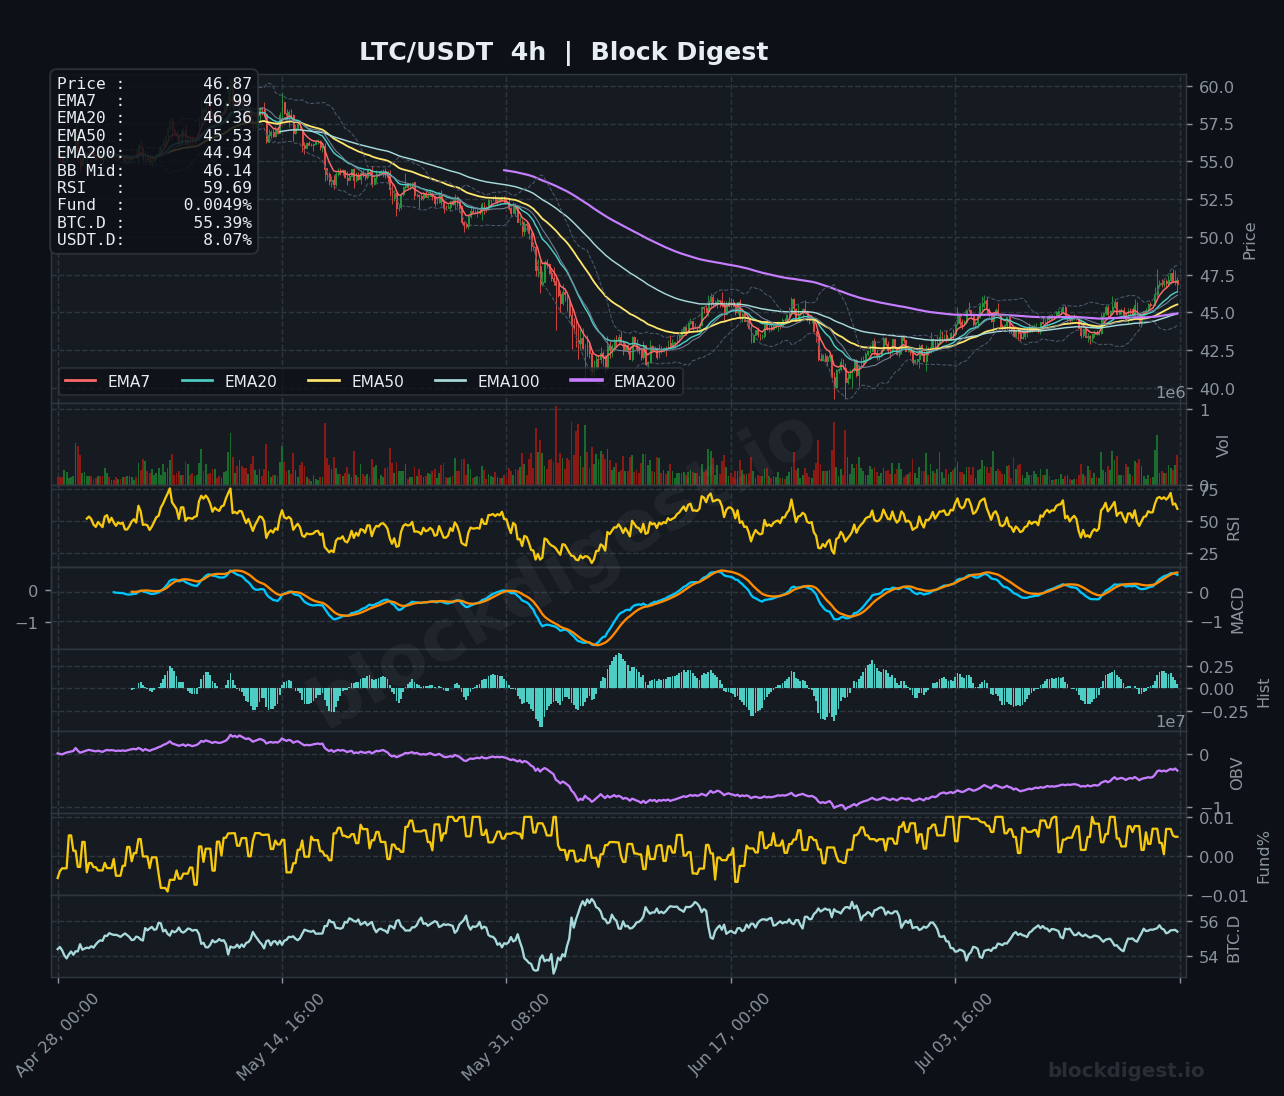
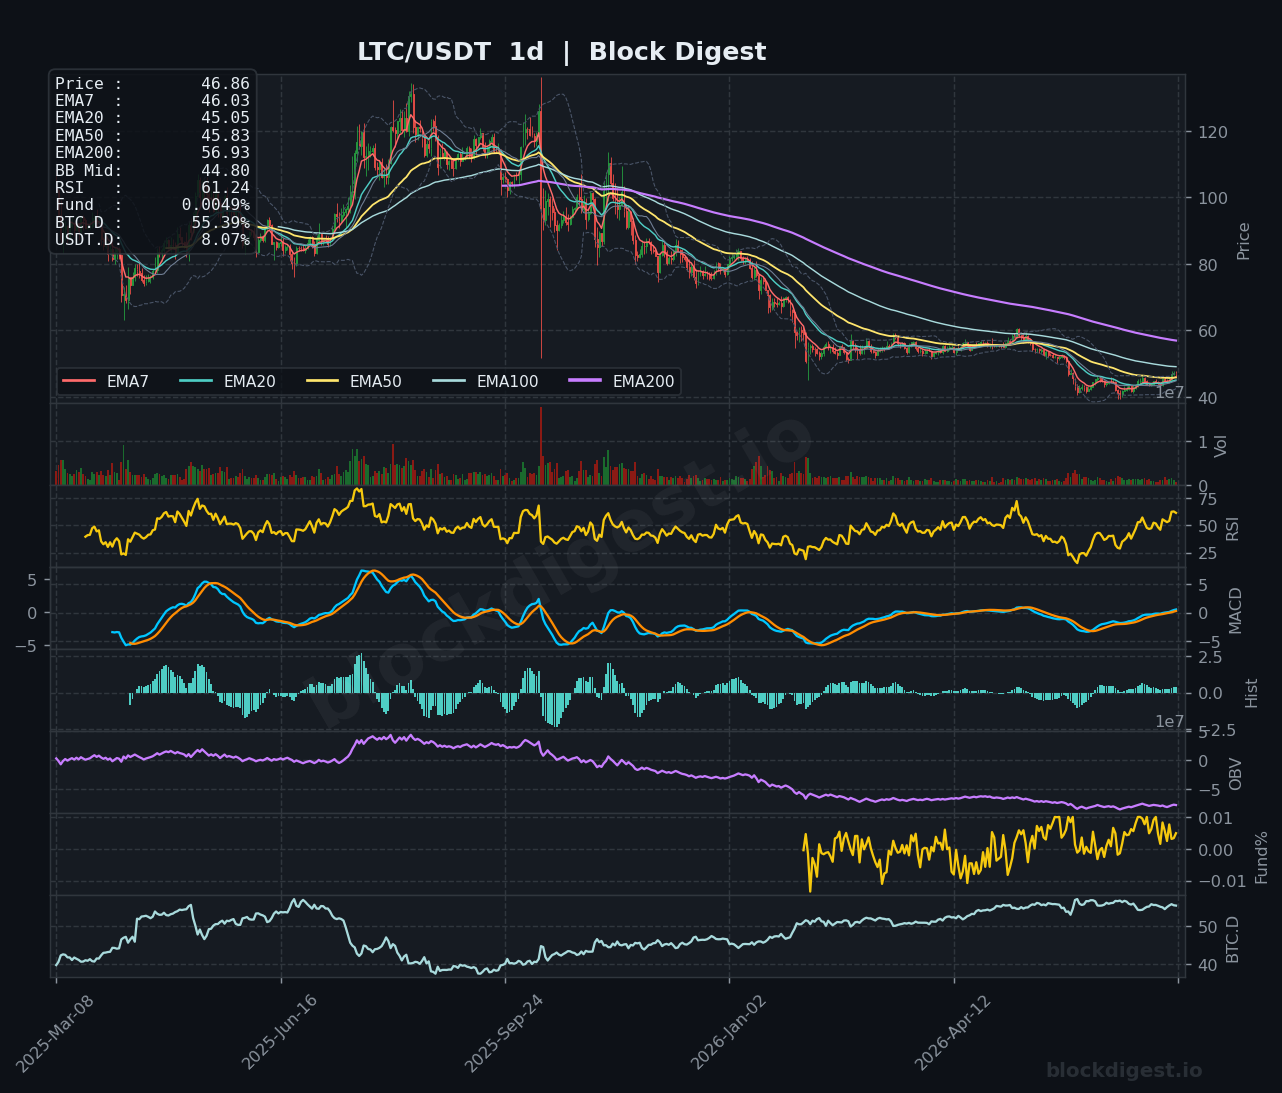
LTC at $46.87 is the clear relative outperformer in today’s roundup, with the daily RSI at 61.24 and the 4h RSI at 59.69 — both in bullish territory and showing the strongest momentum readings across all six coins covered. Price has broken above its short-term EMAs on both the 1h and 4h charts, with the EMA7 ($46.99) and EMA20 ($46.36) now providing dynamic support, and the 4h MACD rising steadily in positive territory. The 1h OBV has ticked meaningfully higher in recent sessions, suggesting genuine buying interest rather than short-covering alone. Resistance sits near $48.00, a level that capped prior recovery attempts; a sustained close above that mark would target the $50–$52 range, while $44.50 represents the key support to defend on any pullback.
TRON (TRX)
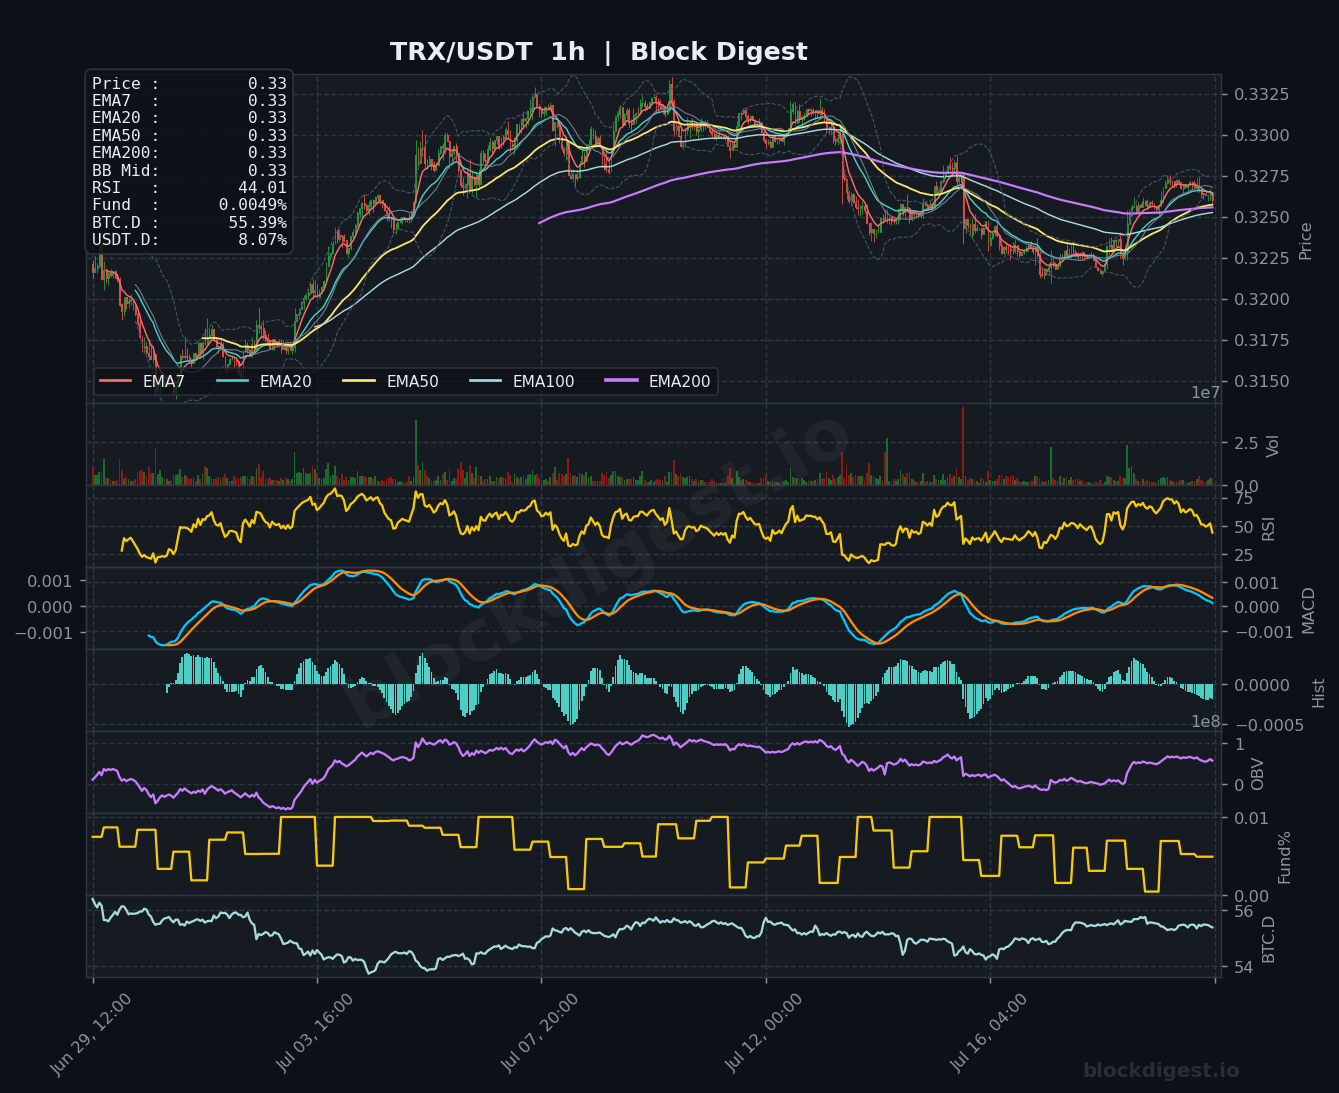
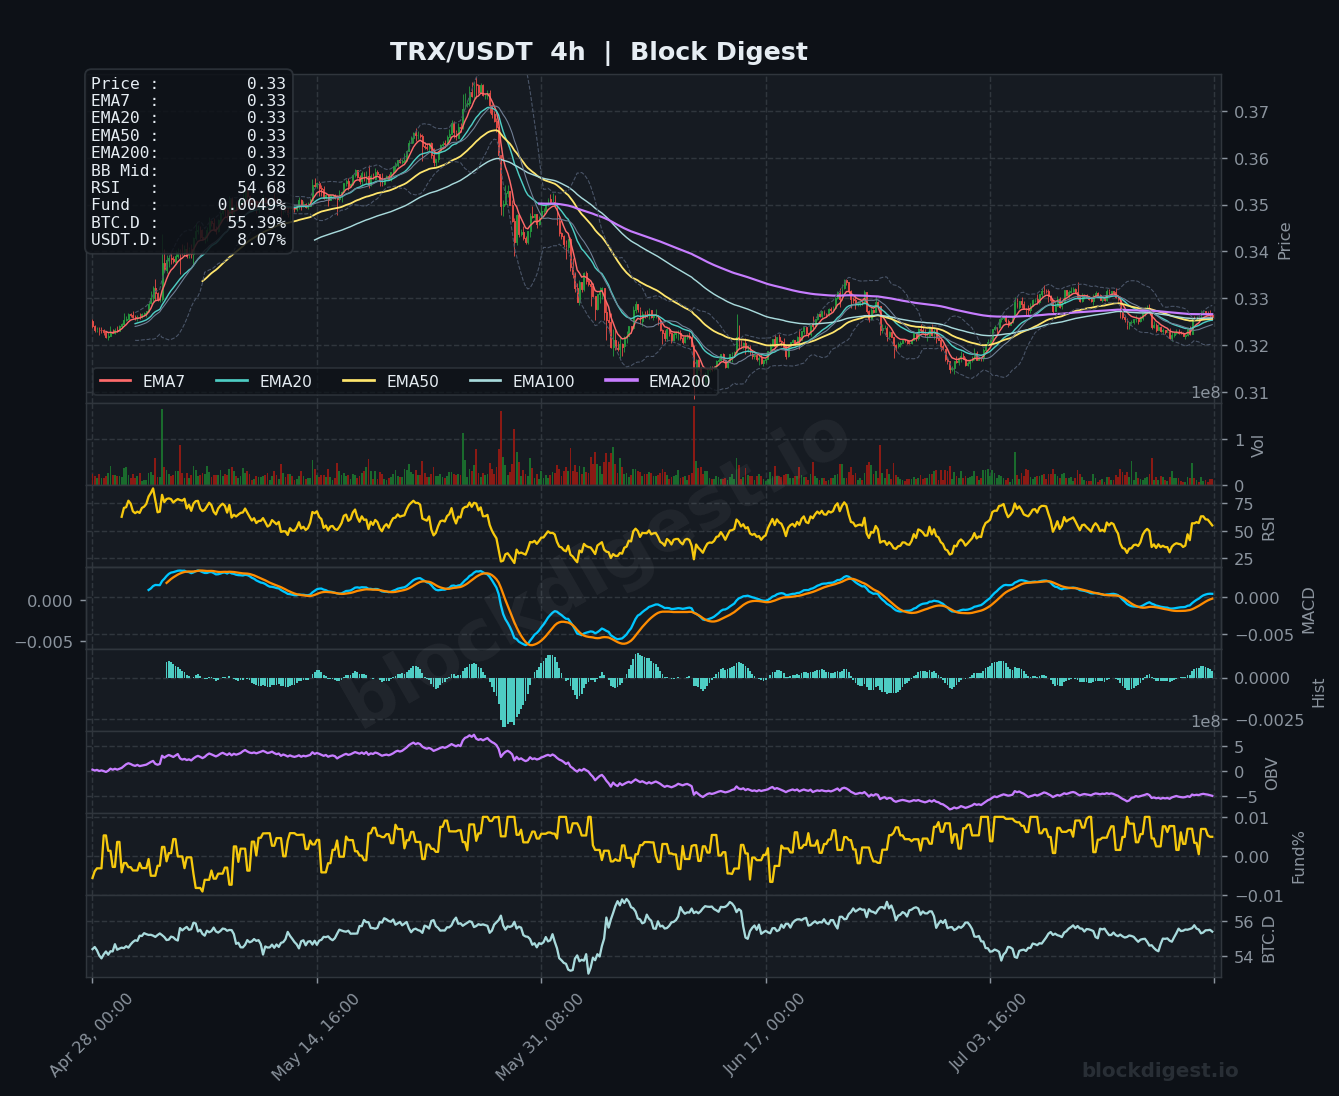
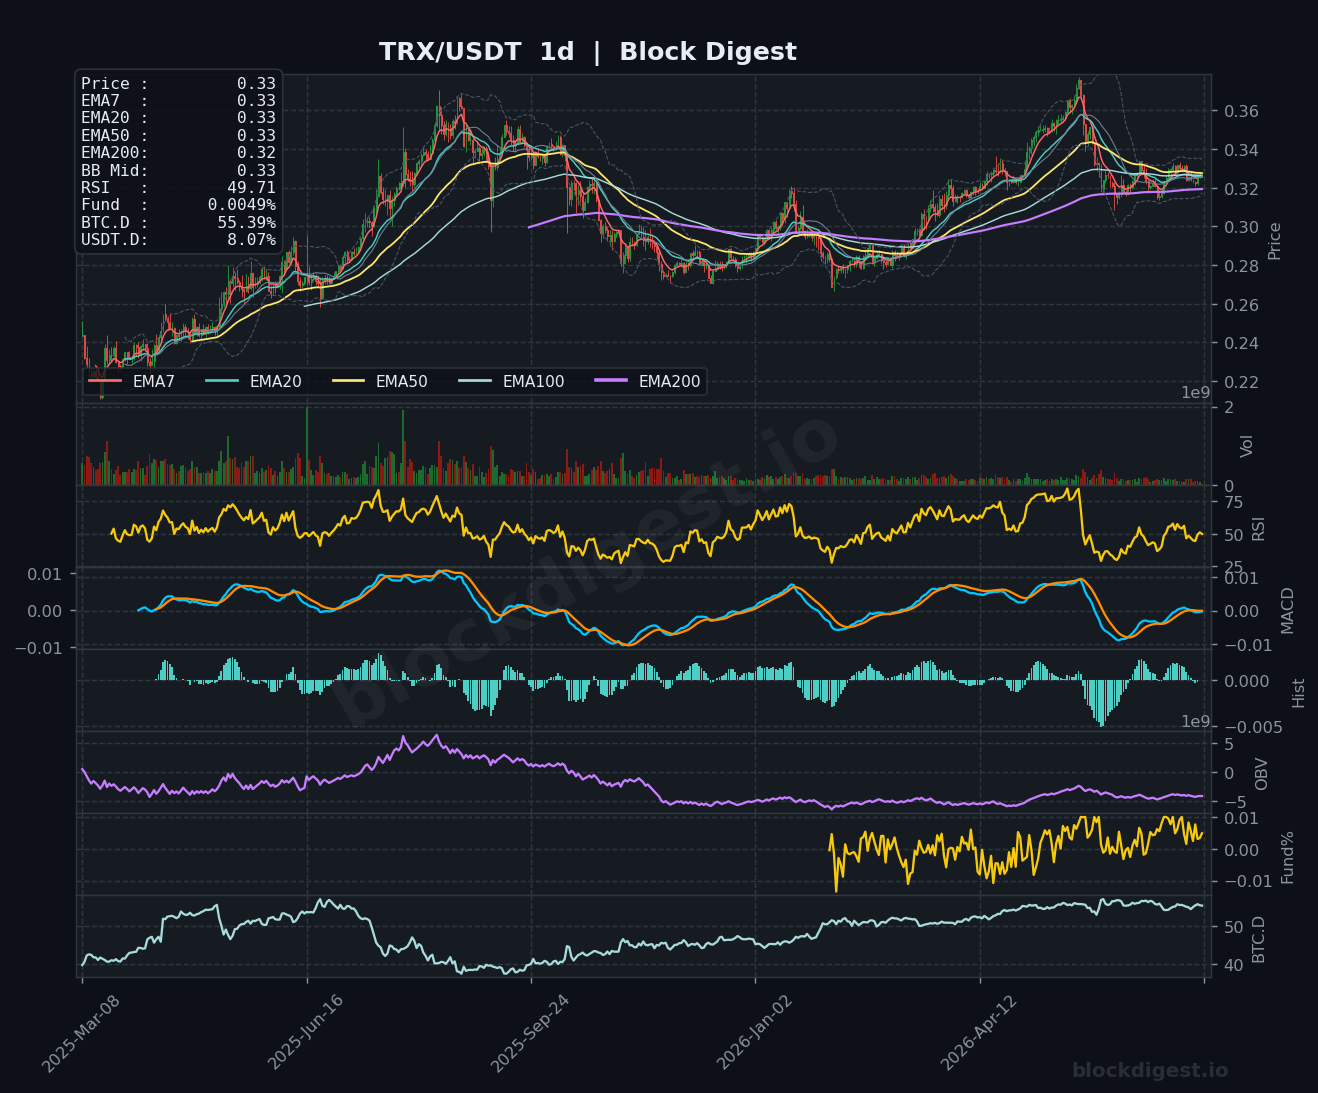
TRX is trading at $0.33, holding a relatively tight range that reflects its historically low-volatility character. The 4h RSI at 54.68 is modestly bullish, and the daily RSI at 49.71 sits essentially at the neutral midpoint, with the daily MACD lines crossing near zero — a setup that could break either way. On the daily chart, TRX notably has its EMA200 at $0.32 acting as support rather than resistance, a structural distinction that sets it apart from most peers in today’s coverage. The 1h OBV trend is recovering from its recent trough, offering a tentatively constructive near-term read. Key resistance is the $0.3325–$0.335 zone seen on the hourly chart; a clean break above $0.335 would open up the $0.345 area, while support is well-defined at $0.320.
Altcoin Outlook
The altcoin landscape as of July 20, 2026 is bifurcated: LTC stands out as the only coin in this cohort displaying genuinely bullish momentum across multiple timeframes, while DOGE and BNB carry the weakest short-term structures. SOL, XRP, and TRX are all caught in neutral-to-bearish consolidation, lacking the catalysts or volume needed to break their respective overhead EMA resistance clusters. With BTC dominance near 55.38% and USDT.D still elevated, the conditions for a broad altcoin rotation remain premature — traders should focus on LTC’s $48 breakout level as a potential leading indicator and watch whether DOGE’s $0.070 support holds, as a failure there could weigh on meme-sector sentiment more broadly. Until BTC dominance shows a sustained rollover, selective, level-specific entries remain the prudent approach across the altcoin space.
Disclaimer: This analysis is for informational purposes only and does not constitute financial advice. Cryptocurrency markets are highly volatile and unpredictable. All trading decisions should be made based on your own research and risk tolerance. Block Digest is not responsible for any financial losses incurred as a result of acting on this content.