Ethereum Daily Analysis: Ethereum Consolidates Between EMA50 Resistance and EMA20 Support
Market Overview
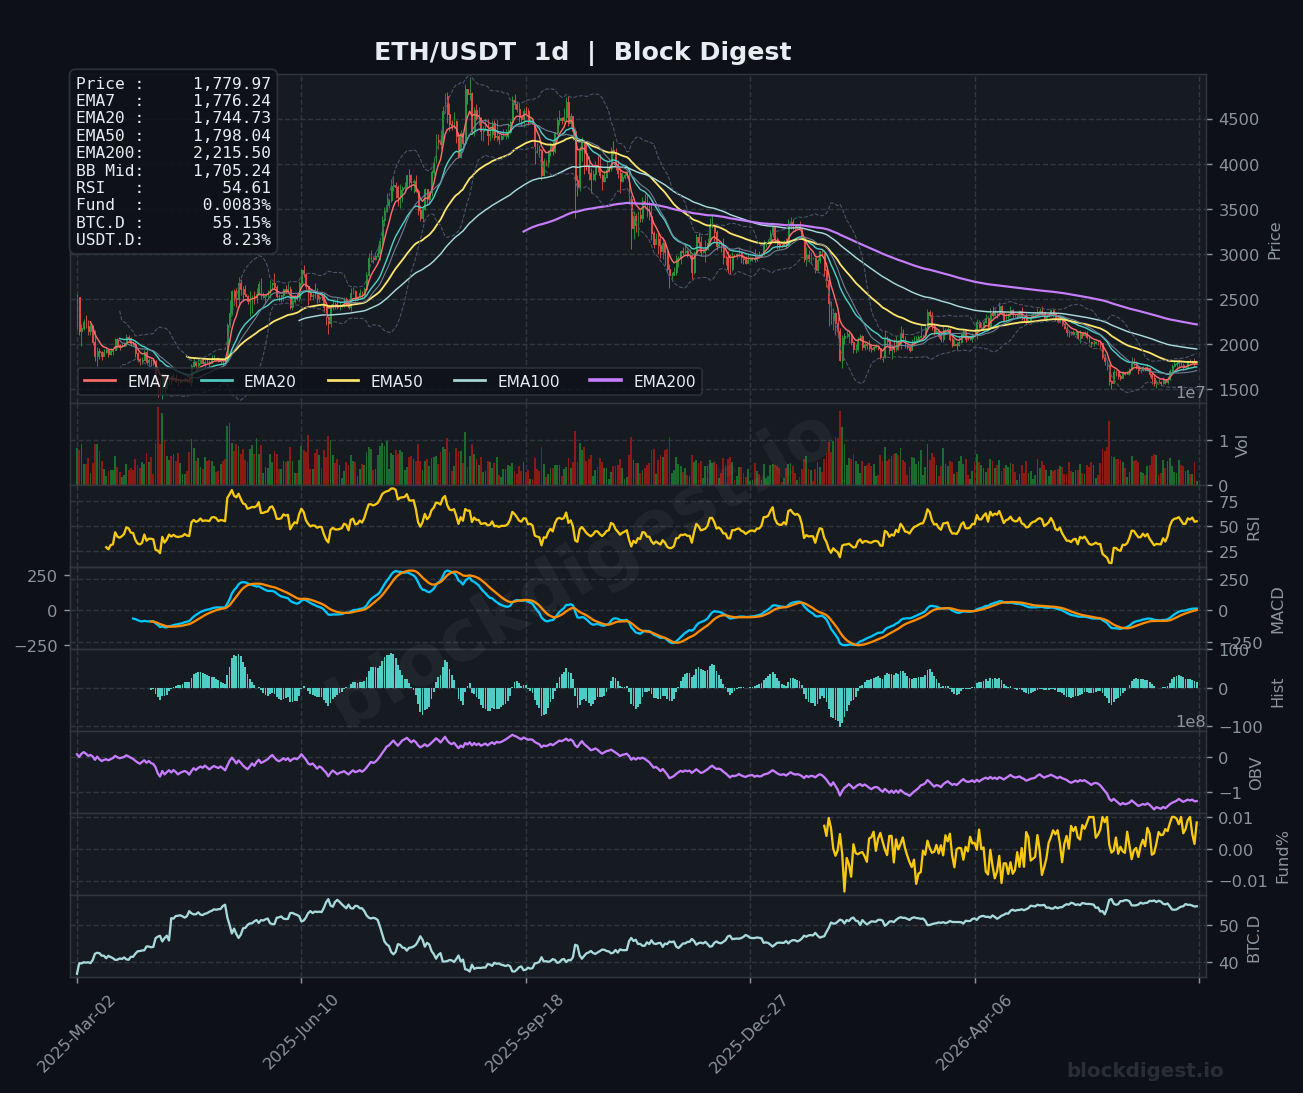
Ethereum is currently trading at $1,779.96, down approximately 1.31% over the past 24 hours, consolidating in a narrow band after a notable recovery from cycle lows. On the daily timeframe, price remains sandwiched between the EMA50 at $1,798.04 — acting as immediate overhead resistance — and the EMA20 at $1,744.73, which has been providing dynamic support during the recent recovery attempt. The daily Bollinger Band midline sits at $1,705.24, well below current price, suggesting the recovery from the deeper lows has been meaningful, though the macro trend remains firmly bearish with the EMA200 still elevated at $2,215.50, a level ETH has not reclaimed in many months. The broader market structure on the daily chart reflects a prolonged downtrend that is only now showing tentative stabilization signals.
Multi-Timeframe Confluence
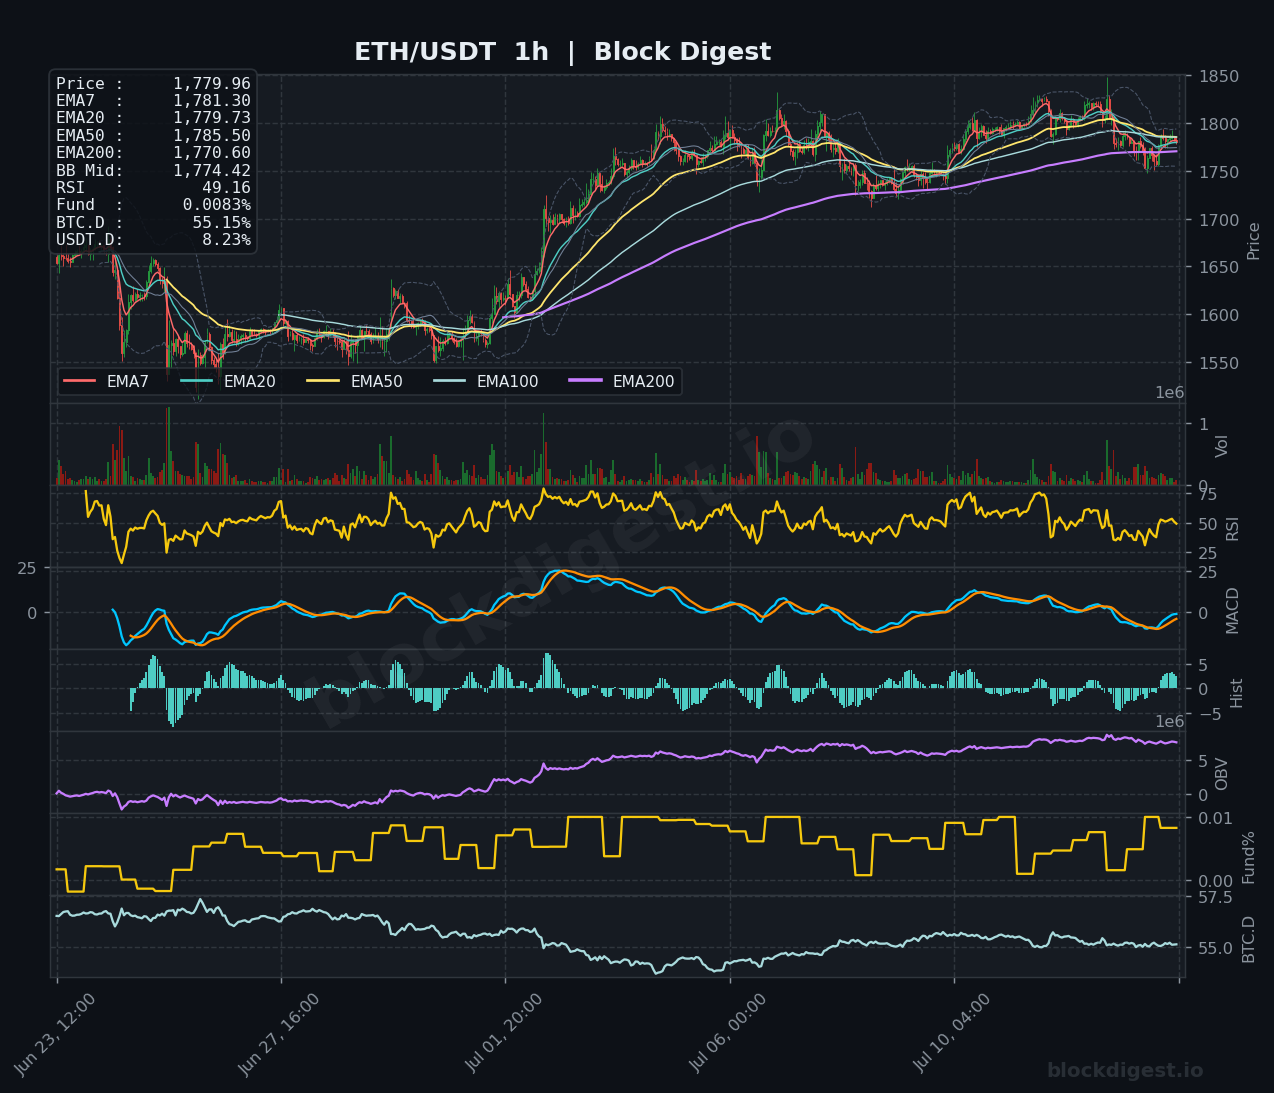
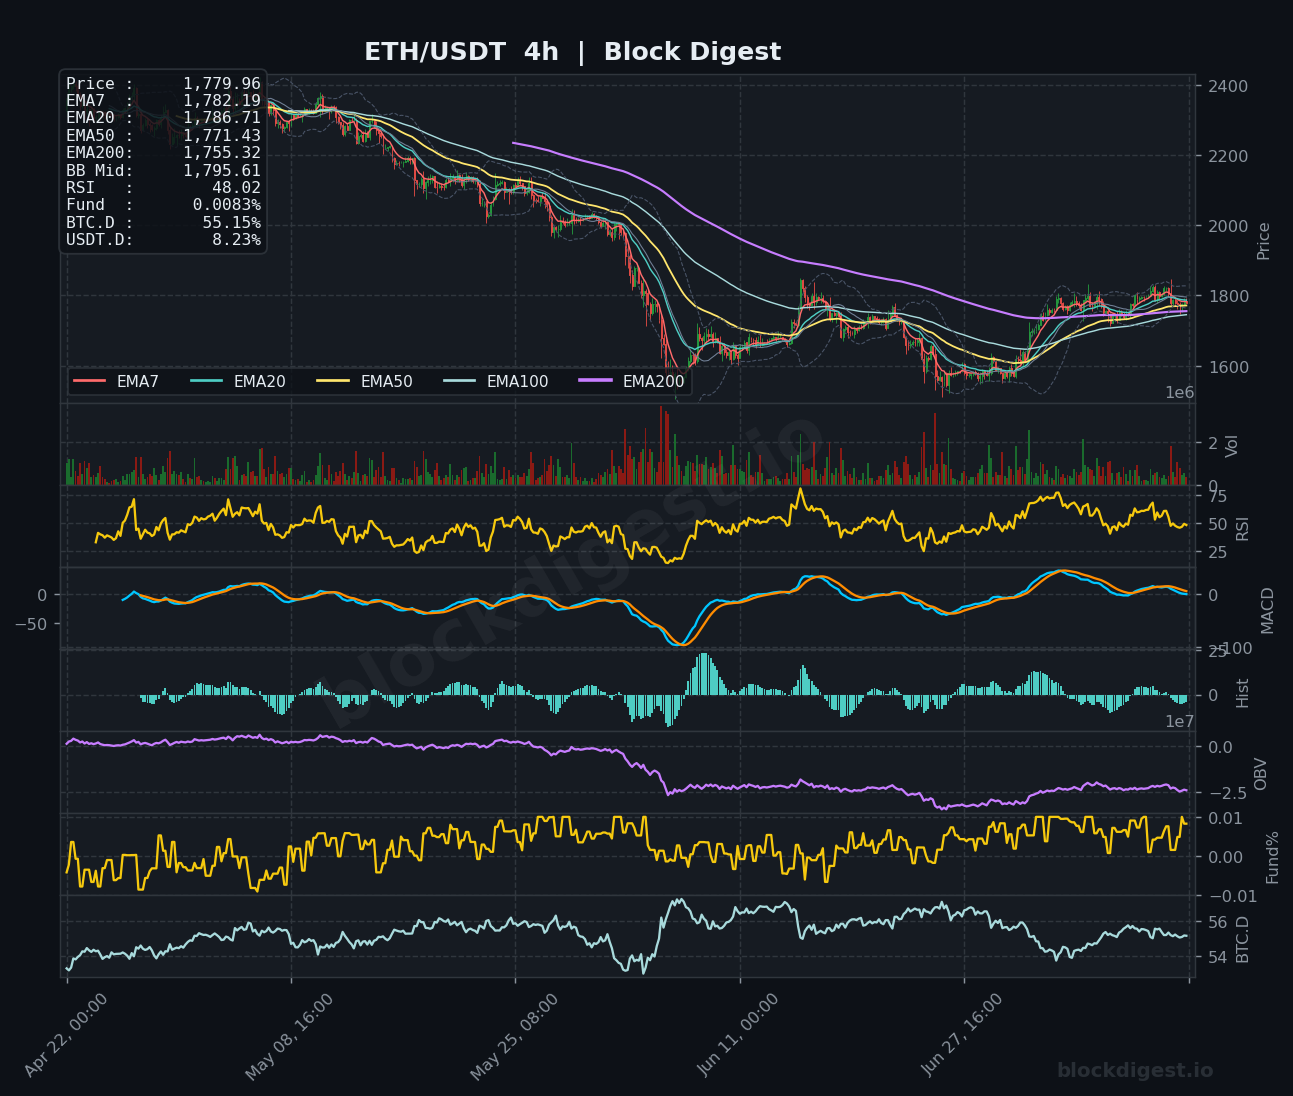
On the 1-hour chart, ETH is tightly clustered around its short-term EMAs — EMA7 at $1,781.30, EMA20 at $1,779.73, and EMA50 at $1,785.50 — indicating price compression and indecision at current levels. The 4-hour chart shows a more constructive picture, with the EMA50 ($1,771.43) and EMA200 ($1,755.32) both positioned below price, providing a layered support structure that has held through the recent geopolitical-driven selloff. However, the 4-hour BB midline at $1,795.61 remains above current price, reinforcing the idea that ETH has not yet convincingly reclaimed its intermediate mean. Across all three timeframes, the $1,755–$1,771 zone represents a strong confluence of support, while the $1,795–$1,800 zone presents consistent resistance.
Key Levels to Watch
- Resistance: $1,795–$1,800 — The 4-hour BB midline ($1,795.61) aligns with the psychologically significant $1,800 round number and recent swing highs, creating a dense supply zone that has consistently capped recovery attempts.
- Resistance: $1,798–$1,800 — The daily EMA50 at $1,798.04 is a critical macro-level resistance; a sustained close above this level on the daily would represent a meaningful structural shift in the medium-term trend.
- Resistance: $1,840–$1,850 — The upper Bollinger Band on the 1-hour chart and recent local highs in this range represent the next meaningful target should the $1,800 breakout materialize.
- Support: $1,771 — The 4-hour EMA50 provides the first meaningful dynamic support on a pullback and has absorbed selling pressure in recent sessions.
- Support: $1,755 — The 4-hour EMA200 at $1,755.32 marks a deeper but critical support zone; a loss of this level would suggest the recovery structure is breaking down.
- Support: $1,705–$1,720 — The daily BB midline at $1,705.24 aligns with prior consolidation lows and would represent a significant capitulation level if reached.
Momentum & On-Chain Signals
The RSI readings reflect a broadly neutral-to-cautious market: the 1-hour RSI is at 49.16 and the 4-hour RSI sits at 48.02, both hovering just below the equilibrium 50 level, indicating neither buyers nor sellers have firm control in the near term. The daily RSI at 54.61 is the most constructive reading across timeframes, suggesting the higher timeframe recovery still has some residual momentum. The MACD on the 4-hour chart shows the signal and MACD lines converging near zero, with a mildly bearish histogram, consistent with a loss of short-term upside momentum. OBV on the 1-hour chart continues to trend higher, suggesting underlying accumulation is occurring even as price stalls — a mildly positive divergence worth monitoring — while the 4-hour OBV remains depressed relative to prior highs, reflecting the sustained distribution that characterized the broader decline.
BTC Dominance & Market Sentiment
BTC dominance is currently elevated at 55.15%, reflecting a continued flight to relative safety within the crypto ecosystem as macro headwinds — including the geopolitical oil shock and renewed U.S.-Iran tensions — push investors toward the perceived safety of Bitcoin over altcoins. USDT dominance at 8.23% is notably elevated, indicating that a significant portion of market participants remain in cash or stablecoins, unwilling to deploy capital into risk assets while the Fear & Greed Index sits at 22 (Extreme Fear). For ETH specifically, the elevated BTC.D and USDT.D combination is a headwind — meaningful ETH outperformance typically requires both metrics to decline as capital rotates into altcoins, and that rotation does not appear imminent.
Risk Scenarios
- Bullish case: A decisive 4-hour close above $1,800, accompanied by expanding volume and RSI on both the 1-hour and 4-hour charts pushing above 55, would confirm a breakout from the current compression zone, opening a path toward the $1,840–$1,850 resistance cluster. Continued institutional accumulation, such as the expansion of BitMine’s ETH treasury, could provide fundamental support for this move if macro conditions stabilize.
- Bearish case: A breakdown below the 4-hour EMA200 at $1,755.32, particularly if accompanied by a BTC.D spike above 56% and escalating macro risk-off flows, would invalidate the current recovery structure and expose ETH to a retest of the $1,705–$1,720 region and potentially lower.
Outlook
ETH is at a critical inflection point as of July 14, 2026, caught between a constructive daily RSI recovery and bearish macro headwinds from geopolitical tensions and a risk-off market environment. The directional bias over the next 24–48 hours leans cautiously bearish-to-neutral, given that price remains below the daily EMA50 ($1,798.04), BTC dominance is elevated, and the broader Fear & Greed Index sits in Extreme Fear territory. The $1,795–$1,800 zone is the key short-term trigger to watch — bulls need a confirmed break and hold above this level to shift the narrative, while a slip below $1,755 would signal renewed downside pressure. Until macro conditions improve and ETH reclaims the daily EMA50 with conviction, the path of least resistance remains sideways-to-lower.
Disclaimer: This analysis is for informational purposes only and does not constitute financial advice. Cryptocurrency markets are highly volatile and unpredictable. All trading decisions should be made based on your own research and risk tolerance. Block Digest is not responsible for any financial losses incurred as a result of acting on this content.