
Market Context
The broader altcoin market is trading under notable pressure as of July 13, 2026, with BTC dominance holding firm at 55.14% — a level that continues to suppress meaningful capital rotation into alternative assets. USDT dominance at 8.18% reflects a still-elevated cash-on-the-sidelines posture, signaling that risk appetite remains cautious despite the $2.2 trillion total market cap and a recent snap in BTC ETF outflows. While the pending CLARITY Act has injected some legislative optimism into sentiment, the persistent negative Coinbase Premium suggests US-based demand remains structurally weak, leaving altcoins vulnerable to further short-term downside.
Solana (SOL)
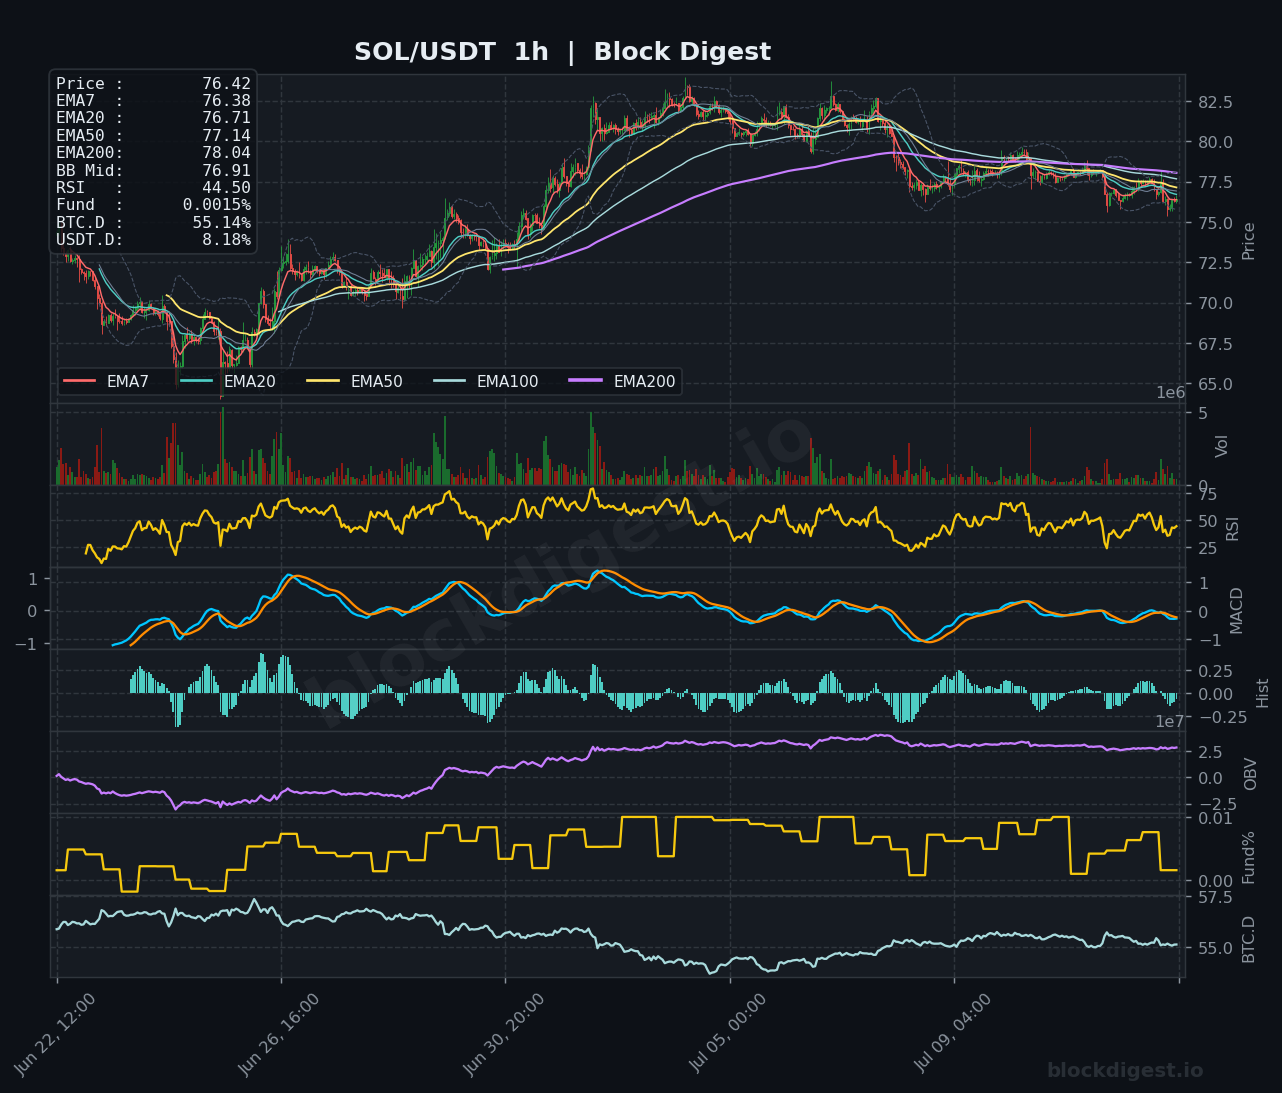
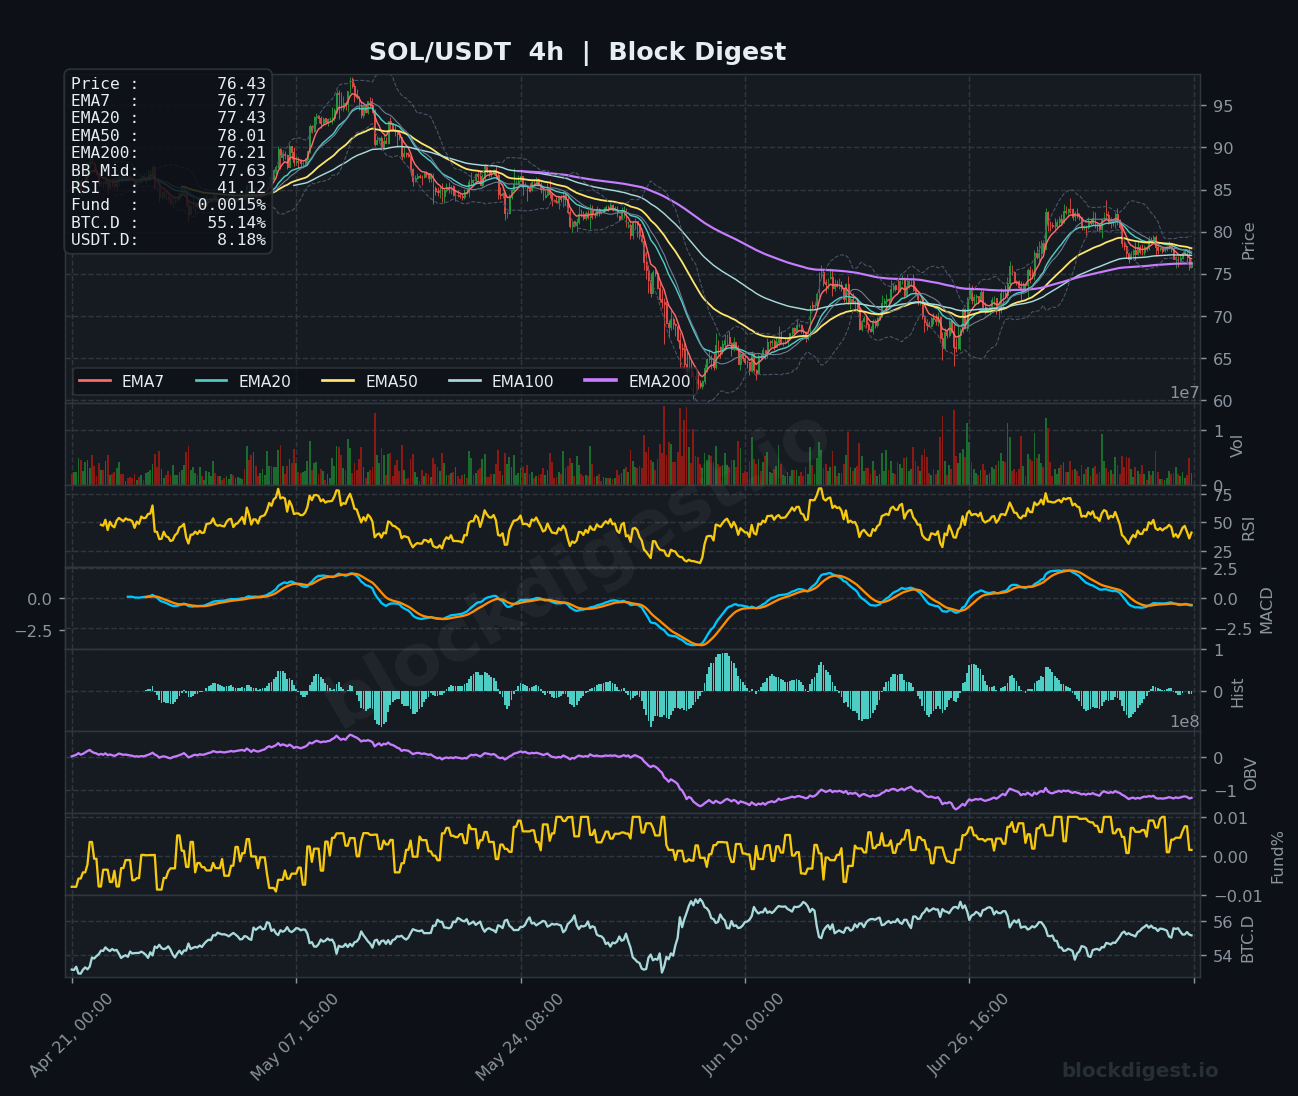
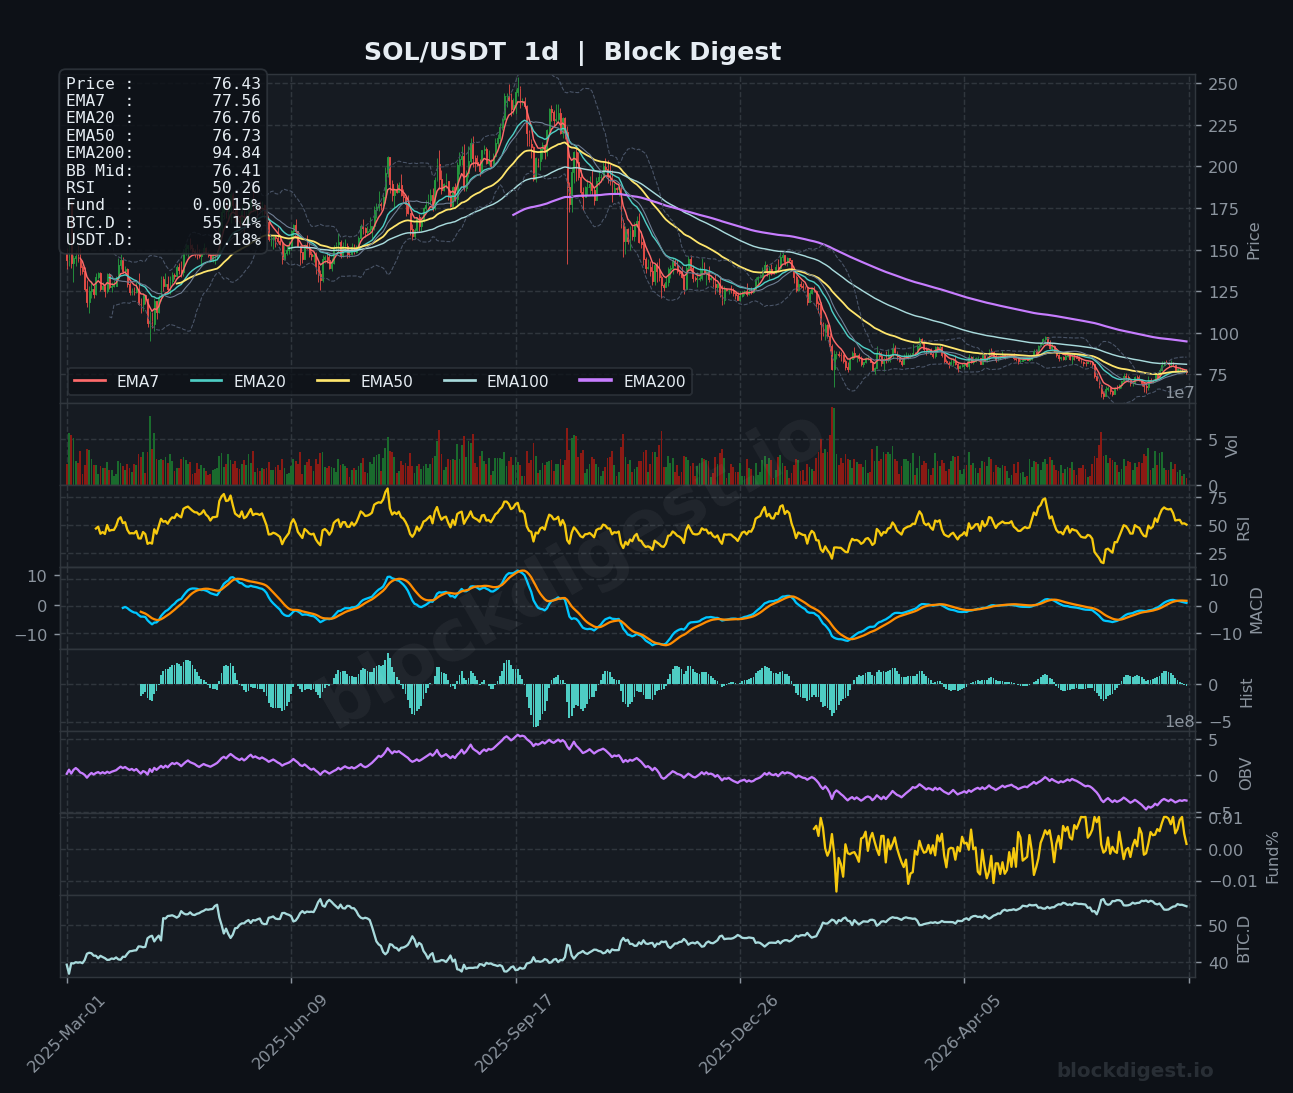
SOL is trading around $76.42, positioned below its EMA50 ($77.14) and EMA200 ($78.04) on the 1-hour chart, confirming near-term bearish pressure. On the 4-hour timeframe, RSI sits at 41.12 and the MACD remains marginally negative, reflecting a recovery attempt from the mid-$60s lows that has stalled just beneath key moving average resistance clustered between $77 and $78. The daily chart paints a more sobering picture — price is trading well below the EMA200 near $94.84, and OBV has been in a persistent downtrend since the cycle peak, indicating sustained distribution. A reclaim of $78 on a closing basis is the minimum requirement before any bullish bias can be considered; failure to hold $75 opens the door toward the $70–$72 support zone.
XRP (XRP)
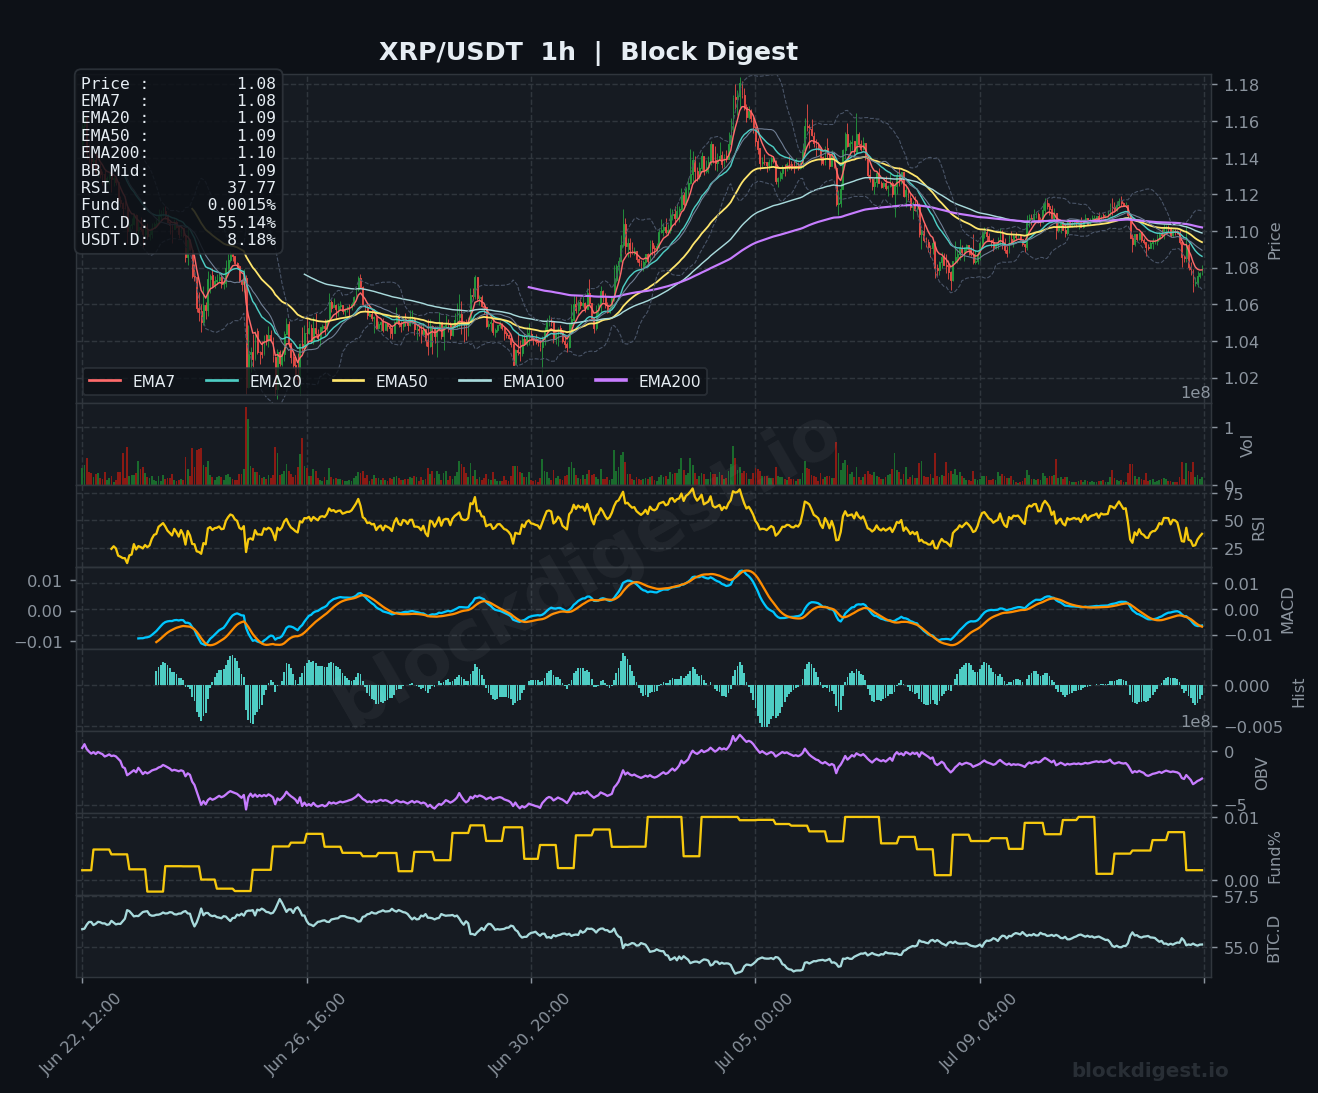
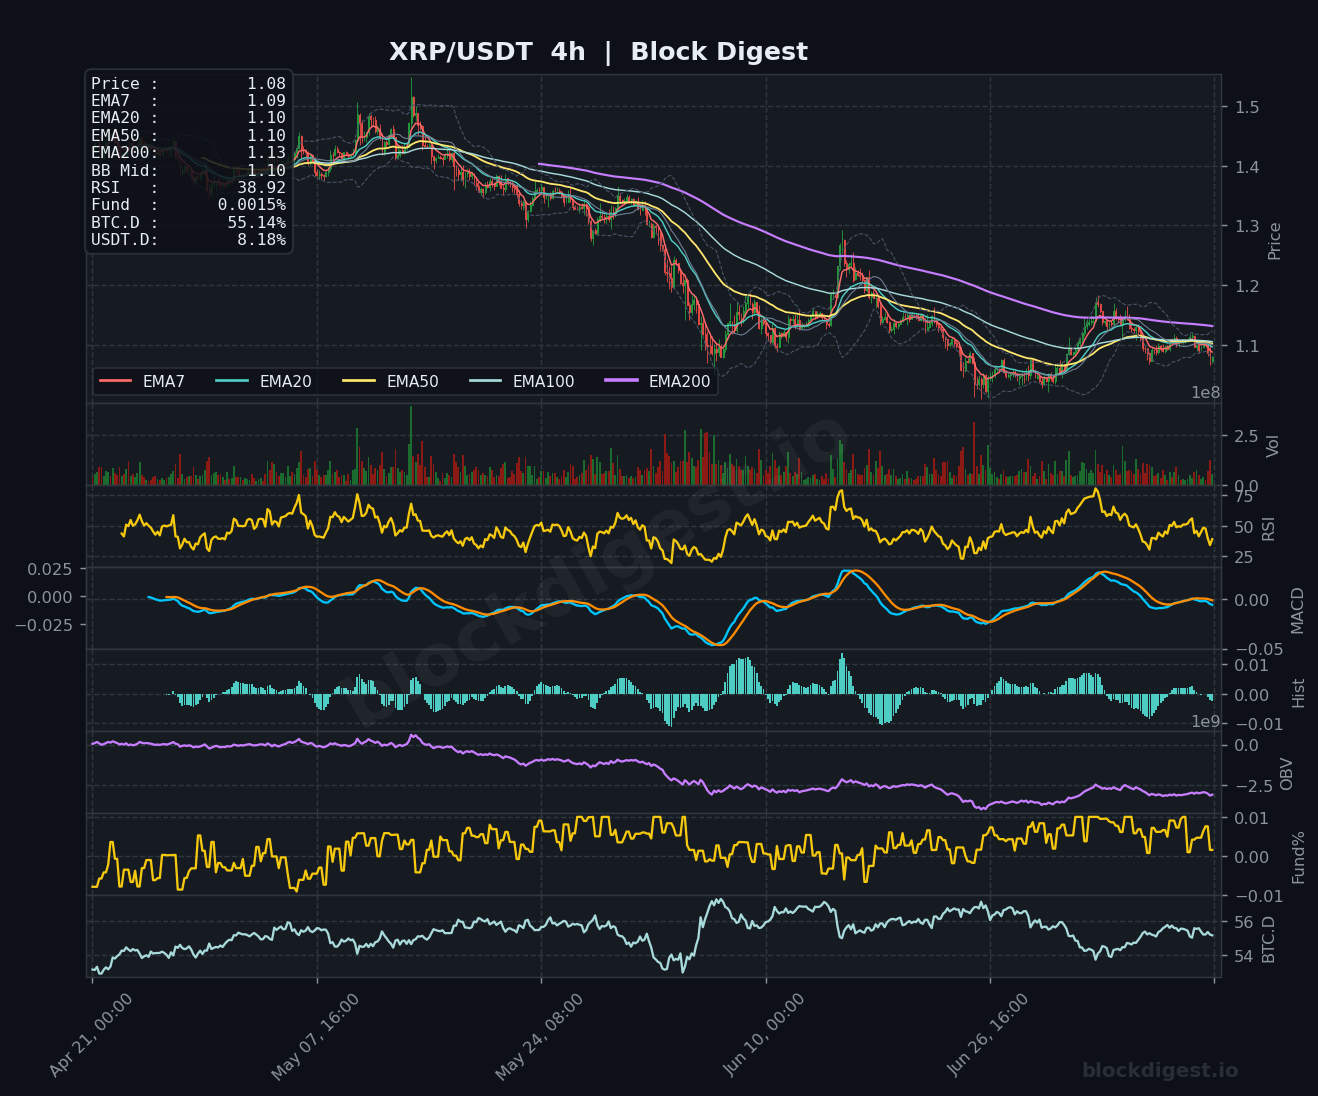
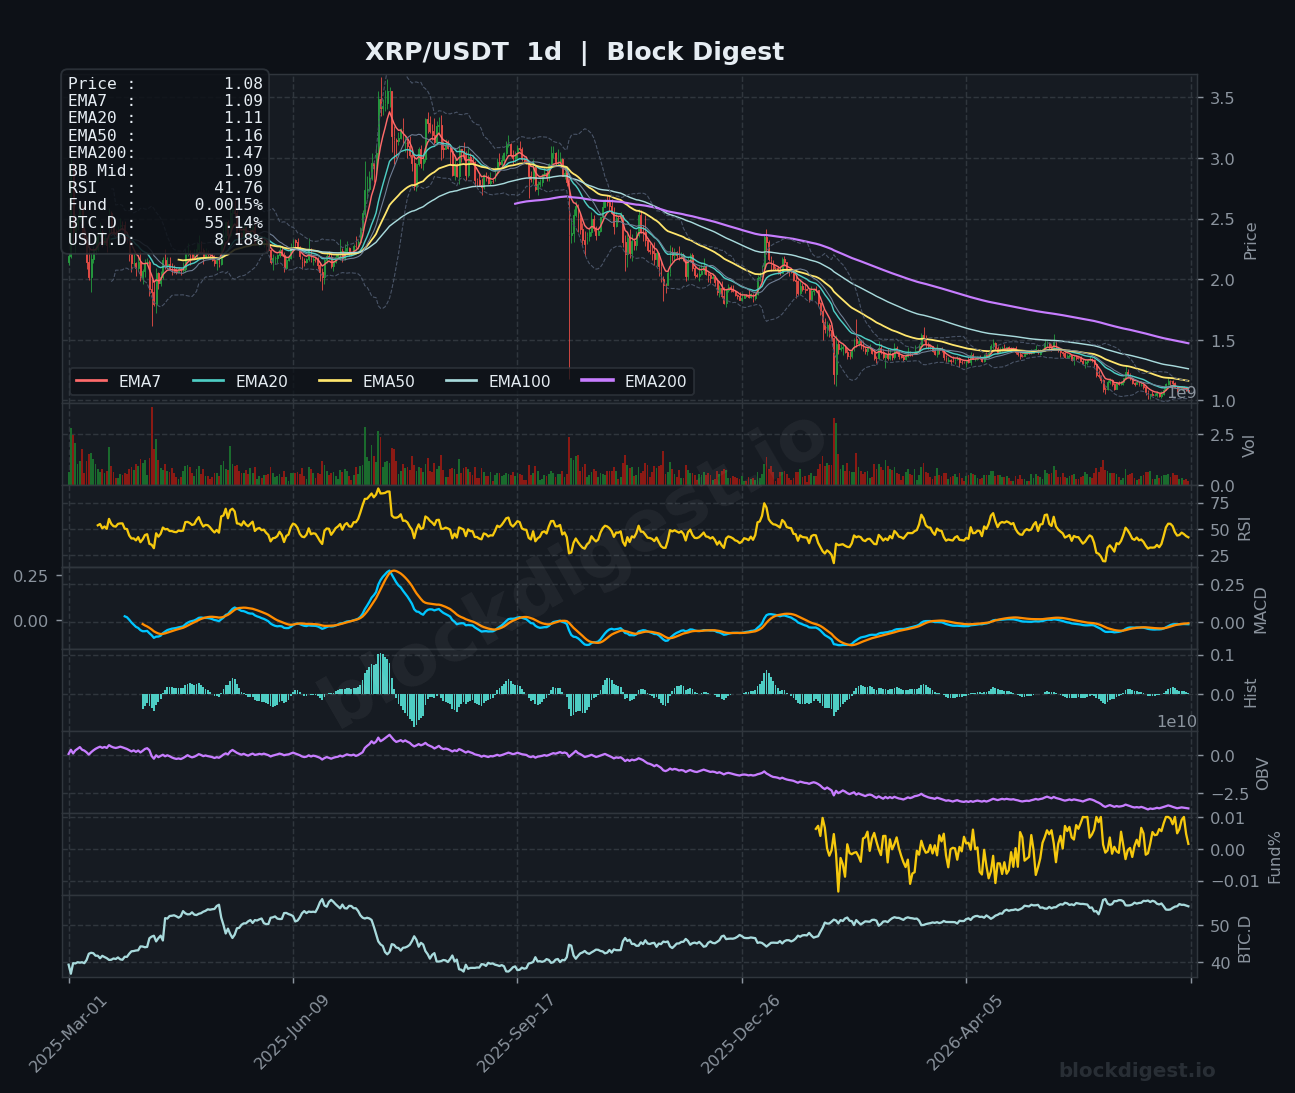
XRP is trading at $1.08, with all short-term EMAs (EMA7 at $1.08, EMA20 at $1.09, EMA50 at $1.09) stacked in bearish alignment above price on the 1-hour chart, while RSI at 37.77 approaches oversold territory without yet triggering a convincing bounce. The 4-hour chart shows RSI at 38.92 and a MACD that has been unable to sustain positive crossovers, with OBV continuing to decline — a sign that sell-side volume is dominating recoveries. On the daily timeframe, XRP remains in a well-defined downtrend from its cycle highs above $3.00, with the EMA50 at $1.16 and EMA200 at $1.47 acting as formidable overhead resistance. Despite the XRP Ledger ecosystem being flagged as a top gainer today, the technical structure argues for caution; bulls need to reclaim $1.12 with conviction to shift short-term momentum.
BNB (BNB)
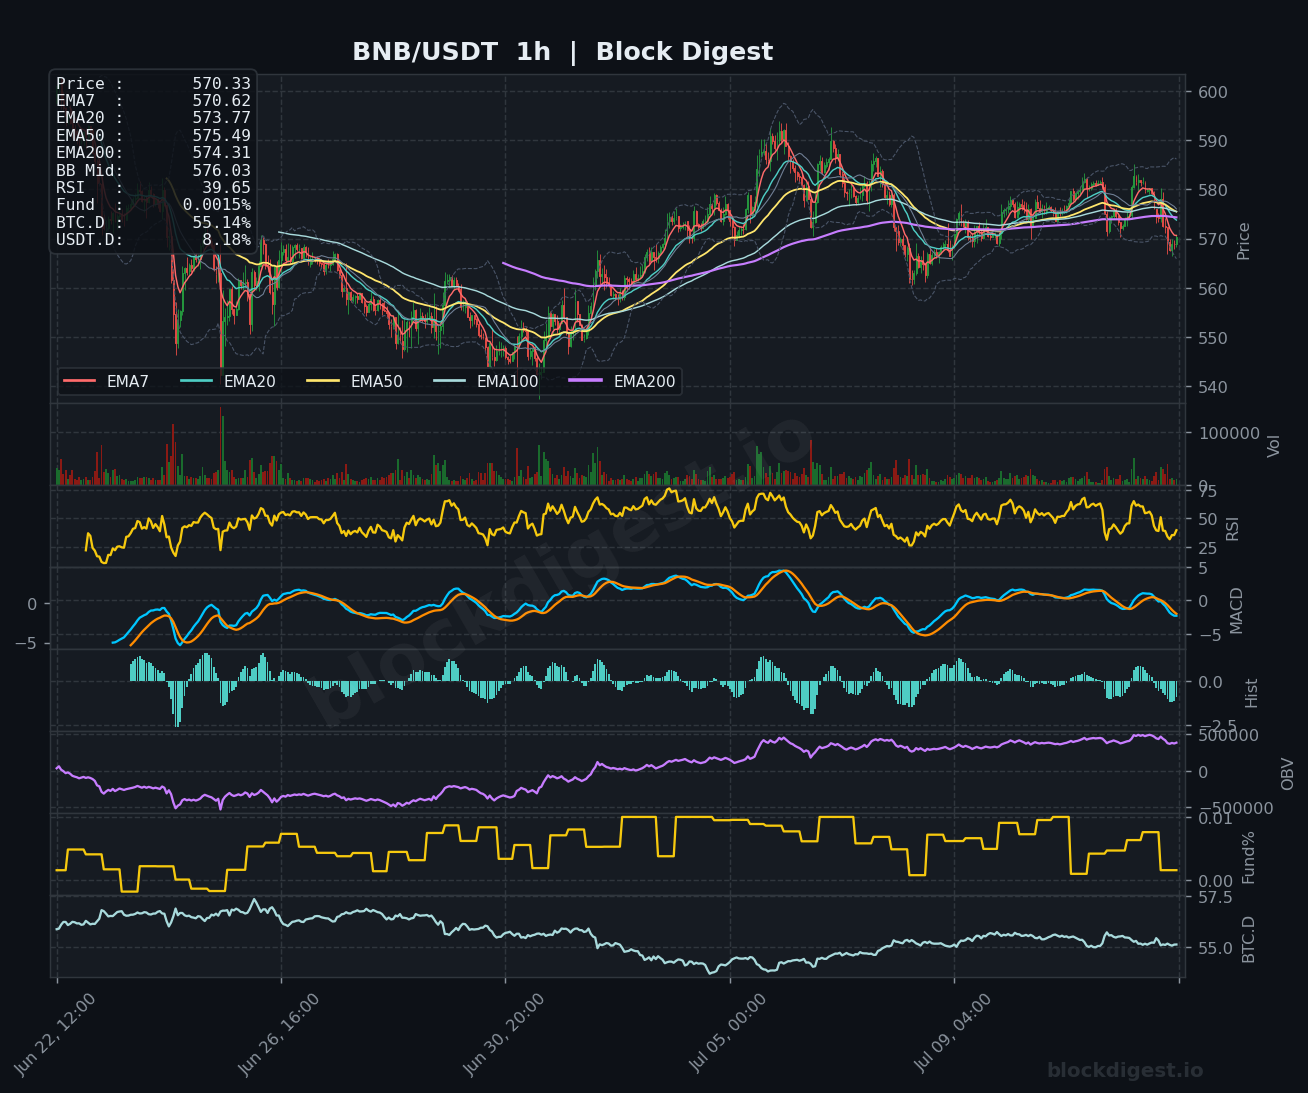
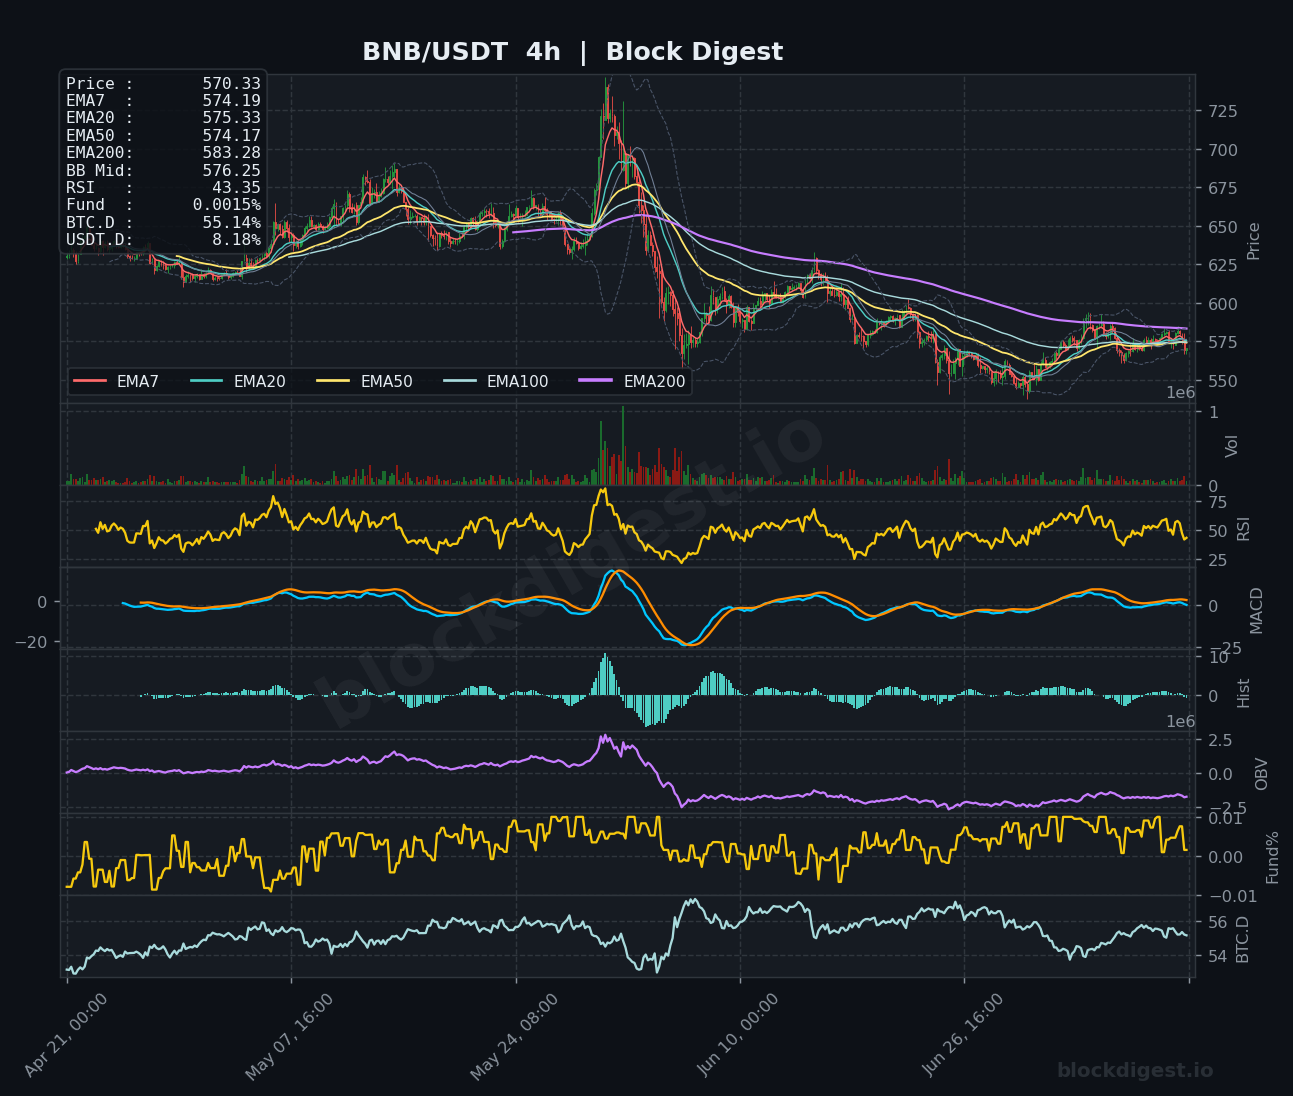
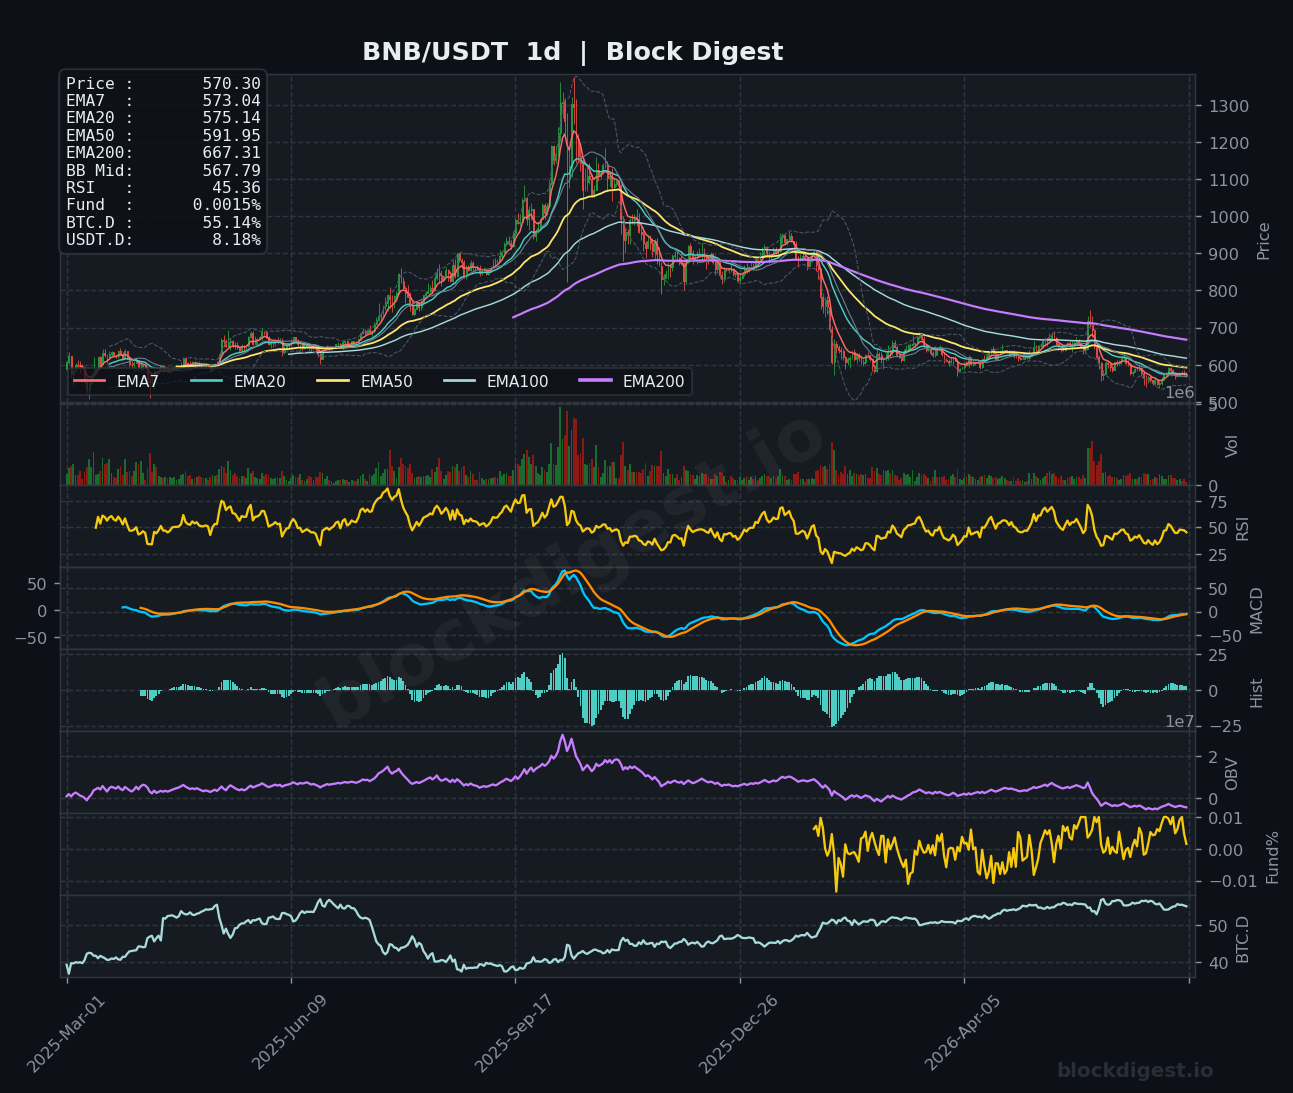
BNB is trading at approximately $570, the lone green major on the day with a 0.60% gain, though technical indicators temper enthusiasm. On the 1-hour chart, price is trading below its EMA20 ($573.77), EMA50 ($575.49), and EMA200 ($574.31), with RSI at 39.65 and MACD slightly negative — suggesting the intraday uptick lacks meaningful momentum behind it. The 4-hour chart reveals a clearer picture of the broader correction from the spike highs above $725, with the MACD hovering near zero and OBV still depressed, though showing tentative stabilization. The daily chart has price contending with the EMA20 ($575.14) as immediate resistance, with the EMA50 at $591.95 being the next significant hurdle; the $560–$565 area represents near-term support, and a sustained hold above $575 would be the first sign of a genuine trend shift.
Dogecoin (DOGE)
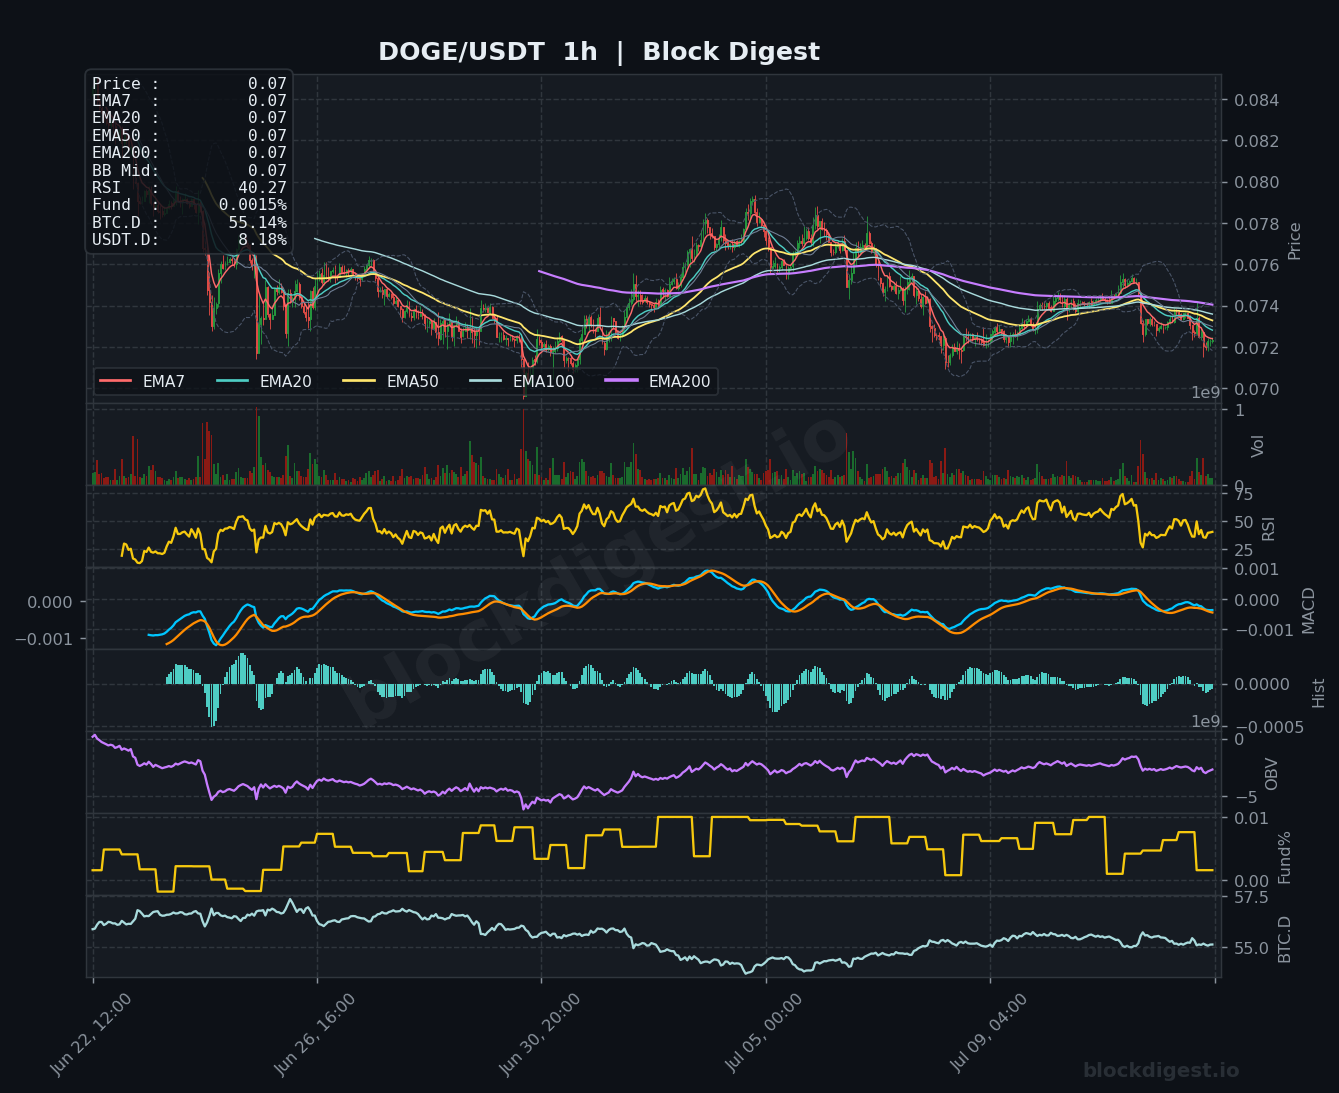
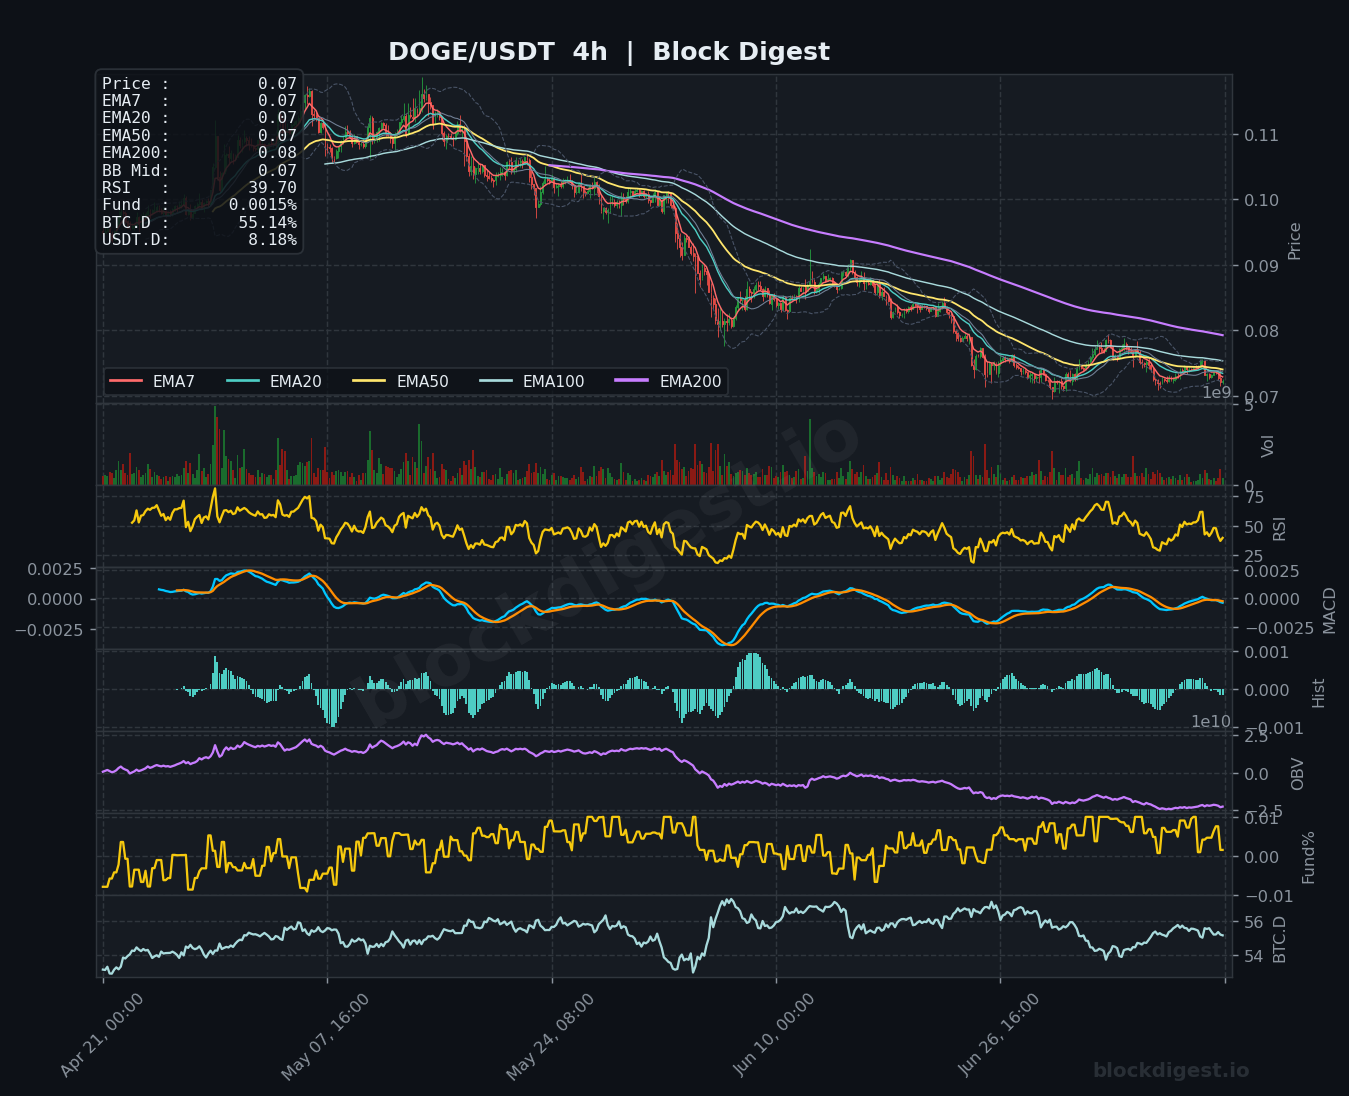
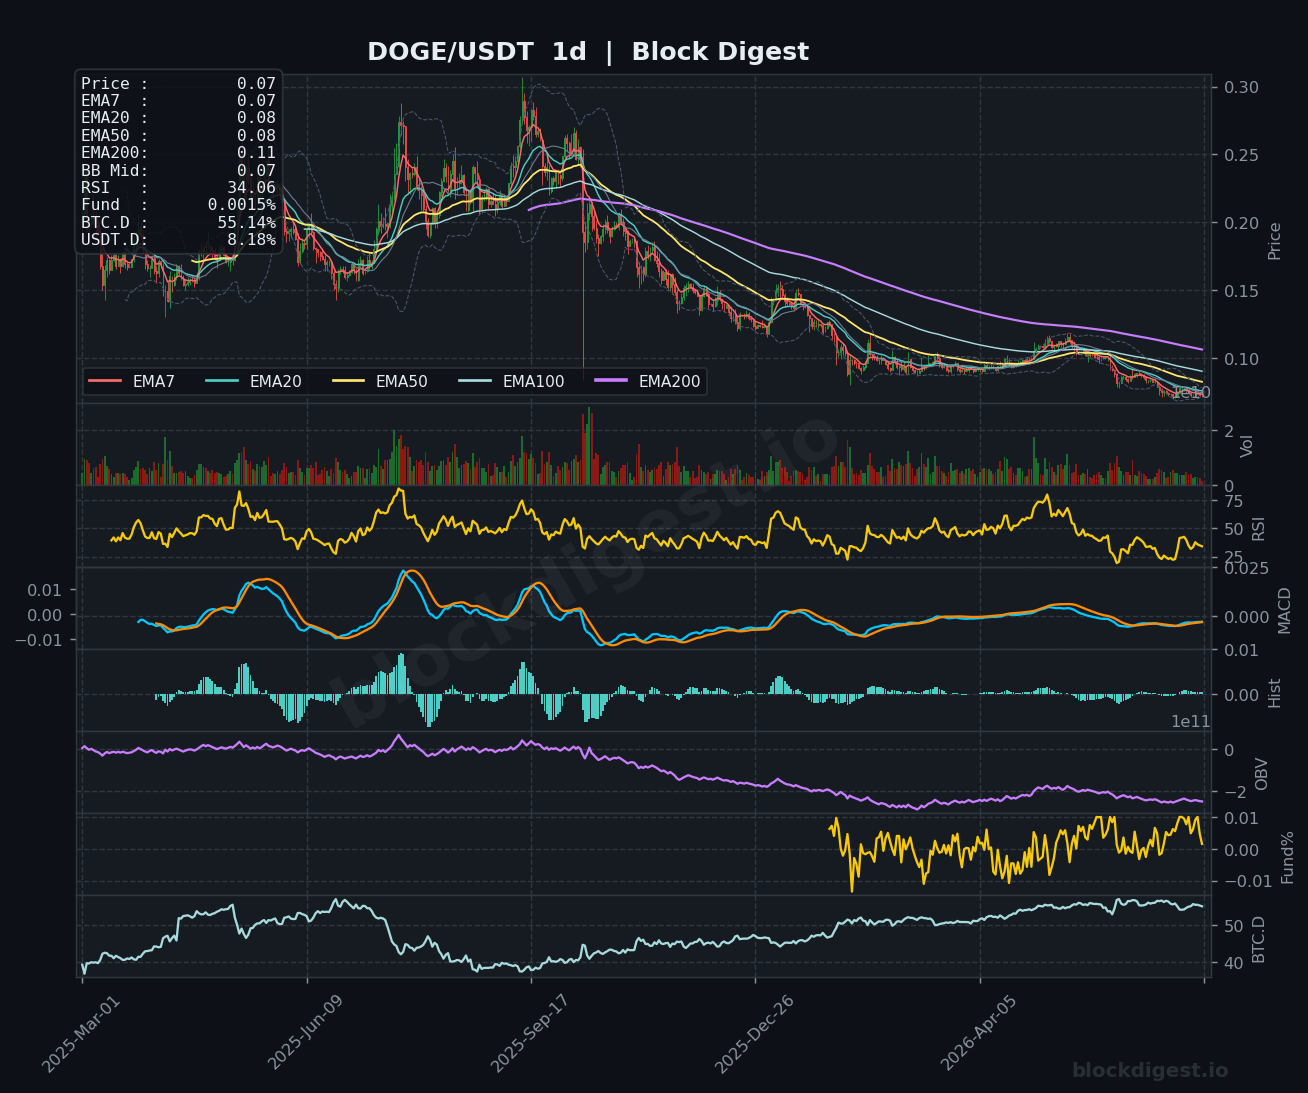
DOGE is the weakest performer in today’s lineup, trading at $0.07 and down over 2%, with all EMAs on the 1-hour chart compressed around the $0.07 handle in a bearish cluster and RSI at 40.27 failing to show any recovery impulse. On the 4-hour chart, the downtrend from the $0.11 highs is clearly intact, with EMAs in full bearish order and RSI at 39.70 — dangerously close to the oversold threshold but without a technical catalyst to suggest a floor is forming. The daily chart is arguably the most discouraging of all coins covered today, with RSI at a deeply oversold 34.06, OBV in a persistent decline, and price hugging the lower Bollinger Band — a posture that indicates capitulatory selling rather than accumulation. While an oversold bounce is statistically possible, the path of least resistance remains lower; $0.072 is immediate support, with $0.068 the next level of significance on any continuation lower.
Litecoin (LTC)
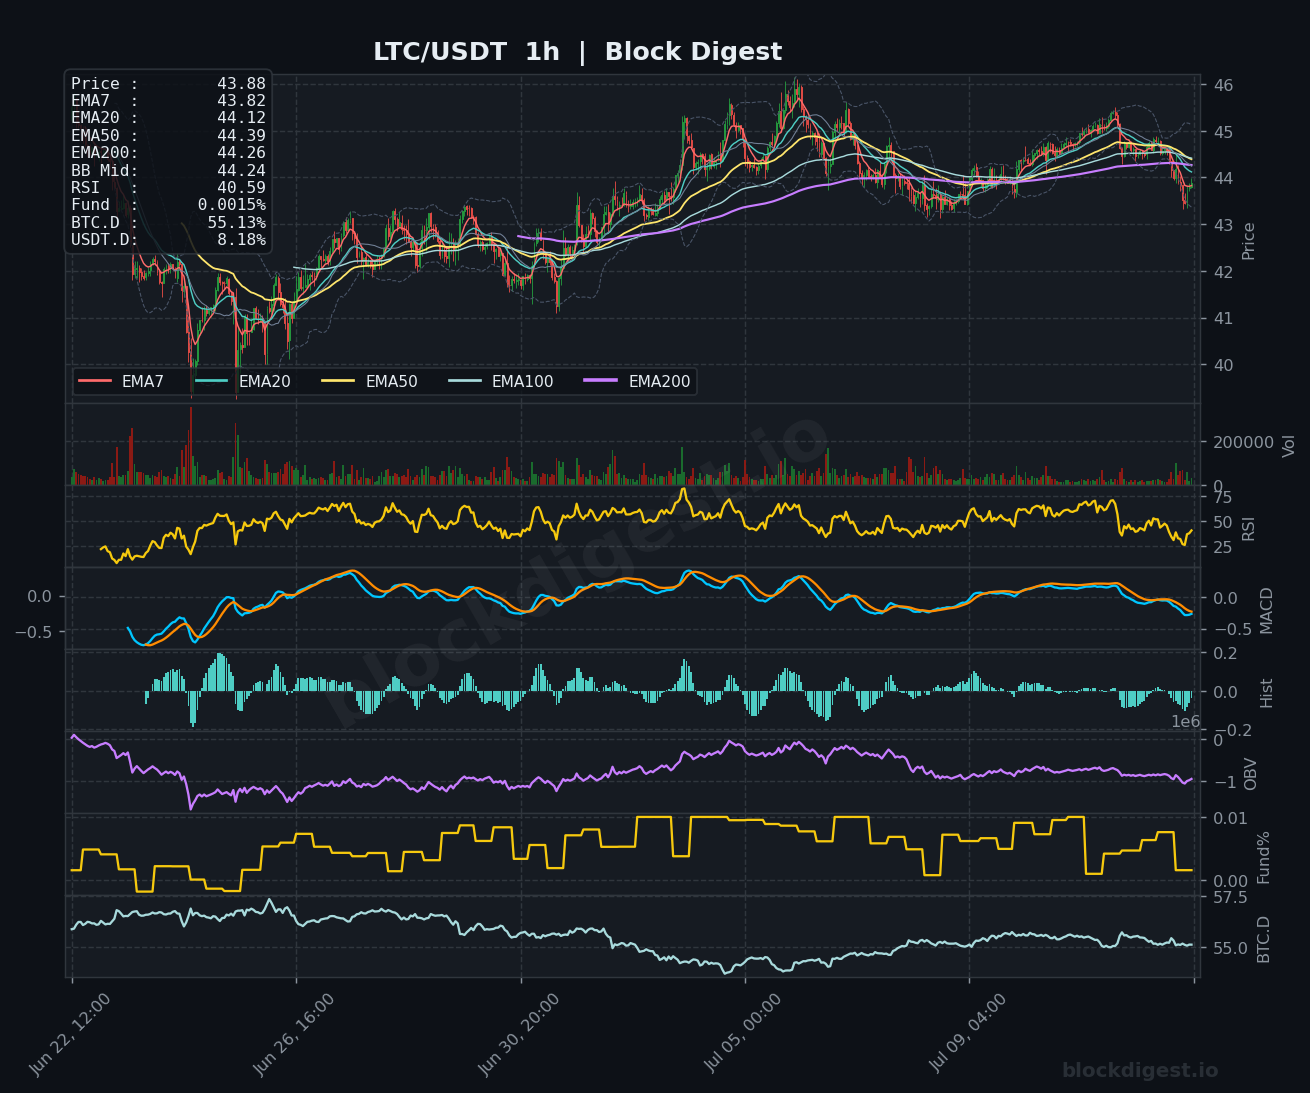
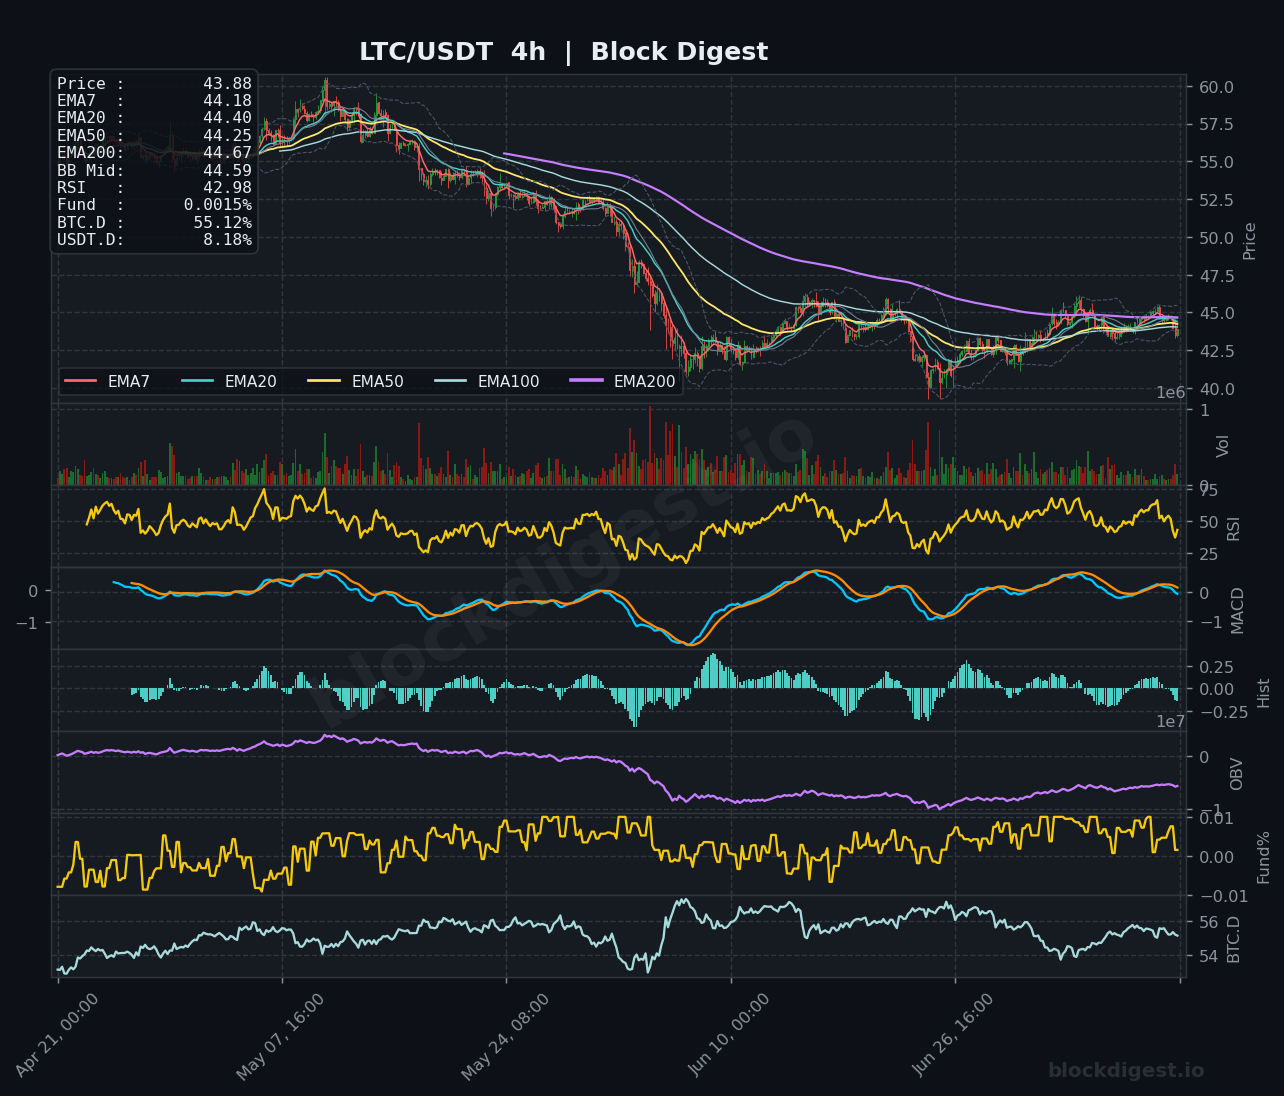
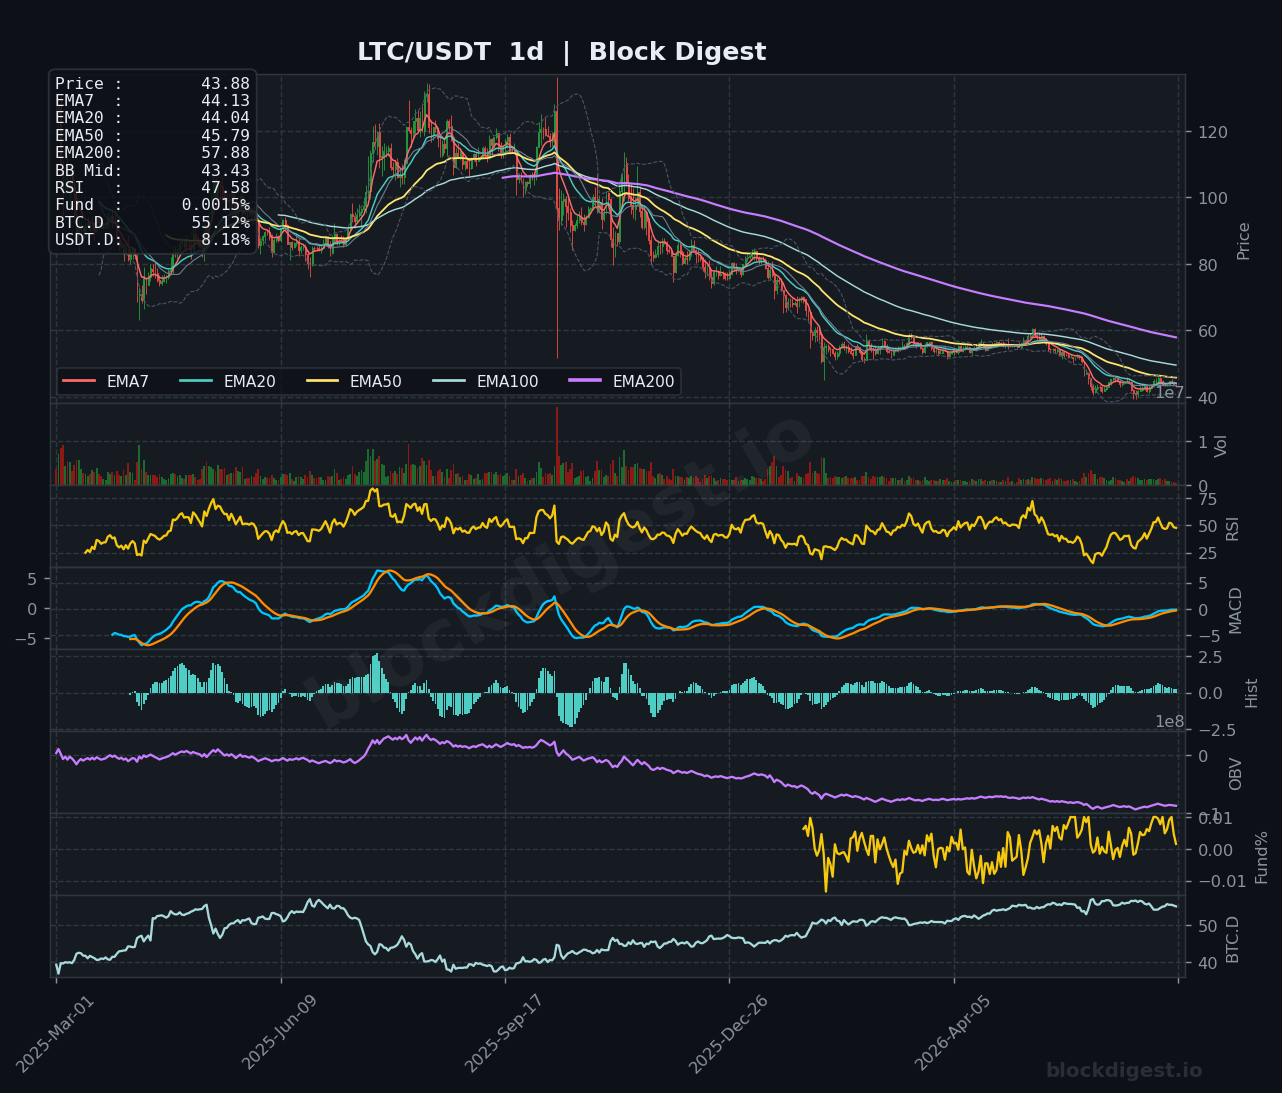
LTC is trading at $43.88, sitting just below its EMA20 ($44.12), EMA50 ($44.39), and EMA200 ($44.26) on the 1-hour chart, with RSI at 40.59 indicating weakening momentum after a multi-week consolidation in the $43–$46 range. The 4-hour chart is more constructive relative to peers — MACD is near zero and attempting a bullish crossover, and OBV has shown modest signs of stabilization after the steep decline from the $57–$60 region, suggesting sellers may be exhausting. The daily RSI at 47.58 is the most neutral reading among all coins reviewed today, hinting that LTC is in a more balanced technical position than SOL, XRP, or DOGE, though it remains firmly beneath its daily EMA200 at $57.88. Key near-term support sits at $43.00, while a reclaim of $45.00 would be the first meaningful signal that a short-term base is forming.
TRON (TRX)
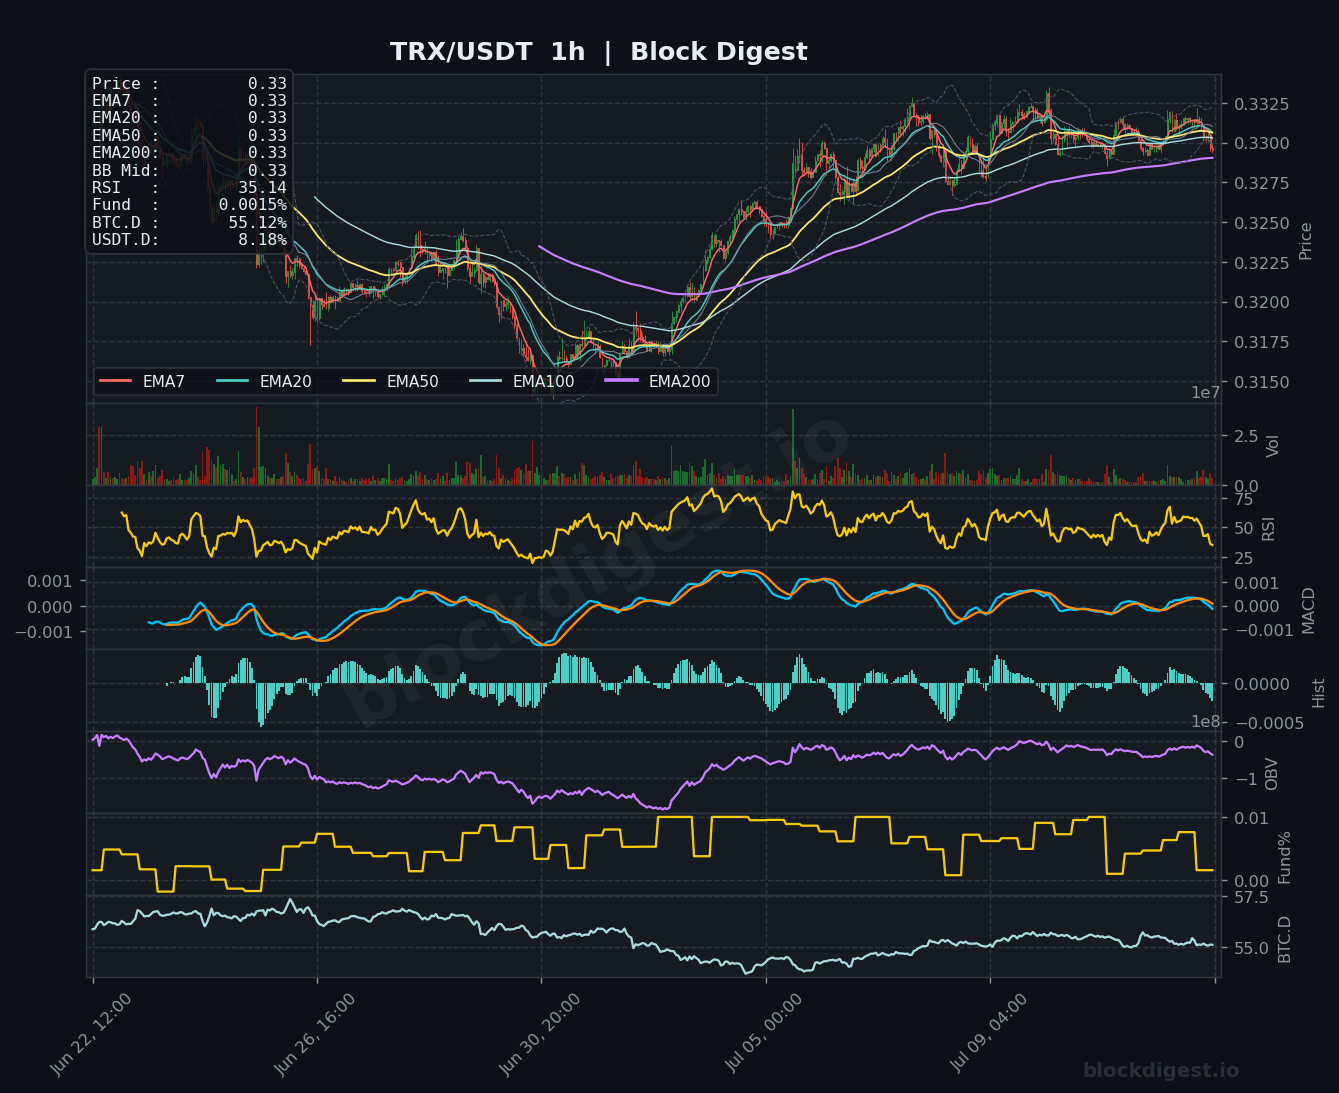
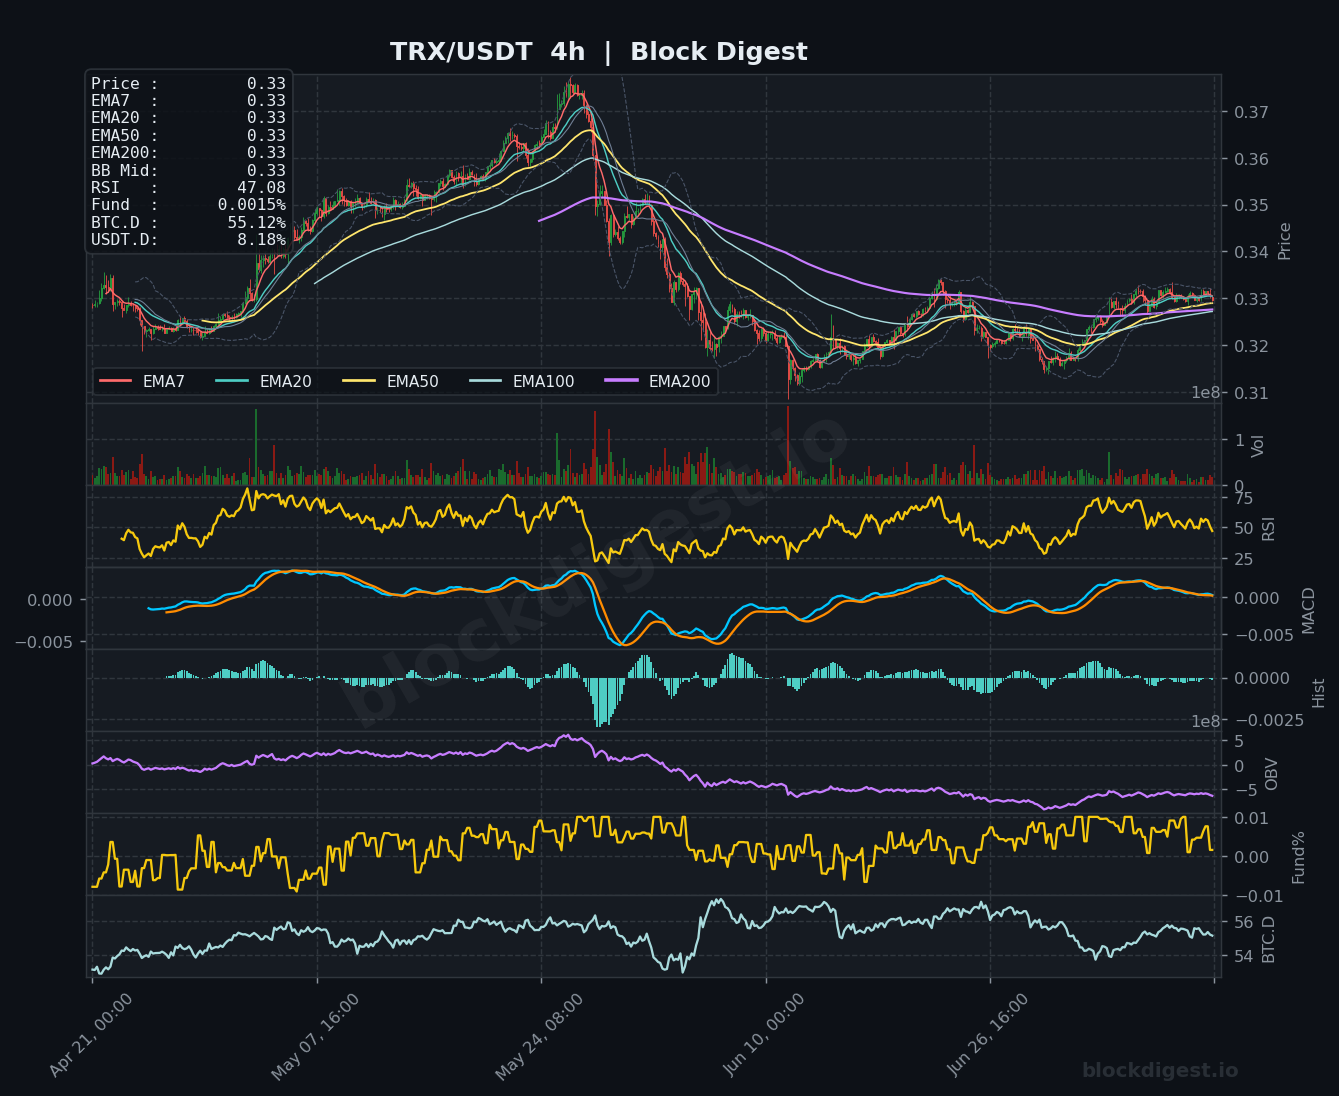
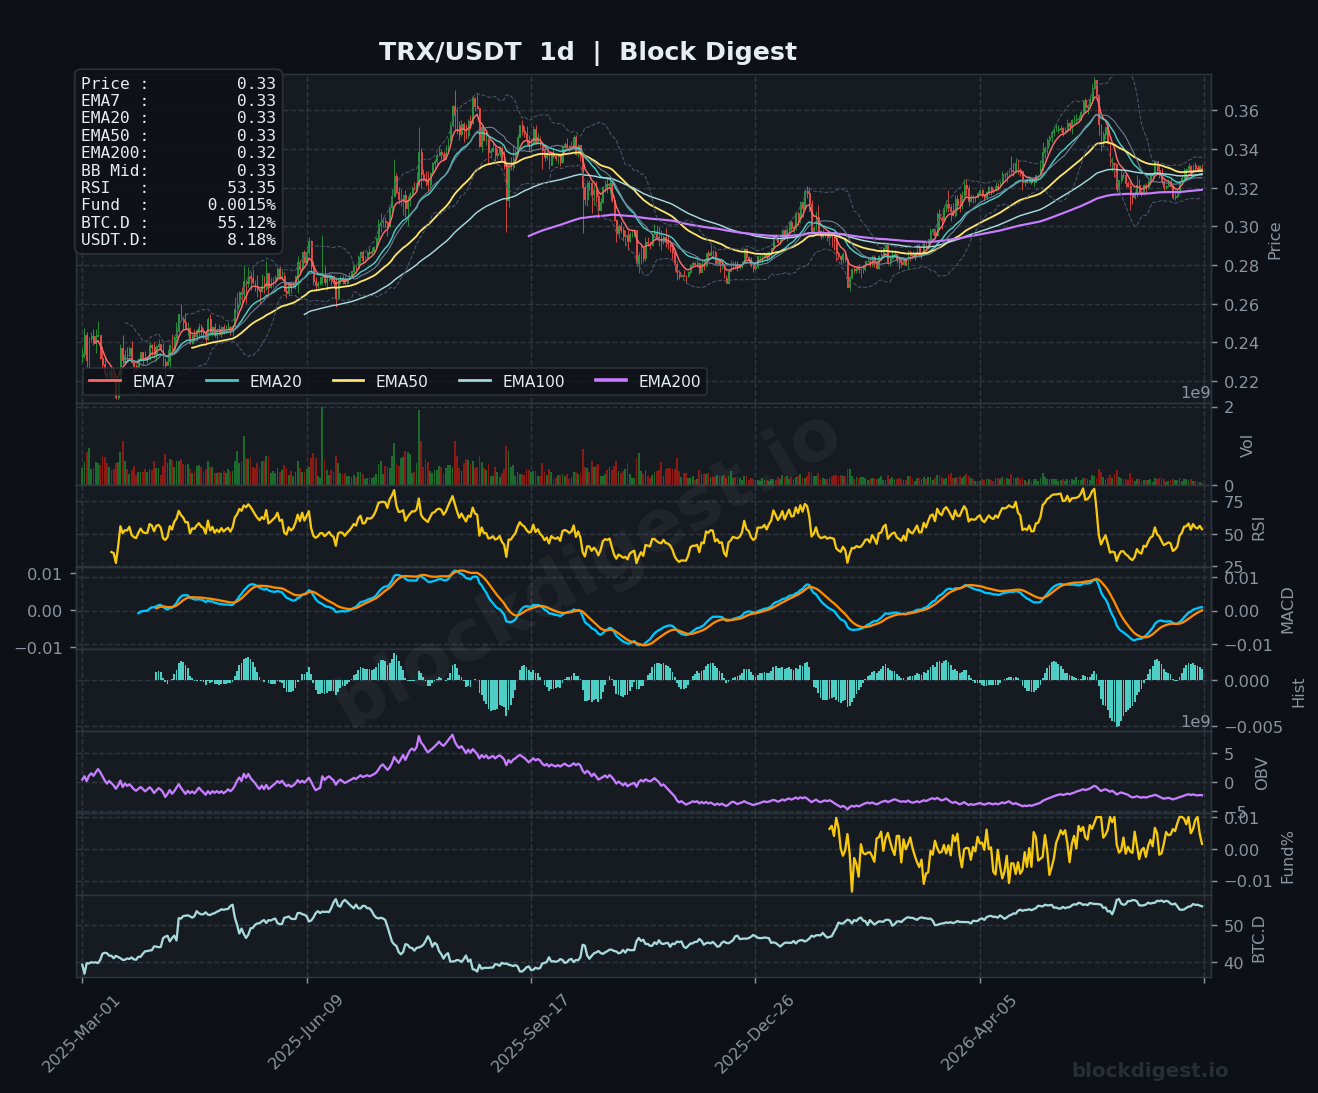
TRX is trading at $0.33 and stands out as the relative strength leader in this roundup, with its daily RSI at 53.35 — the only coin above the neutral 50 threshold — and price sitting above its daily EMA200 at $0.32, a structurally bullish distinction none of the other covered assets can claim. On the 1-hour chart, all EMAs are tightly converged at $0.33, and while RSI has slipped to 35.14 on this timeframe suggesting short-term exhaustion, the broader trend remains constructive. The 4-hour chart confirms the recovery from the $0.315 lows has been orderly, with MACD gradually rising back toward zero and OBV stabilizing — a more encouraging accumulation pattern than its peers. Immediate support is at $0.328, with resistance at $0.335; a sustained break above this level could see TRX push toward $0.340, making it the most defensible long bias in the current altcoin environment.
Altcoin Outlook
The overall altcoin setup heading into mid-July 2026 is broadly bearish-to-neutral, with the majority of assets trading below key moving averages on multiple timeframes and momentum indicators failing to generate convincing recovery signals. TRX is the clear relative strength standout, maintaining its EMA200 on the daily and holding an RSI above 50 — a combination that makes it the most favorable risk-reward proposition of the six coins analyzed. BNB shows tentative stabilization and LTC has the most neutral momentum profile, while SOL, XRP, and especially DOGE present the weakest technical structures with declining OBV and RSI readings drifting toward or into oversold territory. Key macro conditions to monitor include any shift in BTC dominance below 54% — which would signal meaningful altcoin rotation — and a USDT.D drop below 7.5%, which would indicate genuine risk-on appetite returning to the broader market.
Disclaimer: This analysis is for informational purposes only and does not constitute financial advice. Cryptocurrency markets are highly volatile and unpredictable. All trading decisions should be made based on your own research and risk tolerance. Block Digest is not responsible for any financial losses incurred as a result of acting on this content.
Stay Ahead of the Market
Follow BlockDigest for crypto market intelligence, research and real-time updates.


