
Market Context
The broader altcoin market is navigating a cautious environment as of July 12, 2026, with BTC dominance holding elevated at 55.55% — a level that historically suppresses meaningful altcoin outperformance. USDT dominance at 8.10% reflects a still-significant pool of capital sitting on the sidelines, suggesting risk appetite remains restrained despite the global market cap hovering near $2.26 trillion. Until BTC.D shows a decisive rollover, altcoin upside is likely to remain range-bound and selective rather than broad-based.
Solana (SOL)
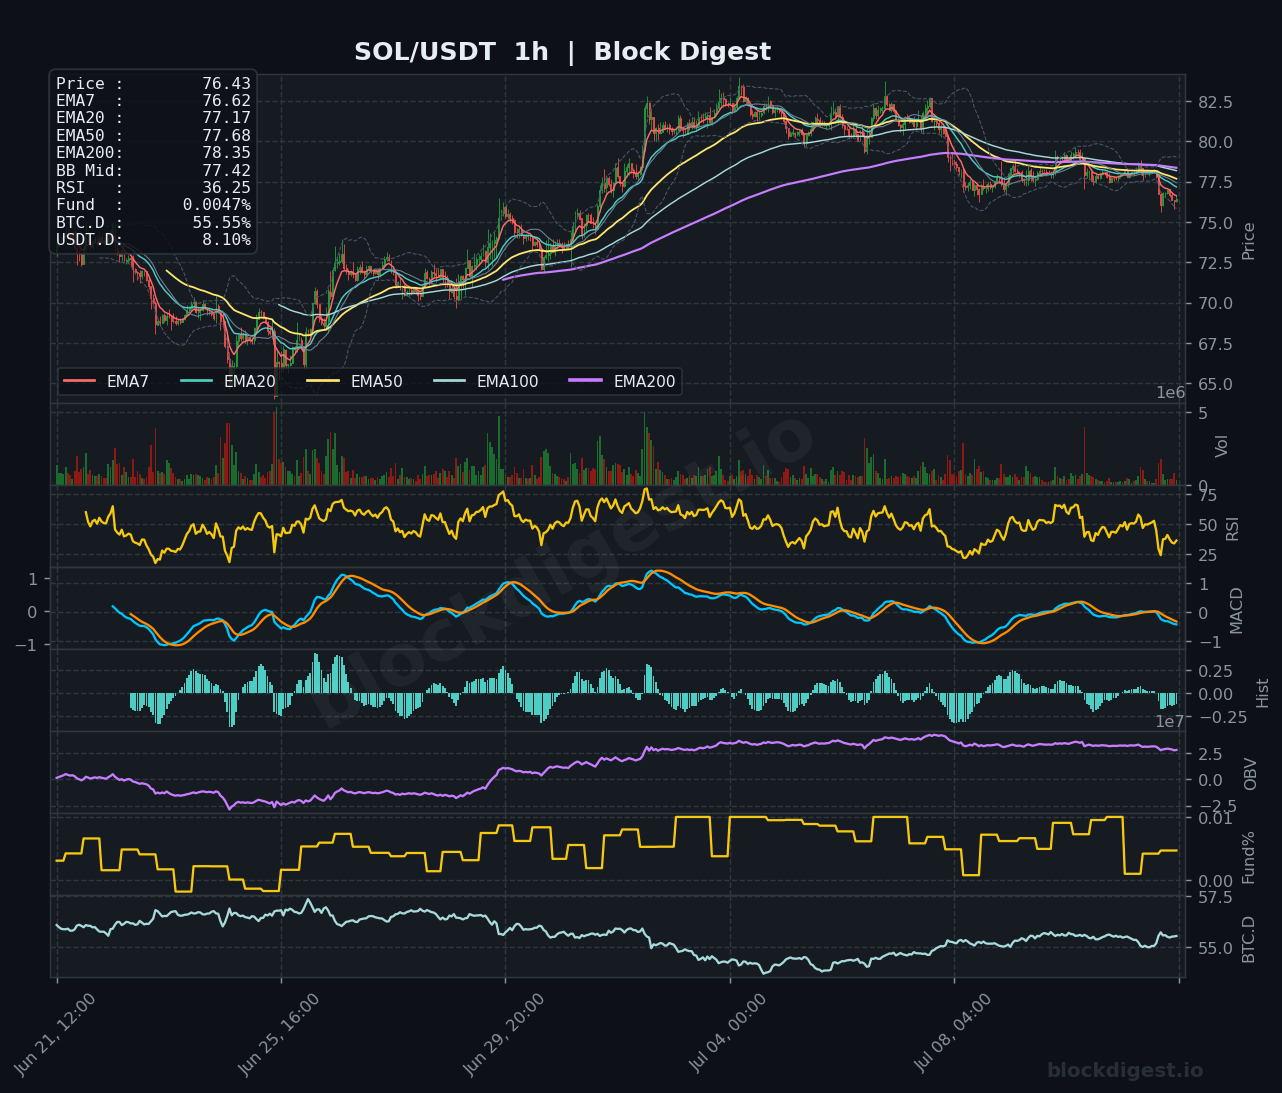
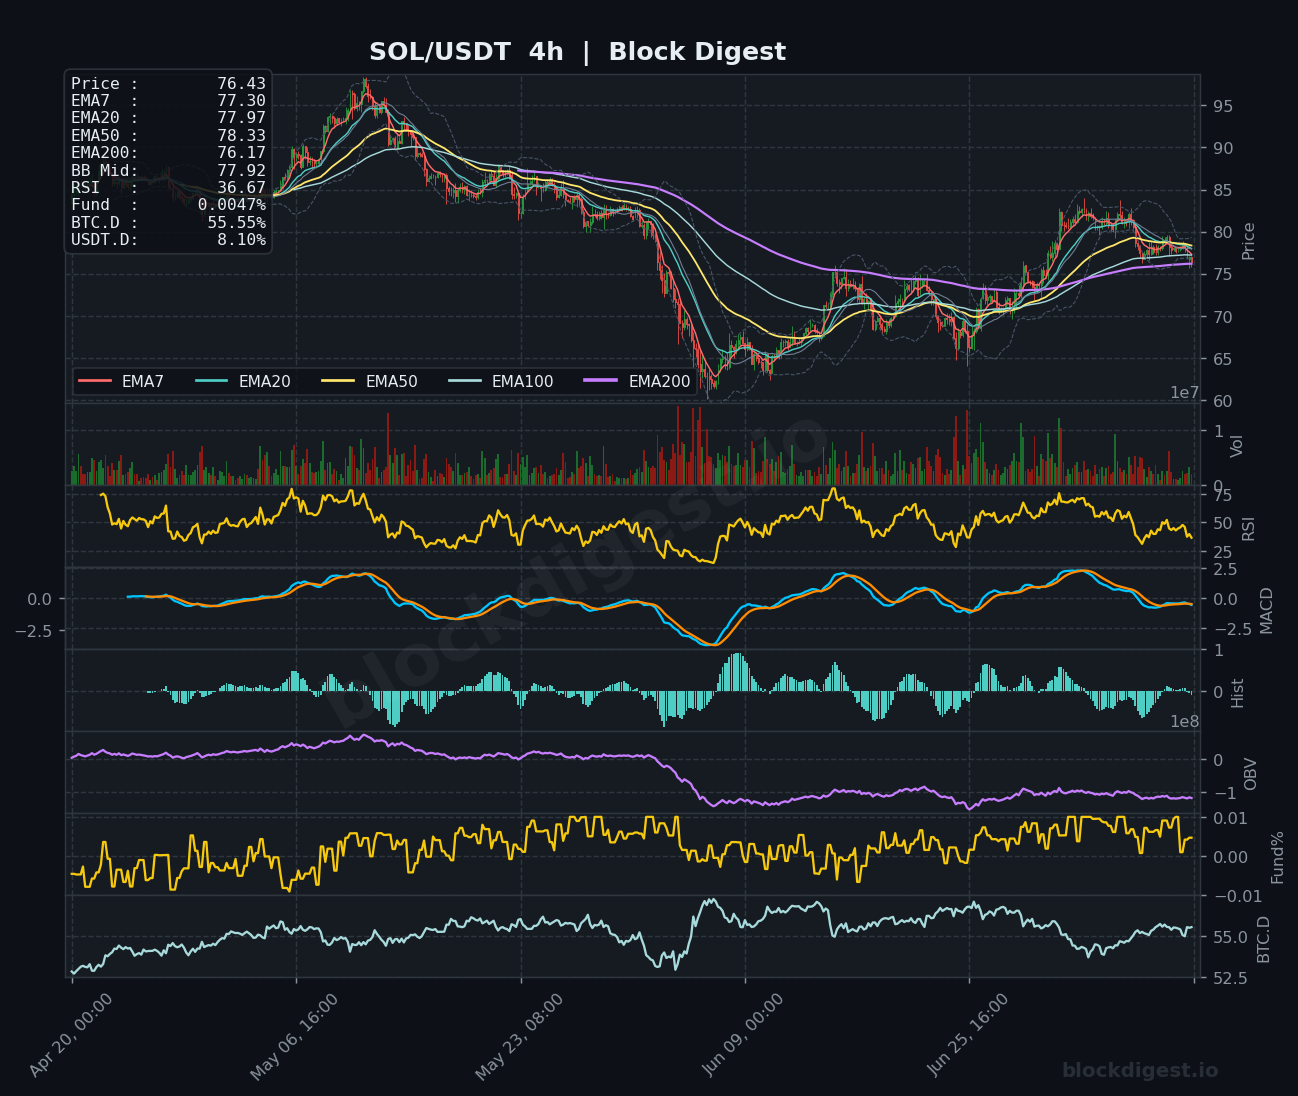
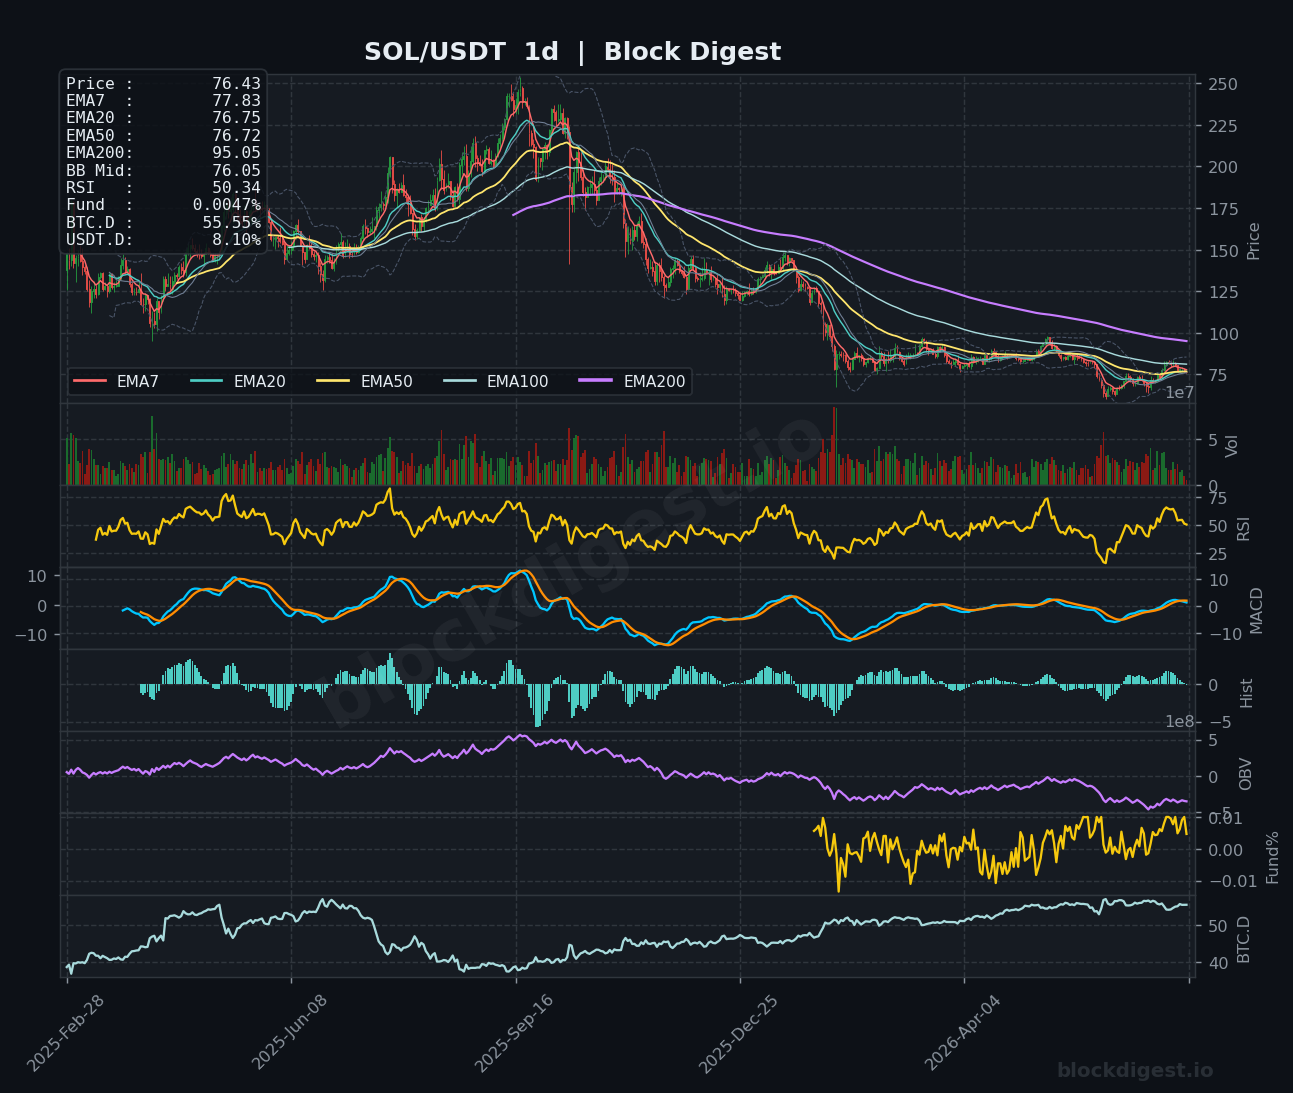
SOL is trading at $76.43, having pulled back sharply from recent highs near $82–$83, with price now sitting below its EMA7 ($76.62), EMA20 ($77.17), EMA50 ($77.68), and EMA200 ($78.35) on the 1-hour chart — a fully bearish EMA stack in the near term. The 1-hour RSI at 36.25 and the 4-hour RSI at 36.67 both indicate oversold pressure building, though the MACD on both timeframes remains in negative territory with histogram bars still red. On the daily chart, RSI has recovered to 50.34 and price is attempting to stabilize near the EMA20 ($76.75) and EMA50 ($76.72), which form a critical confluence support zone — a daily close below $75 would be a meaningful bearish development. Short-term bias is cautiously bearish, with bulls needing a reclaim of $78.00 to shift momentum; the strong Coinbase buy-side sentiment provides a potential floor but has yet to translate into price recovery.
XRP (XRP)
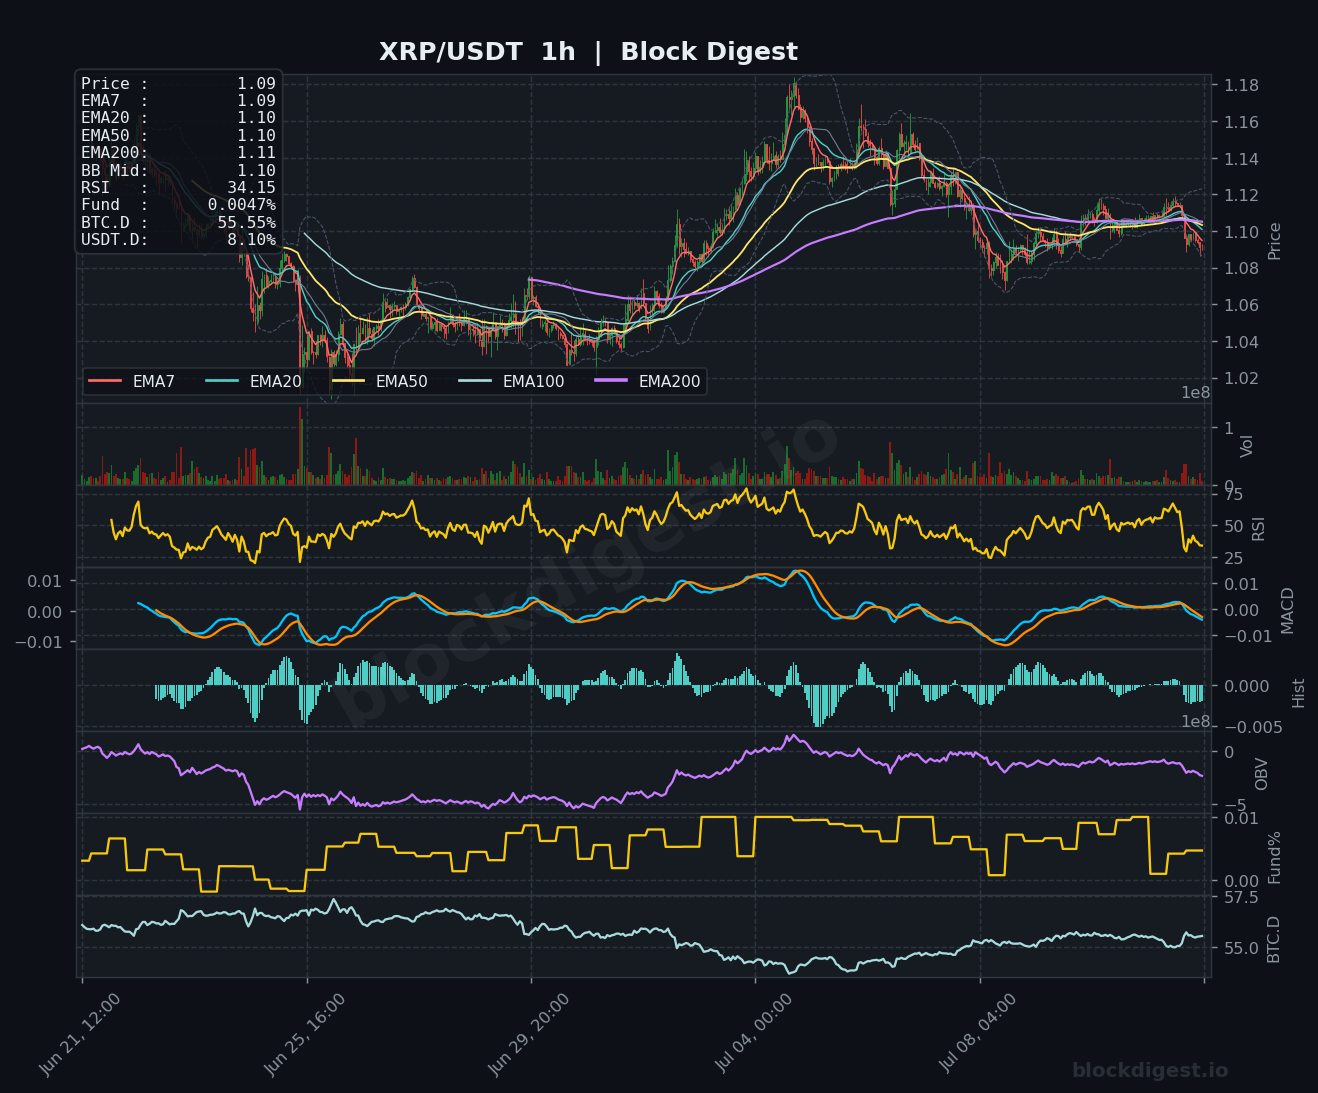
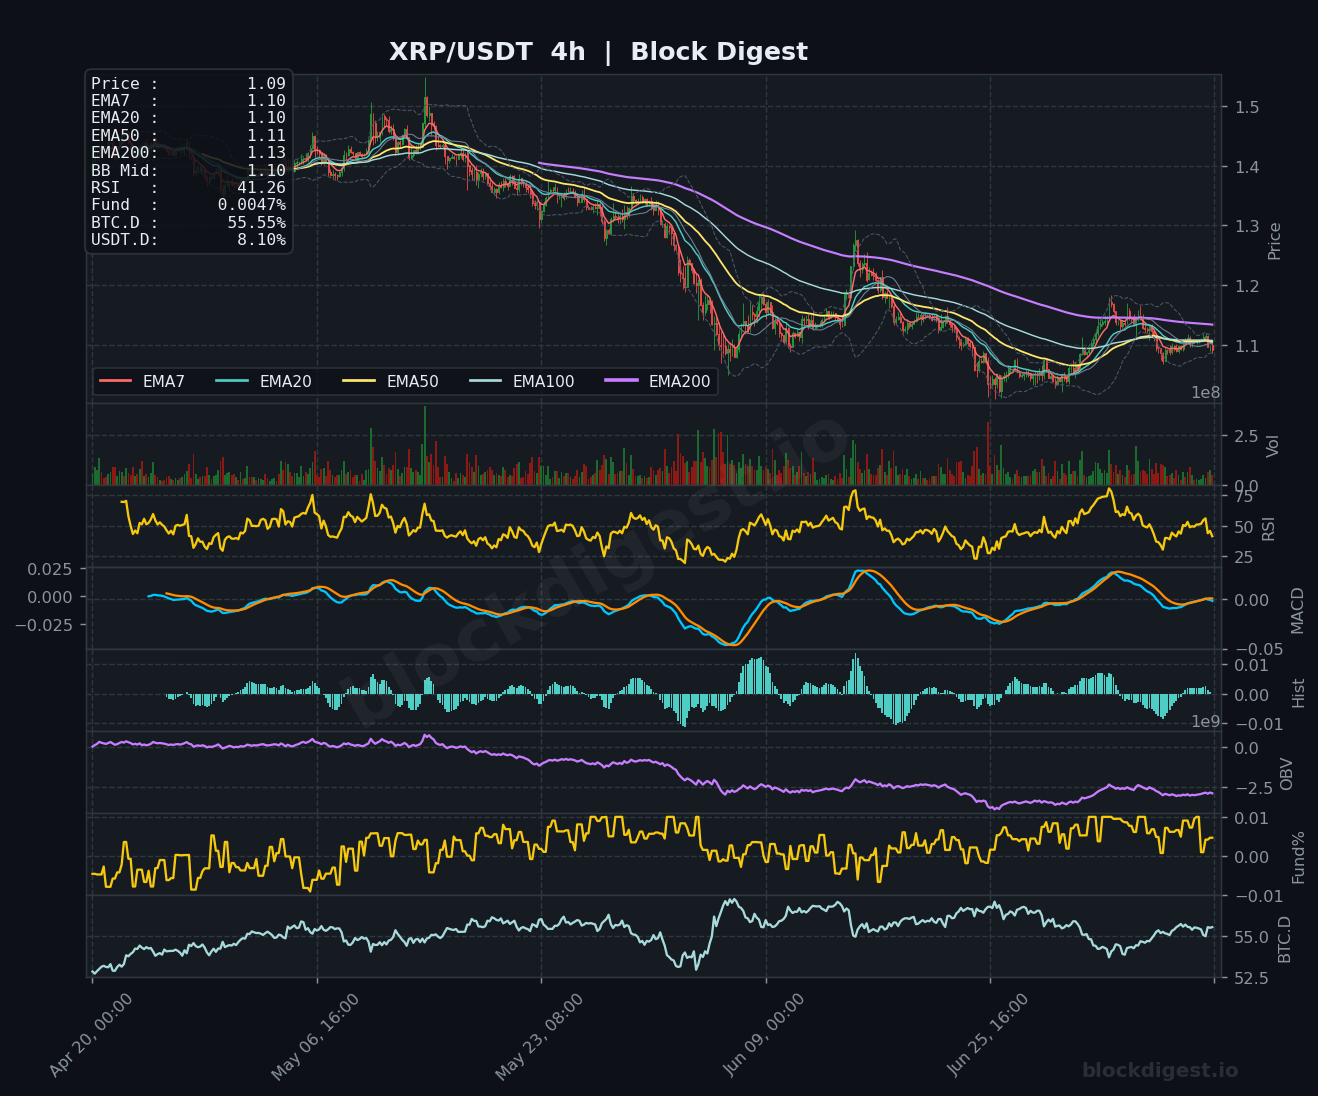
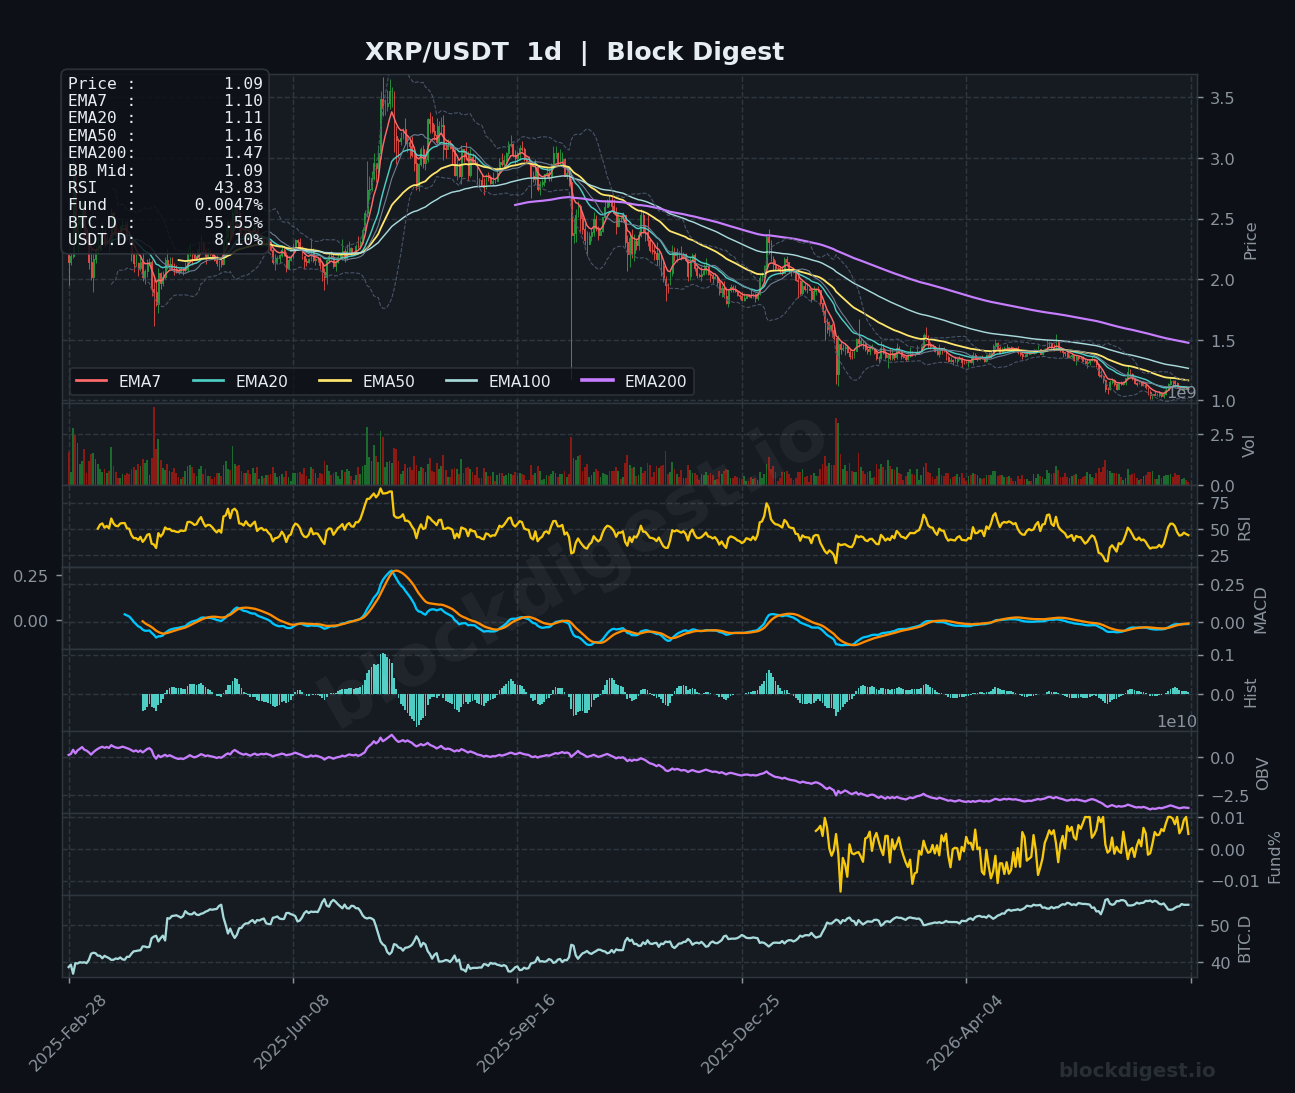
XRP is trading at $1.09, well below all key EMAs on the 1-hour chart — EMA7 ($1.09), EMA20 ($1.10), EMA50 ($1.10), EMA200 ($1.11) — confirming a bearish near-term structure, with RSI at 34.15 approaching oversold territory. On the 4-hour timeframe, RSI sits at 41.26 and the MACD is curling toward a potential bullish cross near zero, but price remains pressured below the BB midline at $1.10, suggesting any recovery remains tentative. The daily chart paints a more structurally concerning picture: price has been in a sustained downtrend from the $3.00+ highs, with the EMA200 at $1.47 acting as distant overhead resistance and OBV continuing to decline — consistent with reports of XRP Ledger activity hitting rare lows. Immediate support sits at the $1.07–$1.08 zone; a failure there opens the door to $1.00 psychological support, while bulls need a sustained close above $1.12 to establish any meaningful recovery.
BNB (BNB)
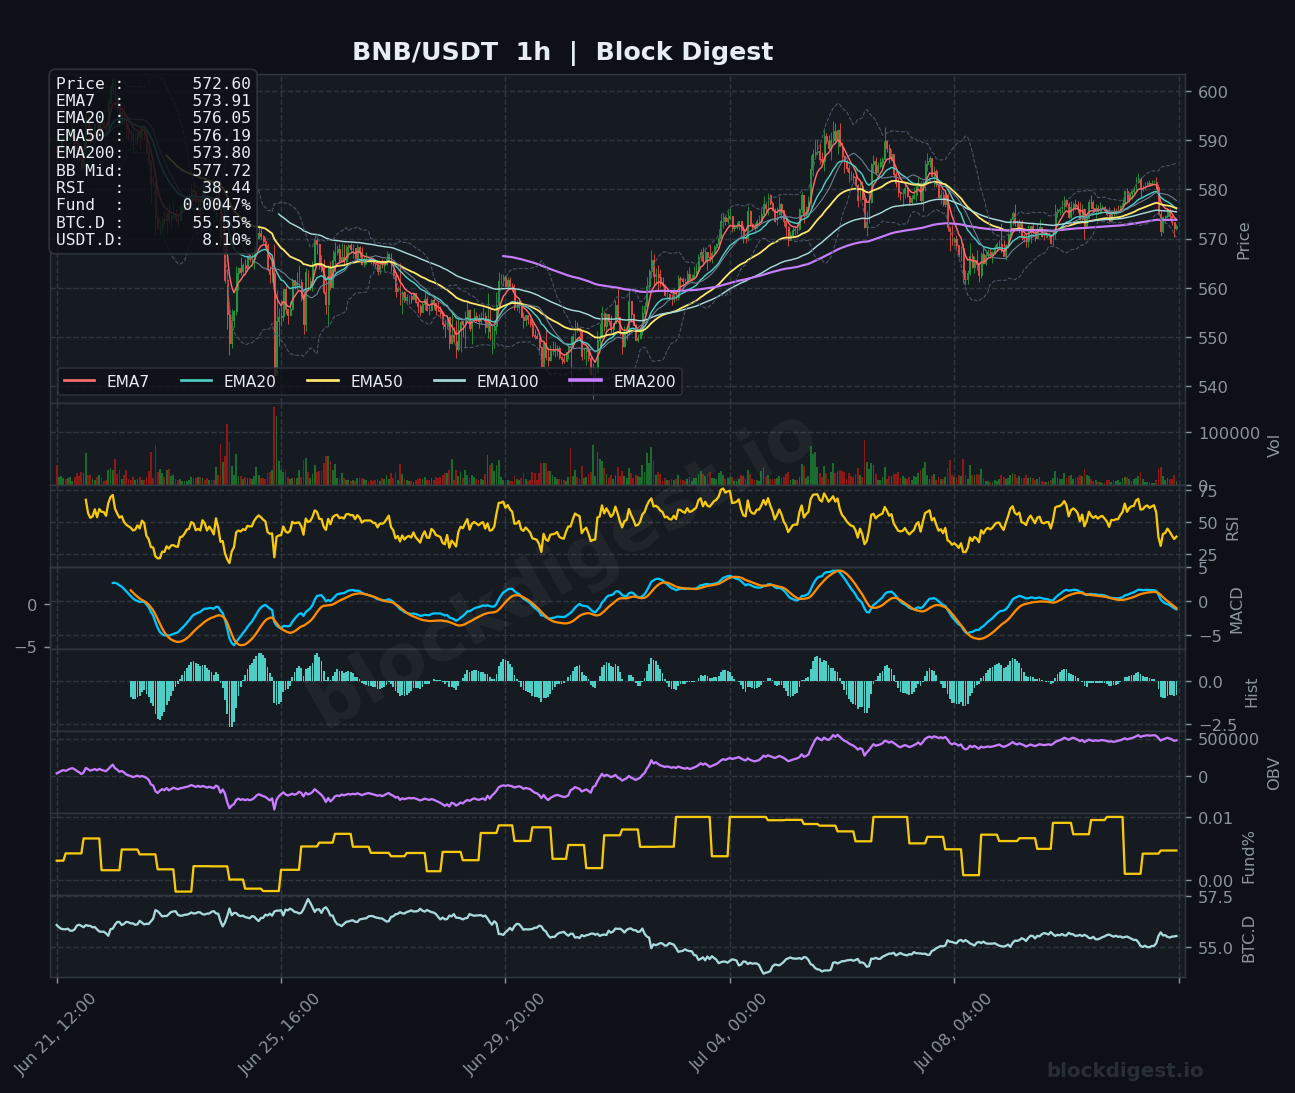
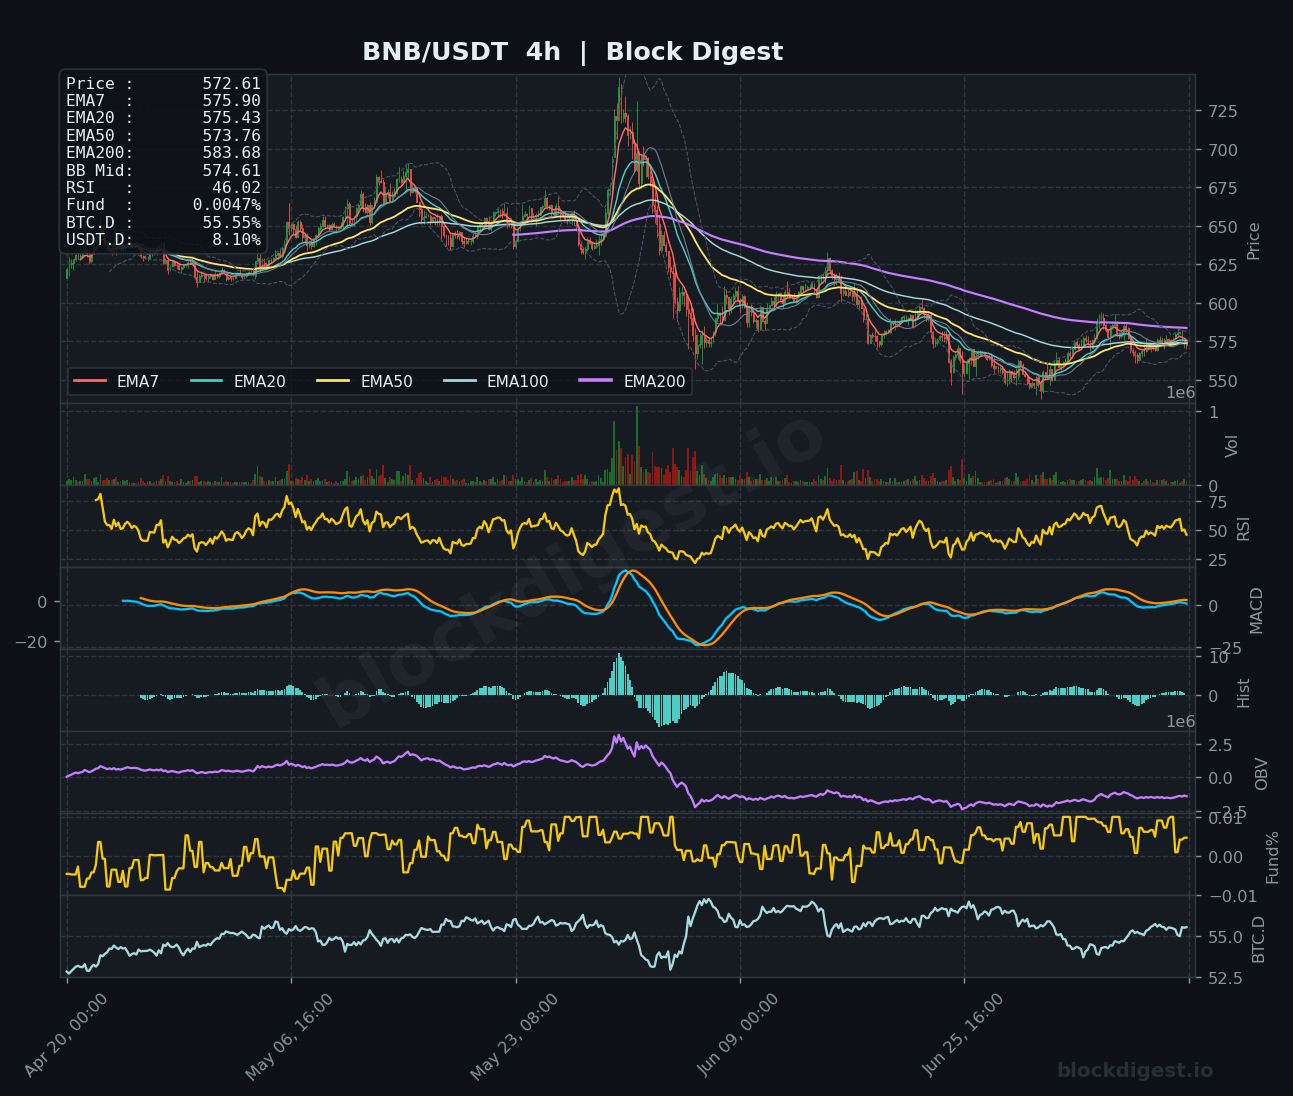
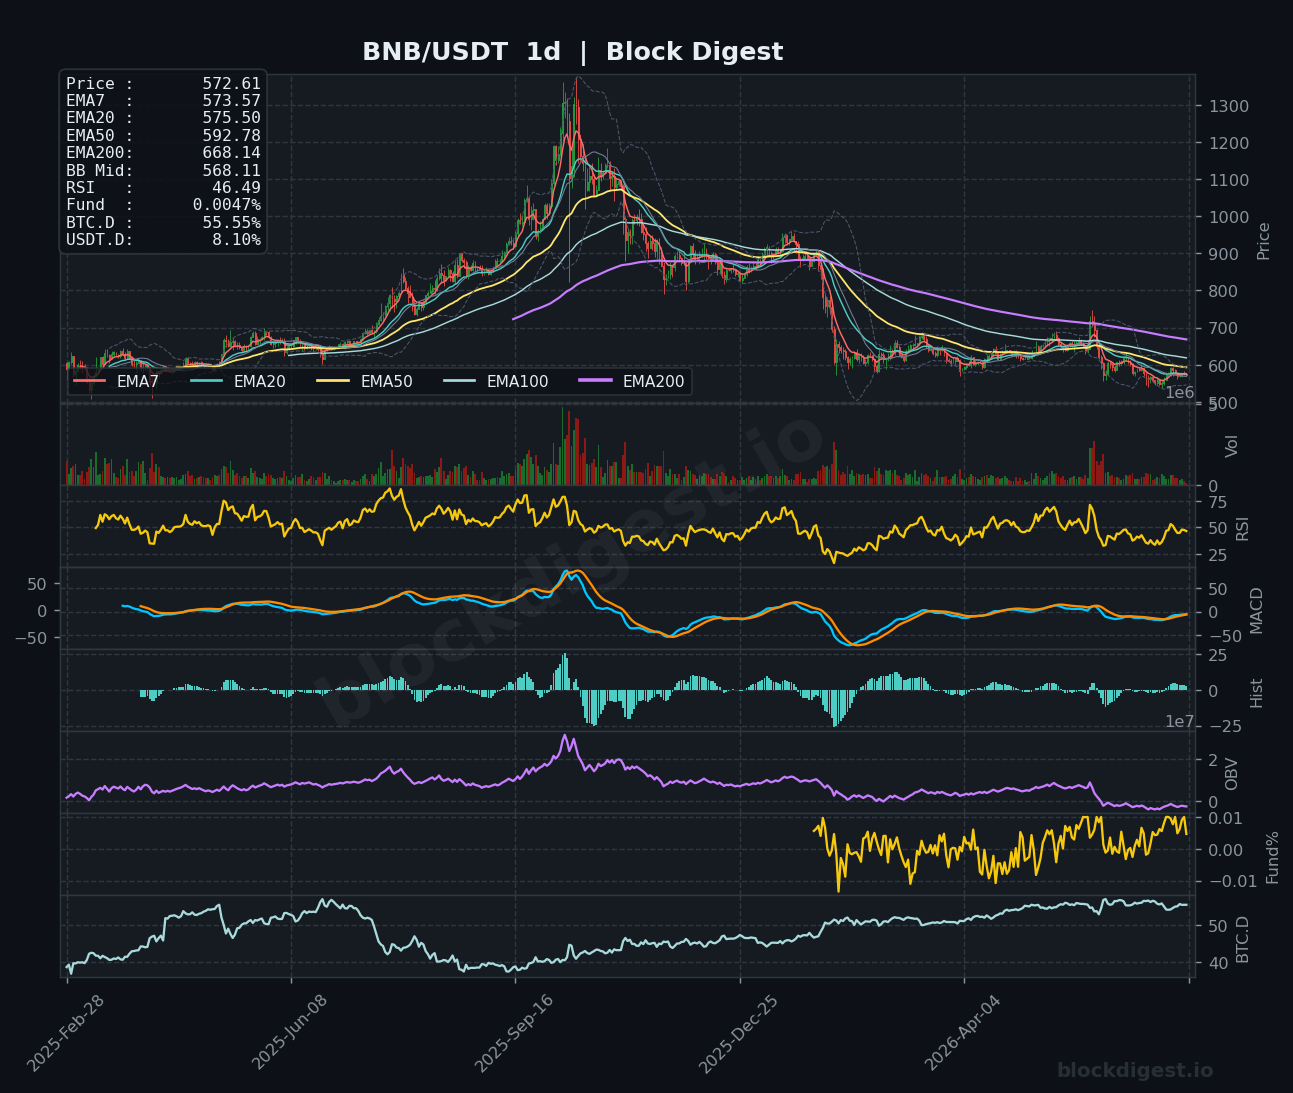
BNB is trading at $572.60, marginally below its EMA7 ($573.91) and EMA20 ($576.05) on the 1-hour chart, with RSI at 38.44 reflecting softening momentum after a brief push toward $590. The 4-hour chart shows price consolidating near the BB midline ($574.61) with RSI at 46.02 — neutral but leaning bearish — while the MACD remains barely positive, suggesting the intermediate trend has lost its prior bullish conviction. On the daily timeframe, BNB is trading below its EMA50 ($592.78) and far below the EMA200 ($668.14), indicating the macro trend remains structurally bearish; however, the daily RSI at 46.49 and a flattening MACD suggest downside momentum is decelerating. Key support is the $560–$565 range, with resistance at the EMA20 ($575.50) and EMA50 ($592.78) capping near-term upside; the short-term bias is neutral-to-bearish pending a resolution of the current consolidation.
Dogecoin (DOGE)
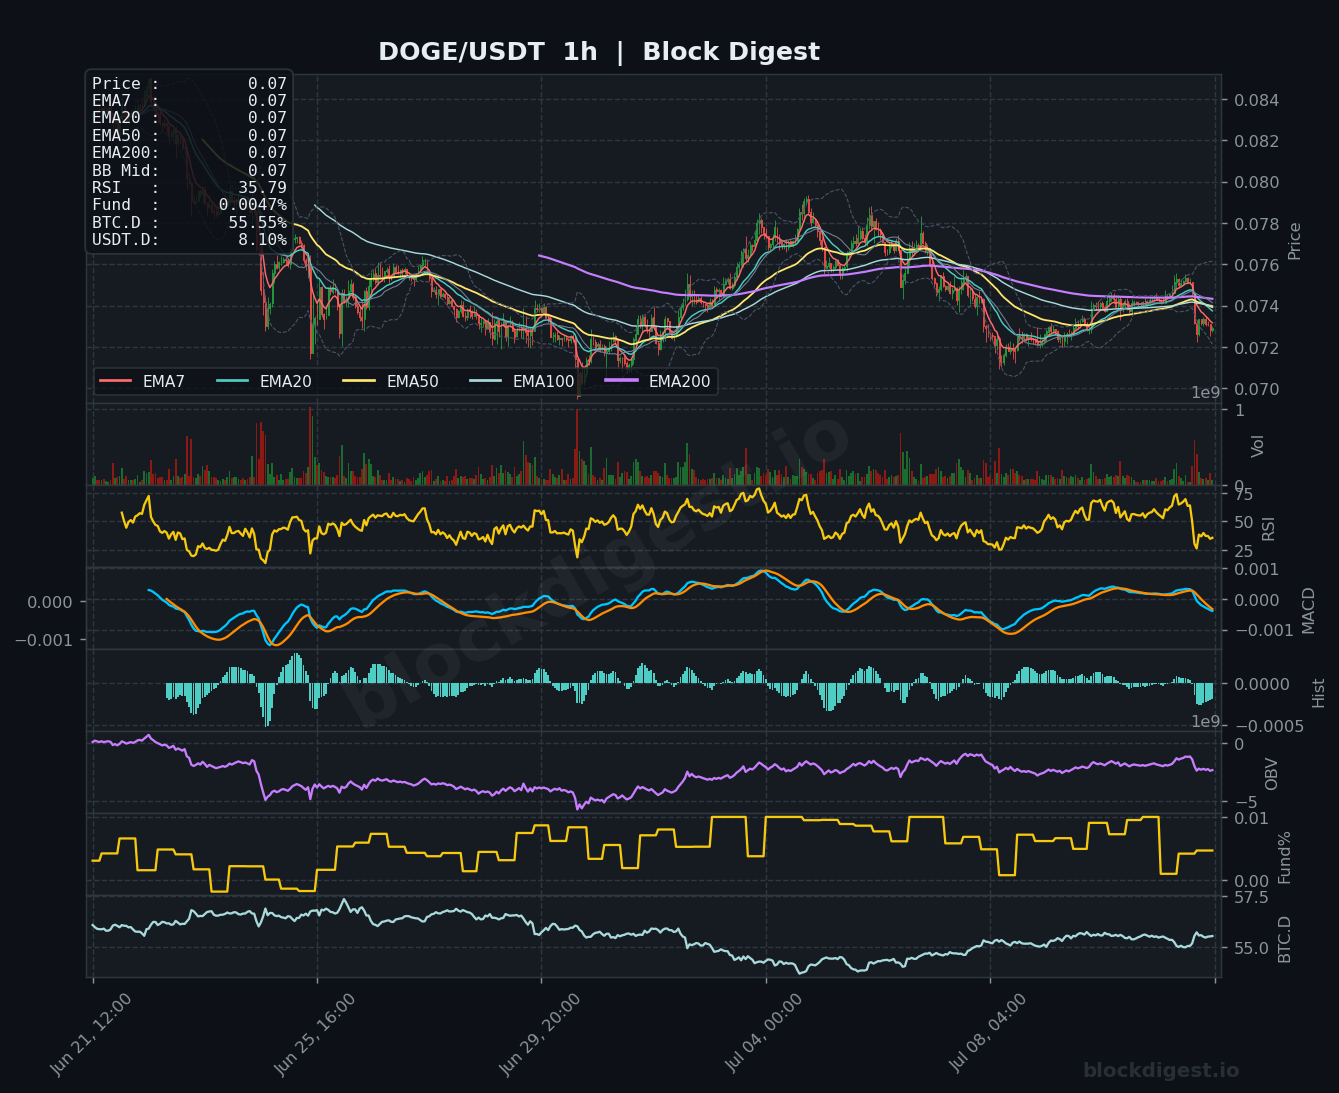
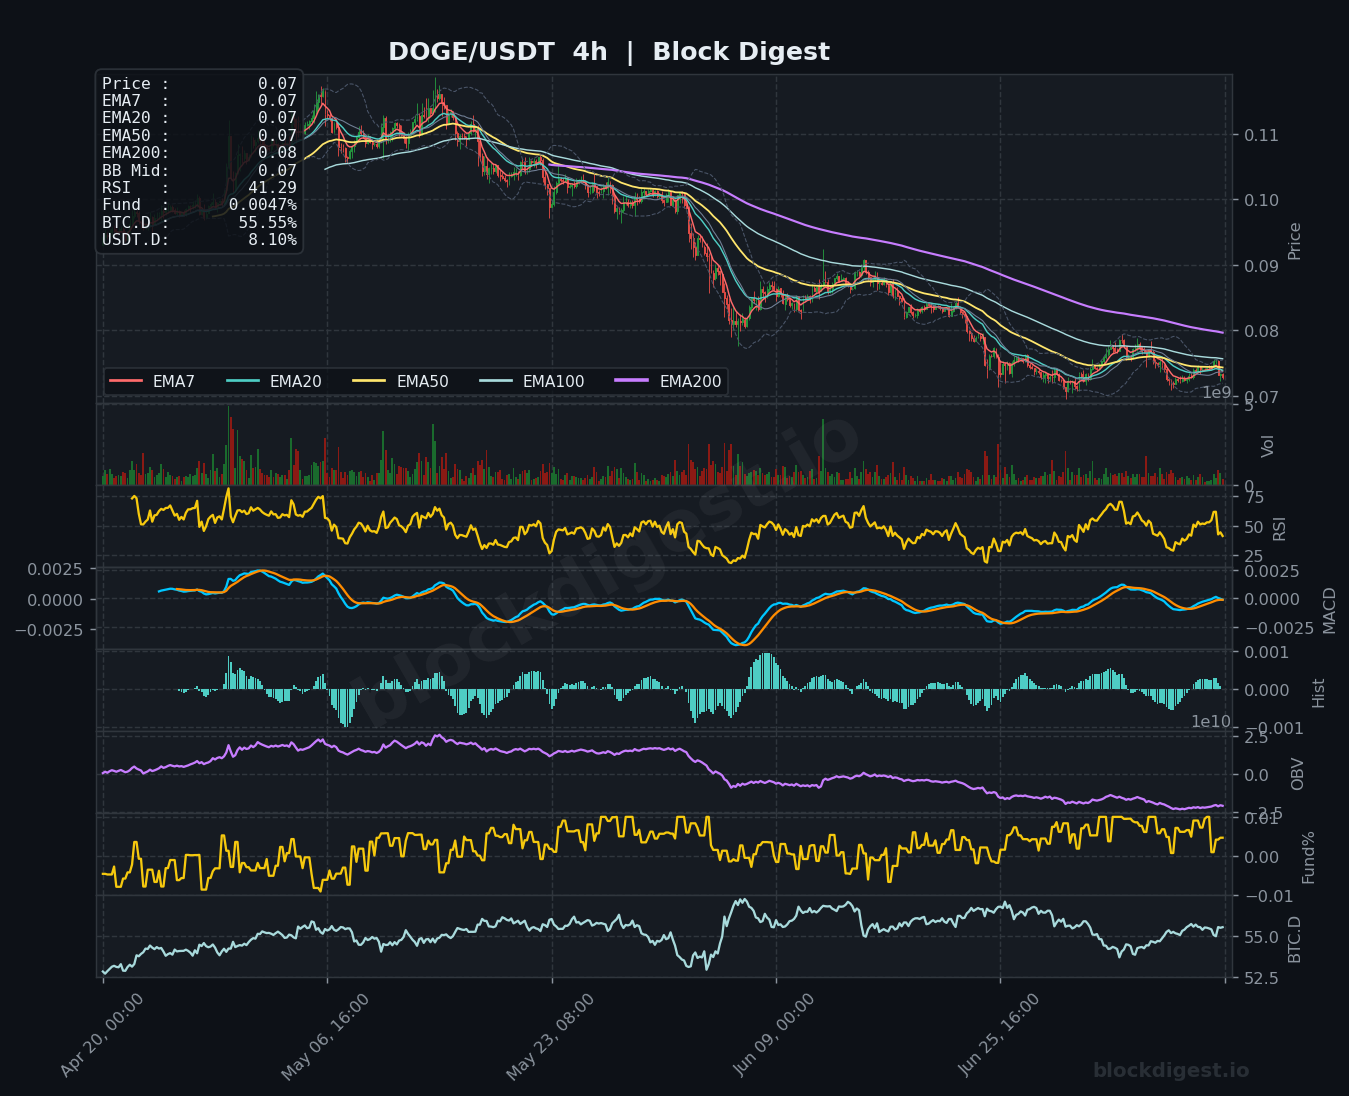
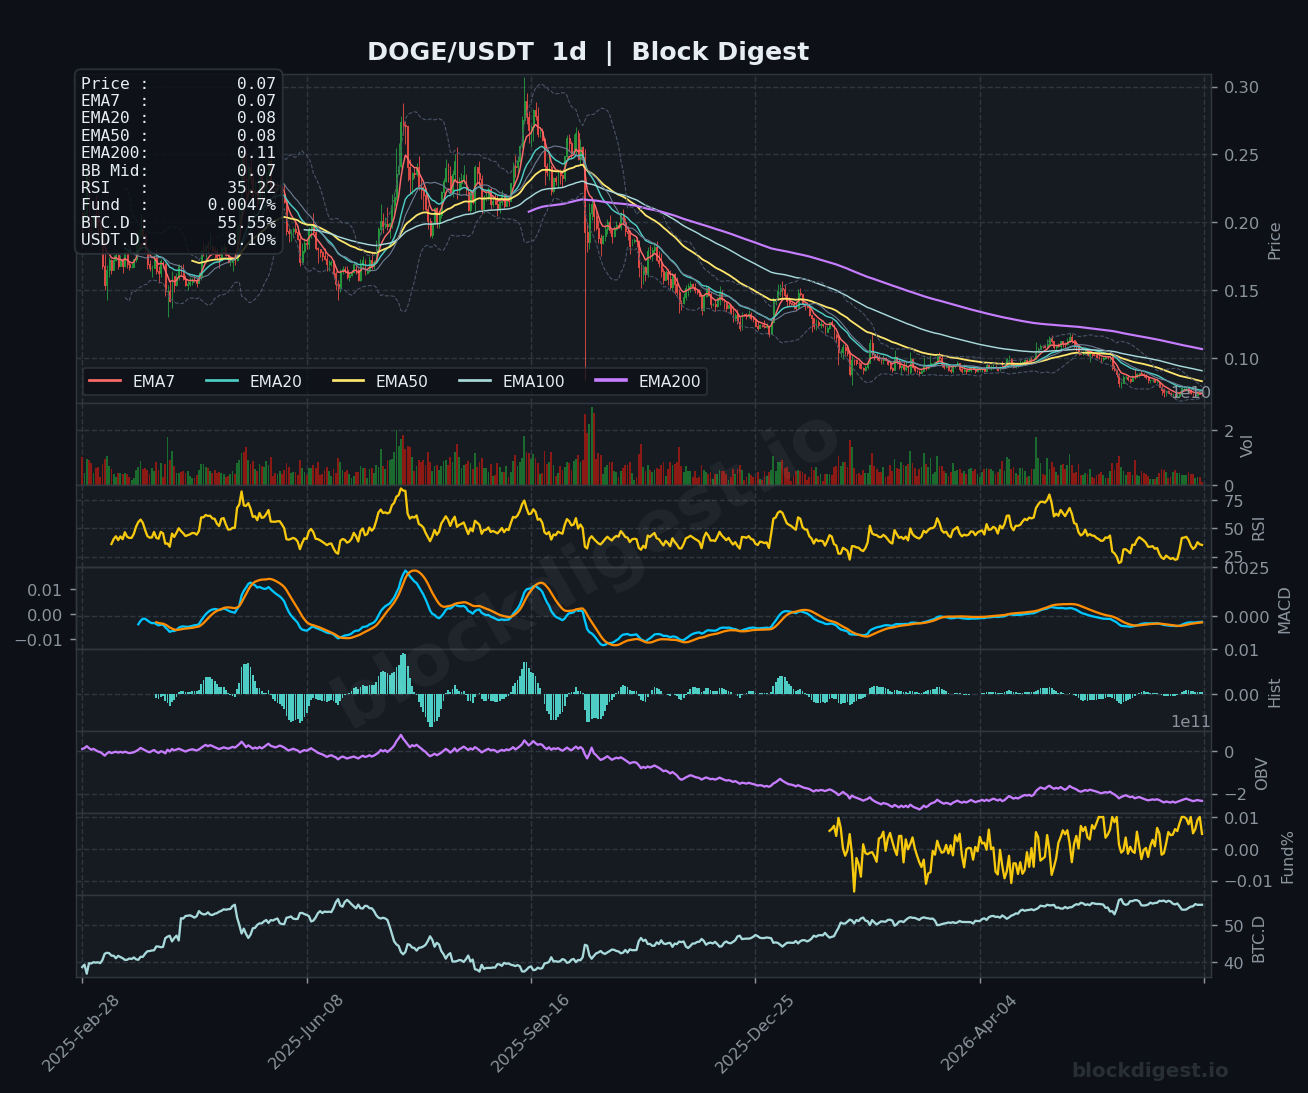
DOGE is trading at $0.073, with all EMAs on the 1-hour chart compressing tightly around the $0.07 level — a sign of extreme consolidation and low volatility — while RSI at 35.79 edges toward oversold conditions. The 4-hour chart tells a clearer bearish story: DOGE has been in a persistent downtrend from the $0.11 range, with all major EMAs in a bearish cascade and OBV trending steadily lower, confirming sustained distribution. On the daily chart, RSI has fallen to 35.22 — the lowest level seen in several months — with the MACD in negative territory and the EMA200 ($0.11) providing a distant, formidable overhead ceiling. Near-term support lies at the $0.071–$0.072 zone; a breakdown below $0.070 could accelerate selling pressure, and the bias remains bearish with no clear reversal catalyst visible across any timeframe despite DOGE maintaining top memecoin trading volume rankings.
Litecoin (LTC)
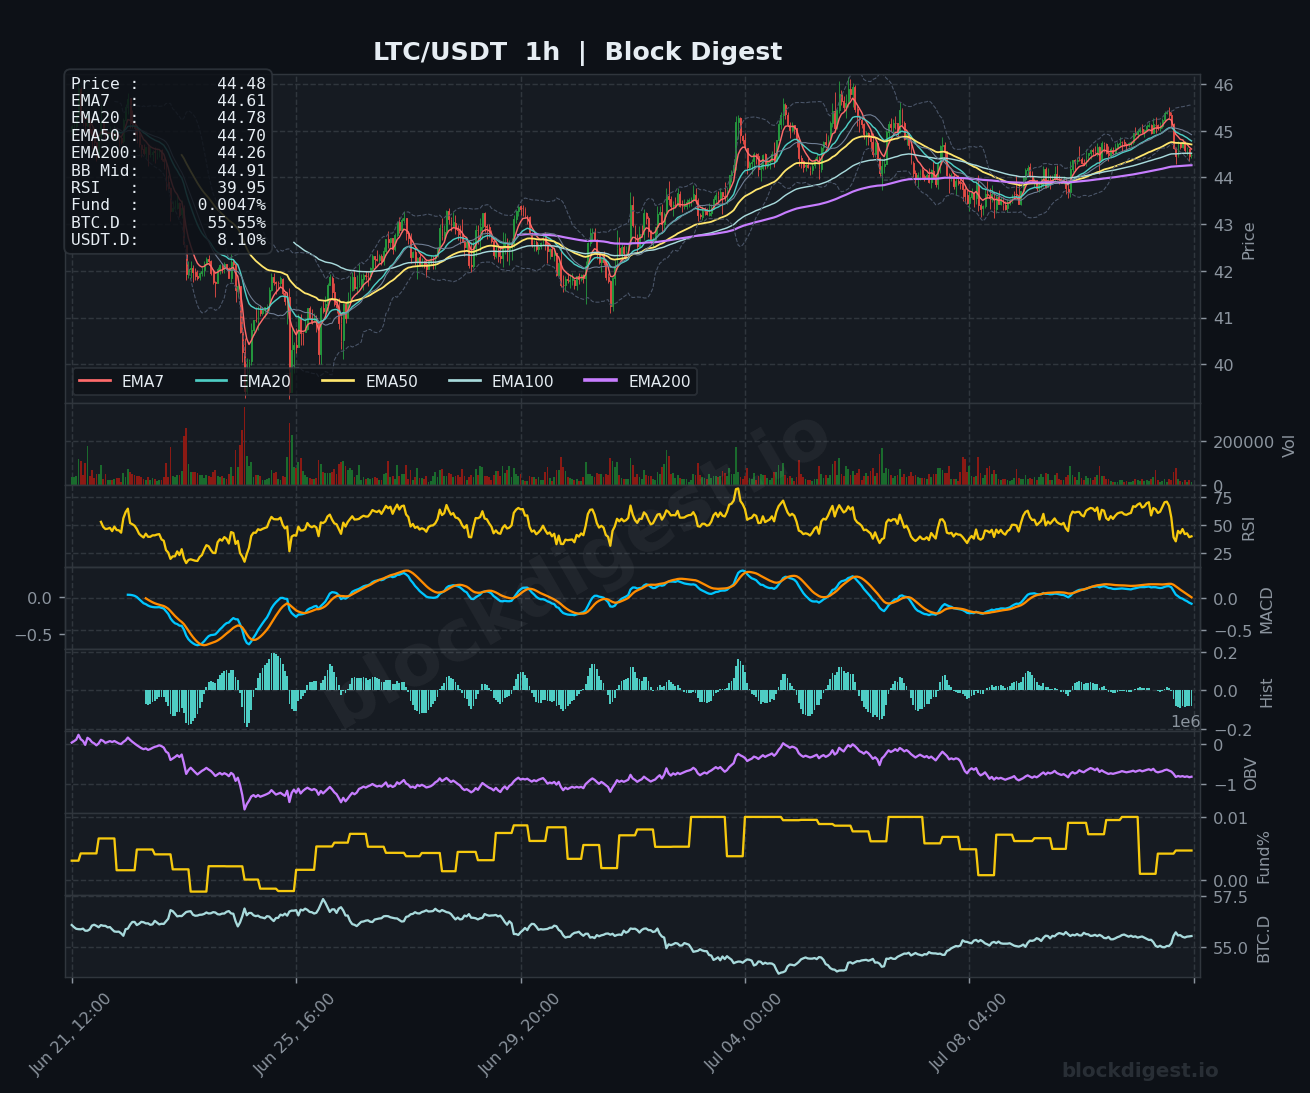
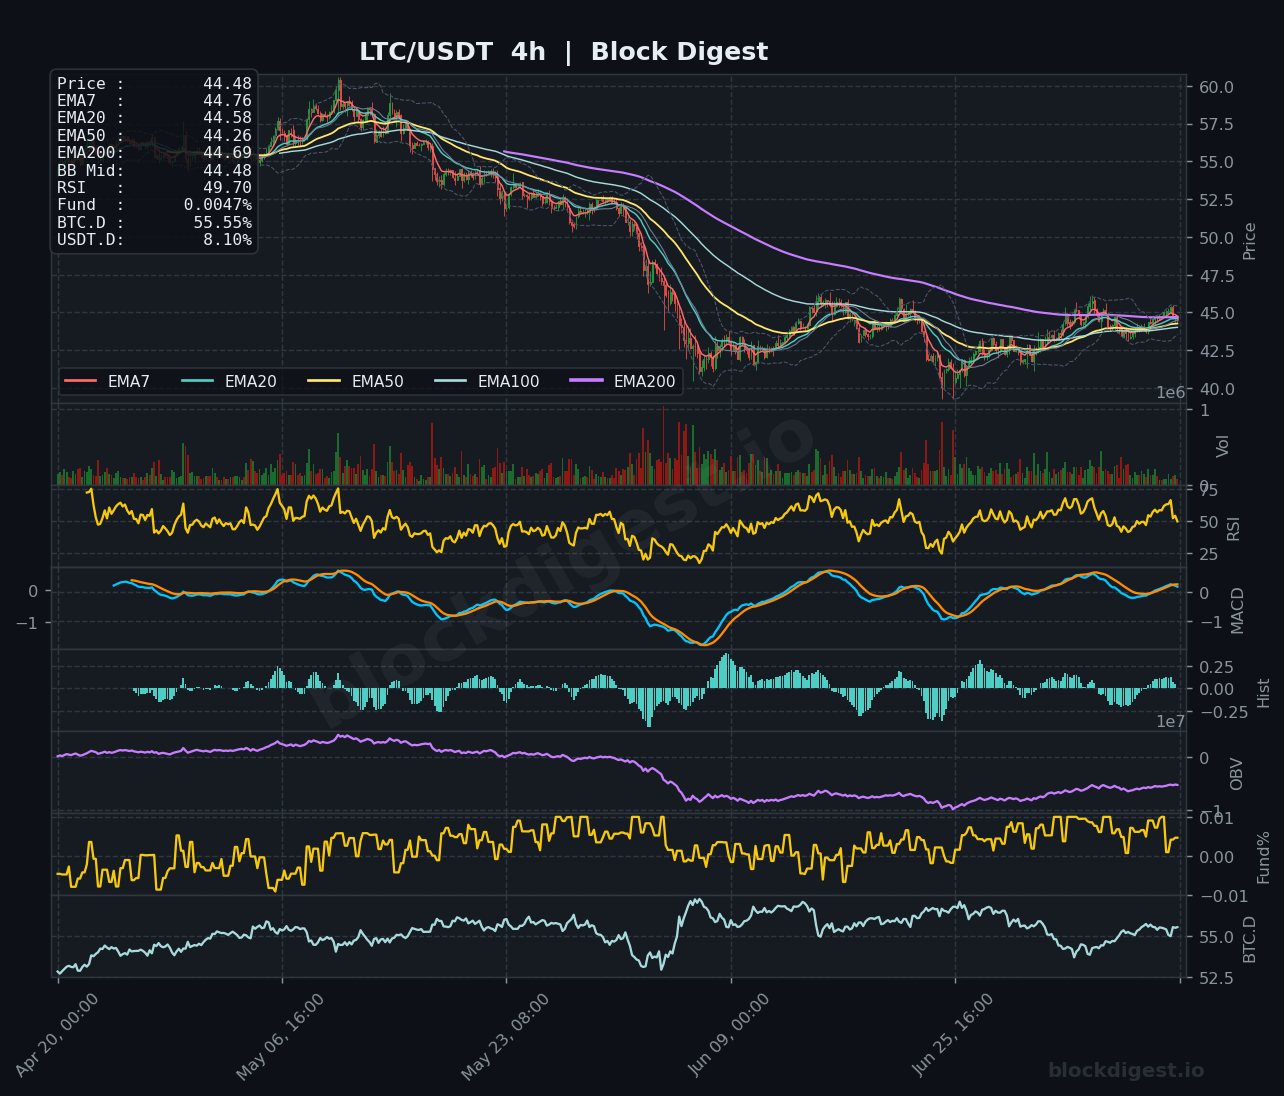
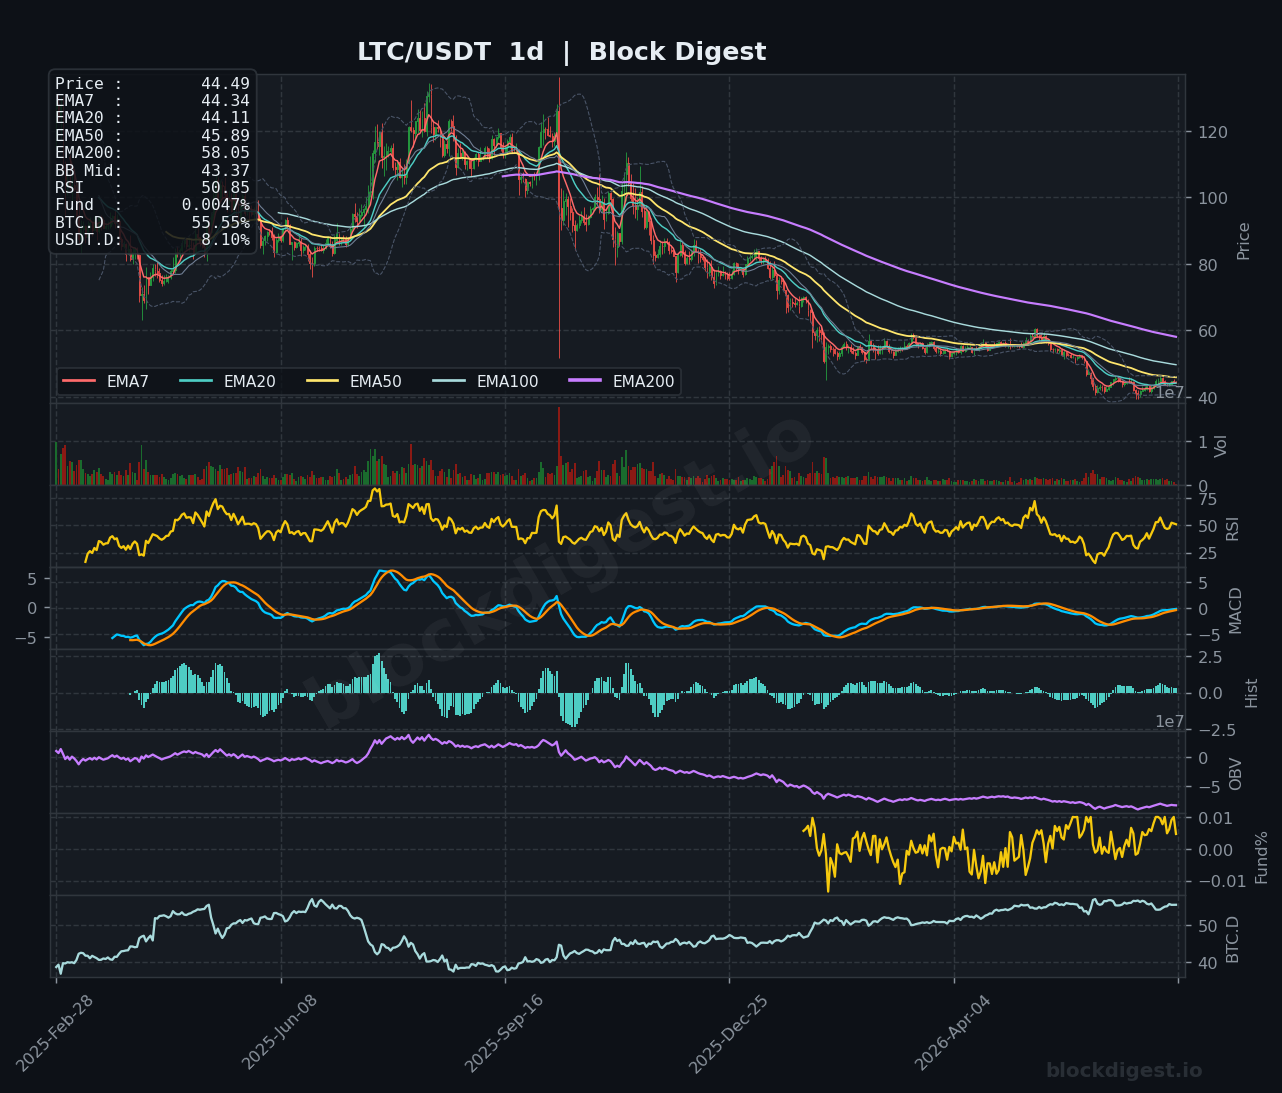
LTC is trading at $44.48, showing a relatively tighter EMA cluster on the 1-hour chart — EMA7 ($44.61), EMA20 ($44.78), EMA50 ($44.70), EMA200 ($44.26) — with price just below the shorter-term EMAs and RSI at 39.95, indicating mild bearish pressure but without significant momentum to the downside. The 4-hour chart is notably more constructive than most peers: RSI at 49.70 sits near neutral, the MACD is curling upward toward zero, and the BB midline at $44.48 is acting as a pivot — suggesting LTC is attempting a base formation after recovering from the $40–$41 lows seen in prior weeks. On the daily chart, RSI at 50.85 is the healthiest reading across today’s covered coins, and the EMA7 ($44.34) has crossed above EMA20 ($44.11), a nascent bullish signal, though the EMA50 ($45.89) looms as the next key resistance. LTC’s short-term bias is the most neutral-to-constructive of today’s cohort, with a break above $46.00 needed to confirm a more meaningful recovery leg.
TRON (TRX)
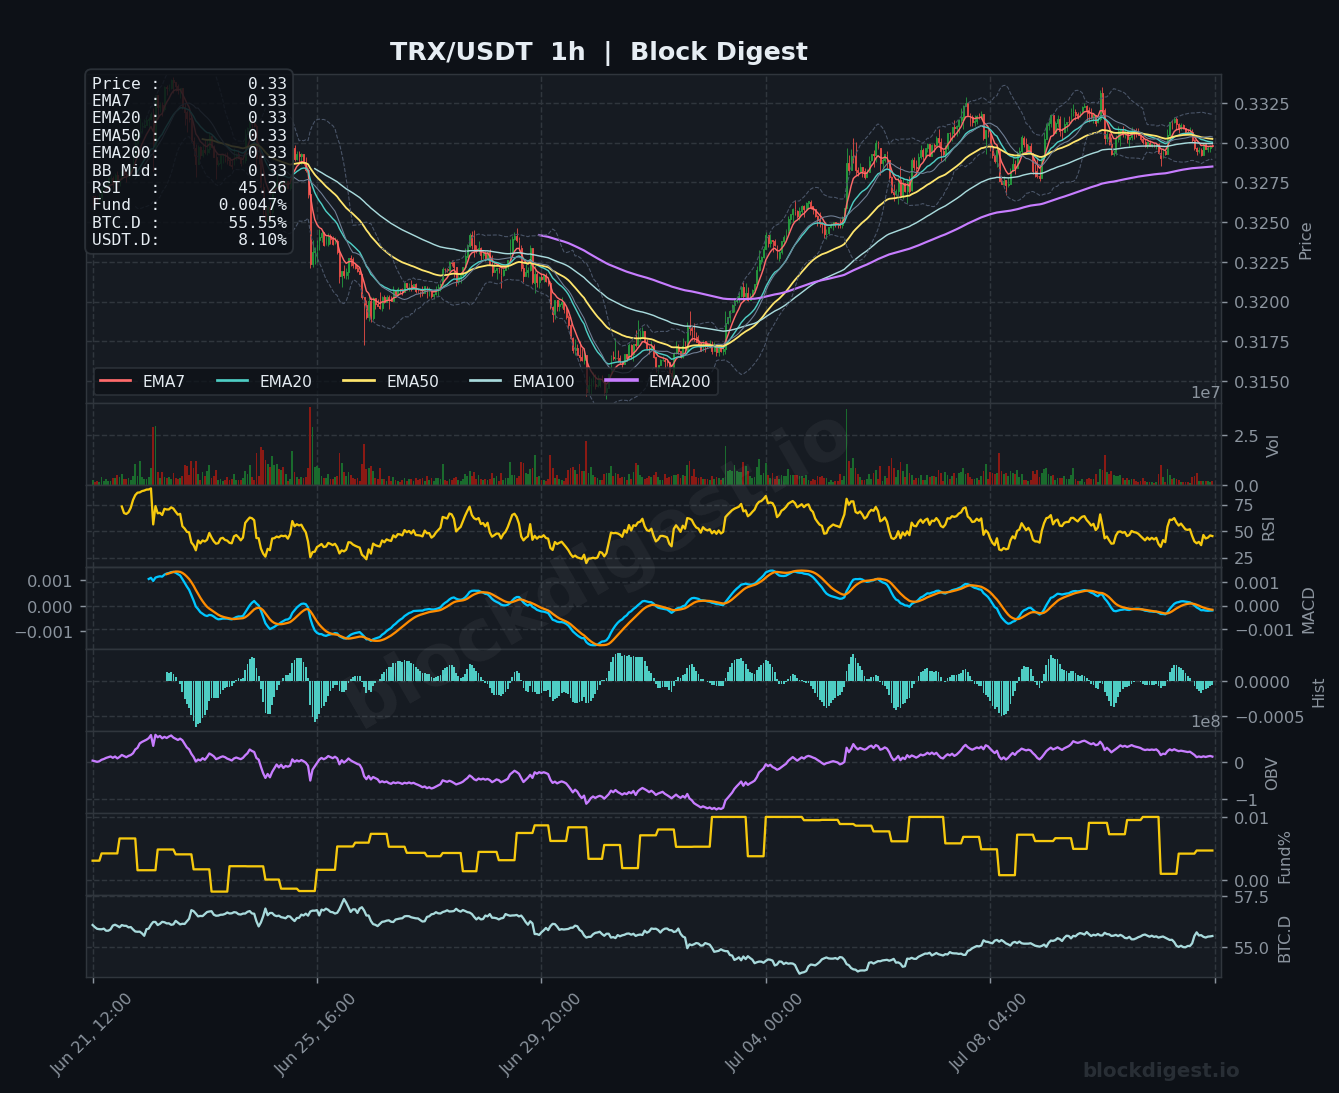
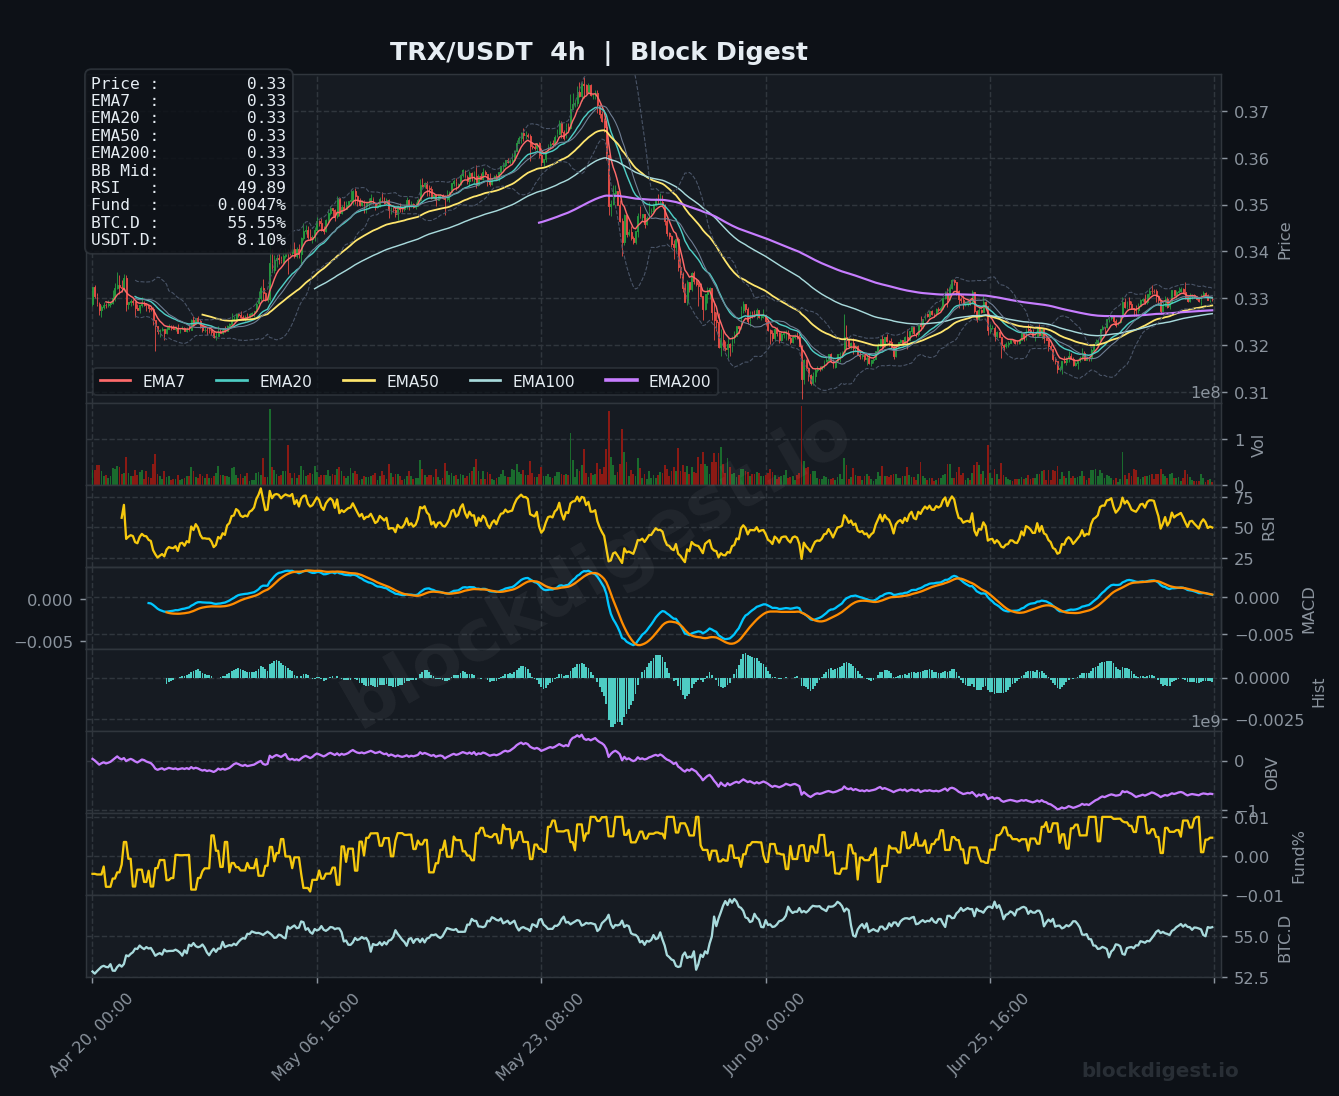
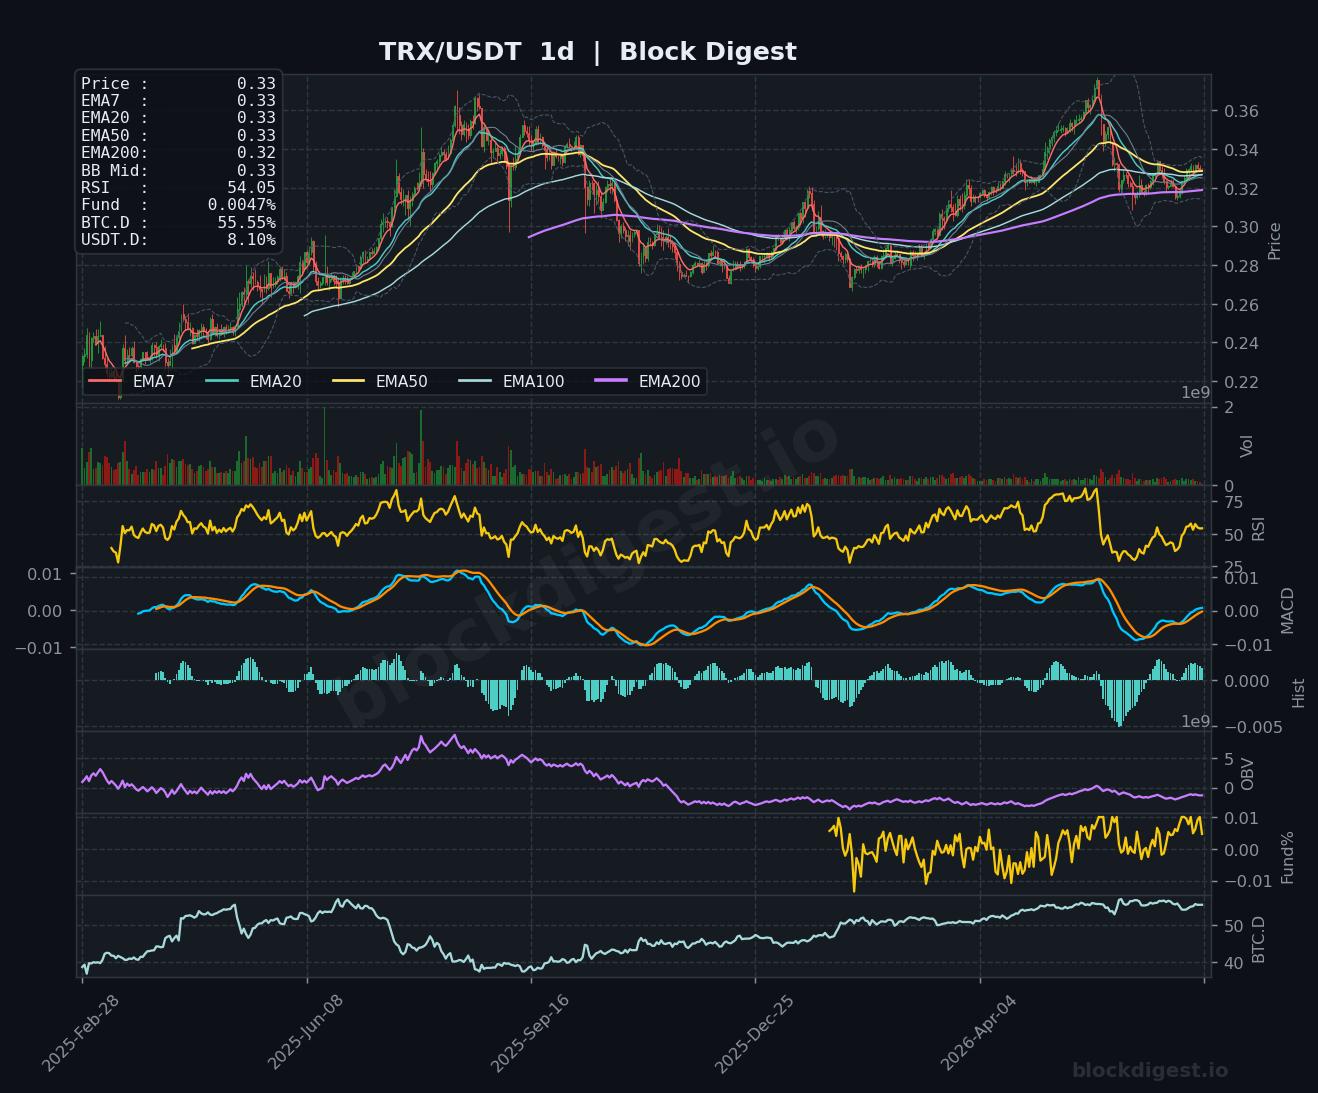
TRX is trading at $0.33, with the 1-hour chart showing all EMAs tightly compressed at the $0.33 level and RSI at 45.26 — reflecting a period of tight consolidation after a notable rally from the $0.317 lows visible in the near-term chart history. The 4-hour RSI at 49.89 is the most neutral reading of the session, with the MACD hovering just below zero and the histogram showing small positive bars, hinting at a tentative bid emerging. On the daily chart, TRX stands out constructively: RSI at 54.05 is the strongest daily reading across all six coins reviewed, the EMA200 ($0.32) has been reclaimed and is now acting as support, and the MACD is attempting a bullish cross — a meaningful signal on the higher timeframe. Key support is $0.328–$0.330, with resistance at the recent highs near $0.335–$0.337; the daily structure makes TRX one of the more resilient names in today’s altcoin landscape.
Altcoin Outlook
Today’s altcoin landscape is broadly under pressure, with most assets trading below key short-to-medium term EMAs, elevated USDT dominance at 8.10%, and BTC dominance at 55.55% continuing to drain liquidity from the altcoin complex. Among the six coins reviewed, TRX and LTC present the most constructive technical setups — TRX for its positive daily RSI and EMA200 reclaim, LTC for its neutral-to-recovering 4-hour and daily momentum structure — while DOGE and XRP exhibit the weakest profiles with deteriorating OBV, sustained downtrends, and RSI readings approaching multi-month lows. SOL and BNB sit in an intermediate zone, with SOL showing strong retail buy interest but failing to hold price above critical EMA support, and BNB consolidating without a clear directional catalyst. The key conditions to watch across the altcoin space are a potential BTC.D rollover below 54.5% — which could unlock broader altcoin flows — and whether USDT.
Disclaimer: This analysis is for informational purposes only and does not constitute financial advice. Cryptocurrency markets are highly volatile and unpredictable. All trading decisions should be made based on your own research and risk tolerance. Block Digest is not responsible for any financial losses incurred as a result of acting on this content.
Stay Ahead of the Market
Follow BlockDigest for crypto market intelligence, research and real-time updates.


