
Market Context
The broader altcoin market is navigating a cautious environment as Bitcoin dominance sits at 54.60% — a level that has historically capped sustained altcoin rallies — while USDT dominance at 8.12% signals that a meaningful portion of capital remains parked on the sidelines. The mixed 24-hour performance across the six coins reviewed today reflects a market still searching for directional conviction, with BTC trading in a volatile $61k–$64k range following Strategy’s $216M sale adding overhead pressure. Select ecosystems, particularly BNB and TRON, are showing relative resilience, while legacy altcoins and higher-beta names like DOGE continue to struggle against the macro headwinds.
Solana (SOL)
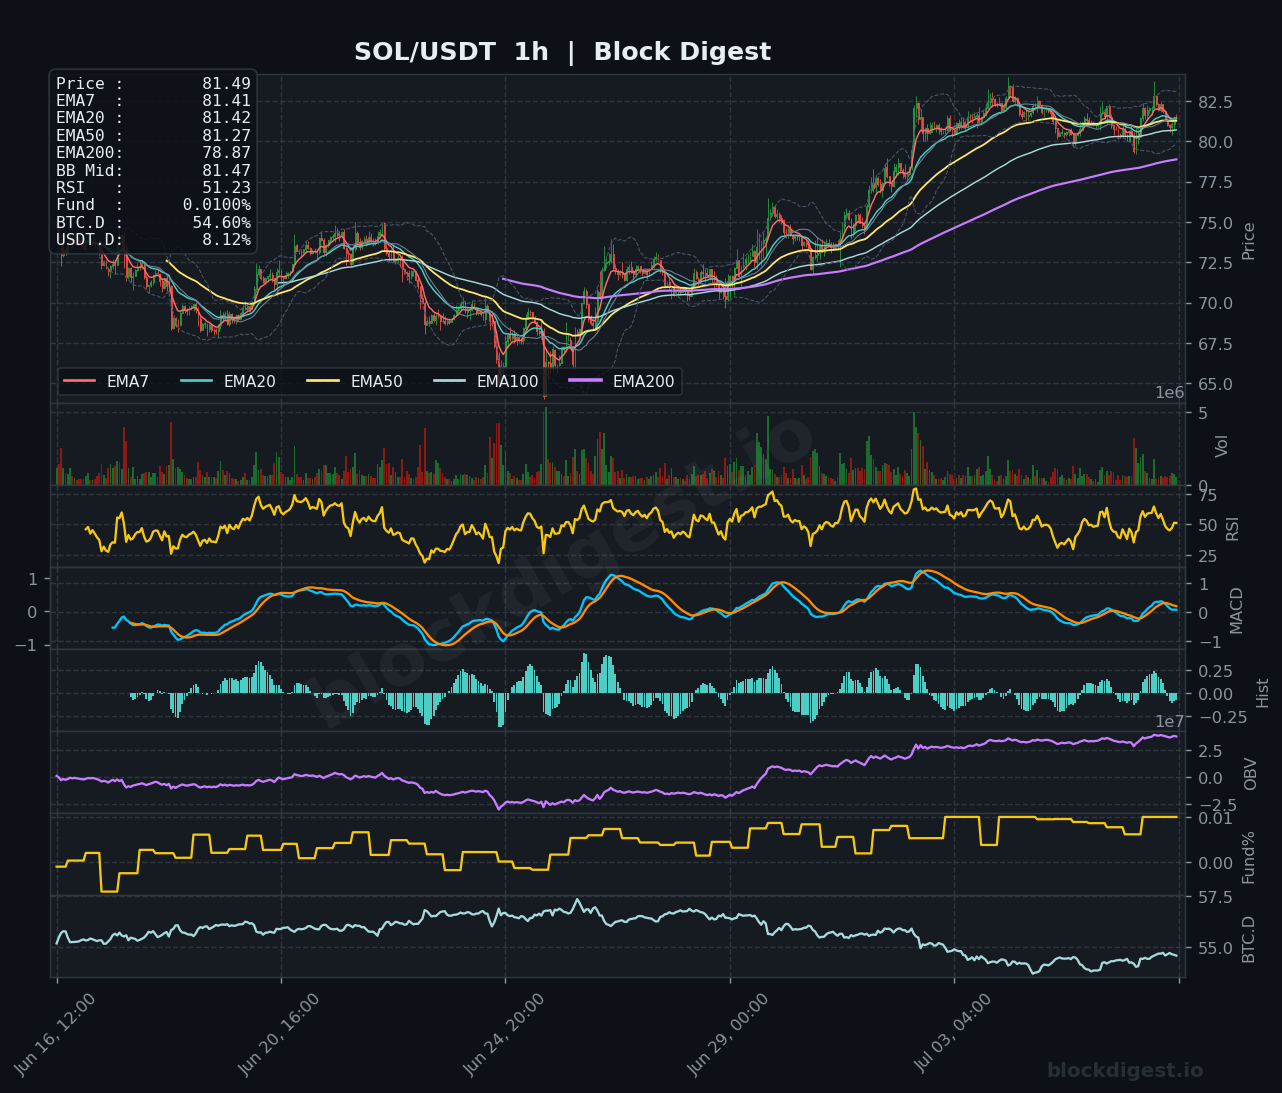
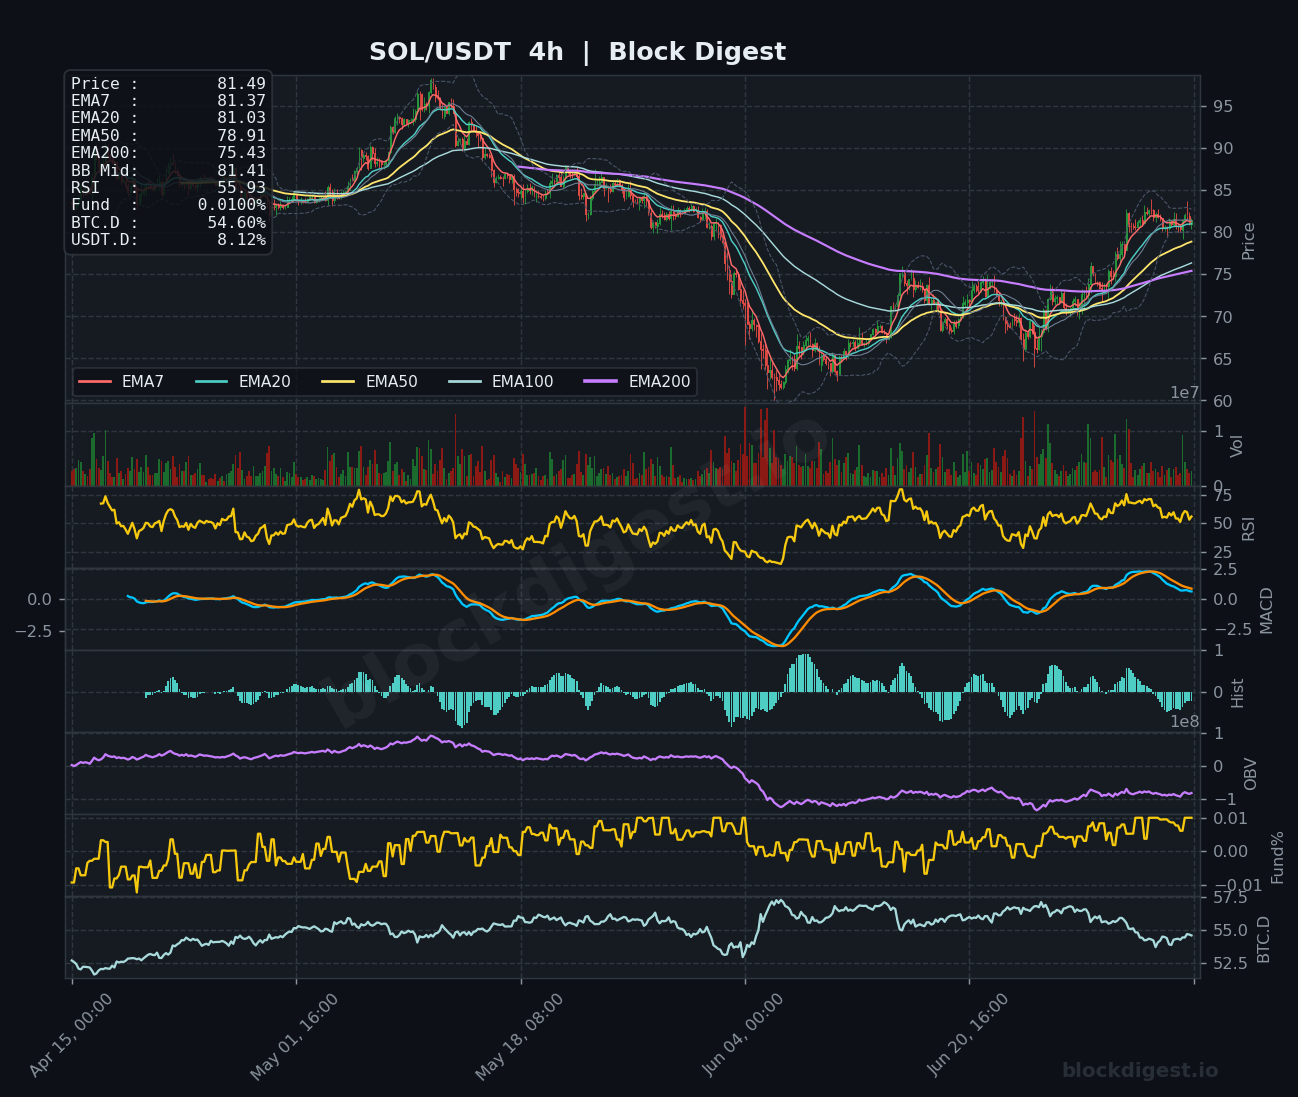
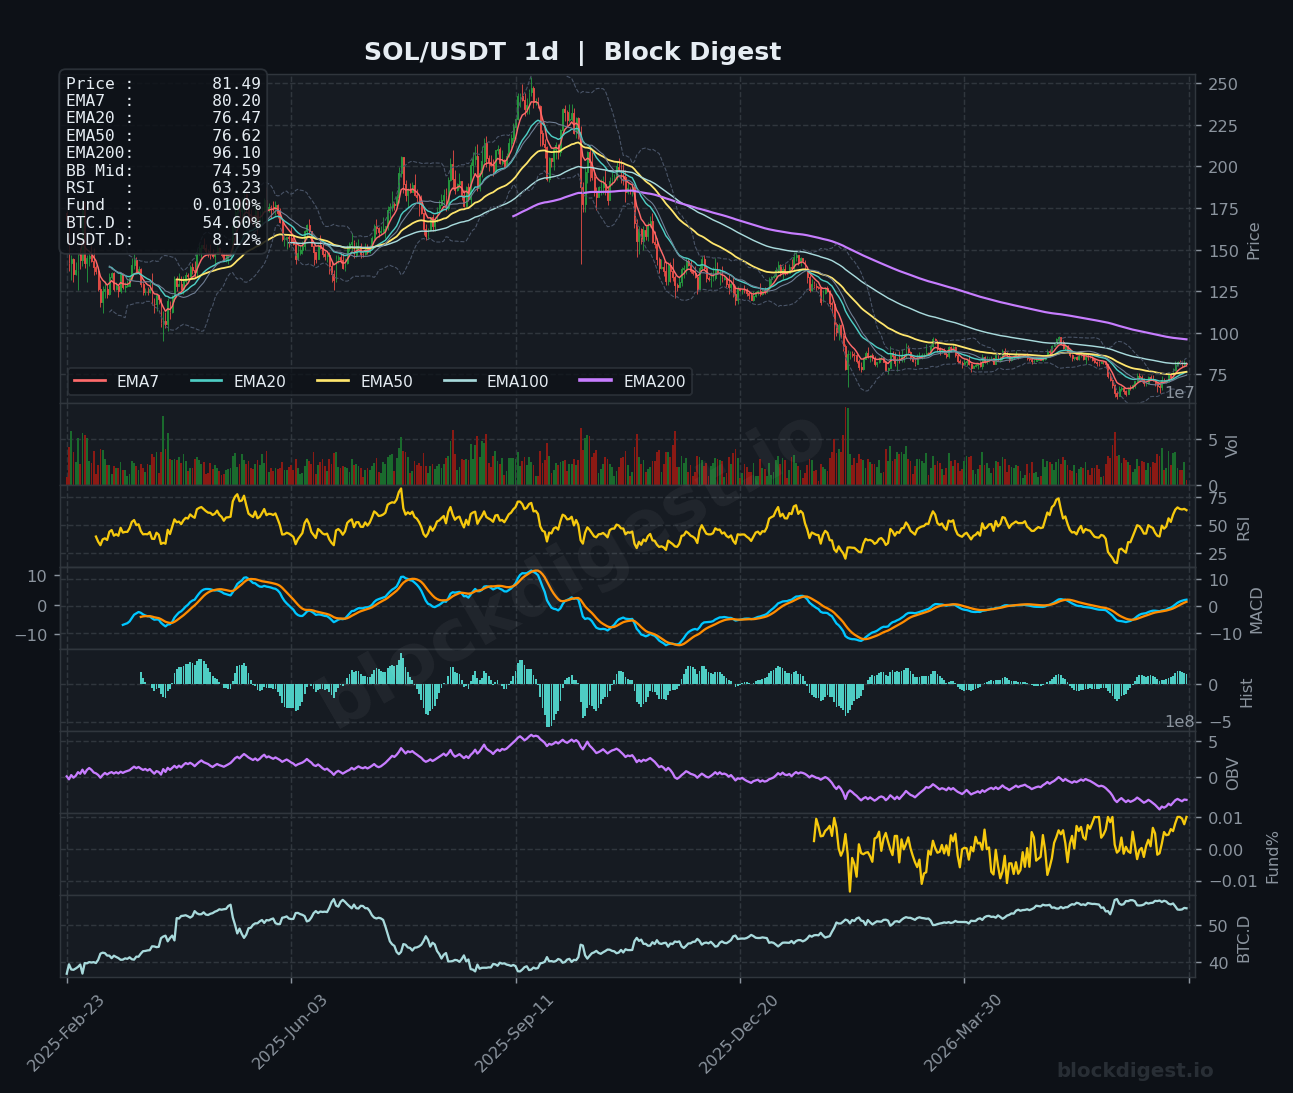
SOL is trading at $80.88, consolidating just above the $80 psychological support level after staging a notable recovery from lows near $65 seen in recent weeks. On the 1h chart, all short-term EMAs (EMA7 at $81.41, EMA20 at $81.42, EMA50 at $81.27) are tightly clustered, indicating compression and an impending directional move, while the RSI at 51.23 sits at a neutral midpoint. The 4h timeframe shows a more constructive picture, with price reclaiming the EMA7 ($81.37) and EMA20 ($81.03) from below and the RSI recovering to 55.93, while the MACD signal line is curling upward out of negative territory — a tentative bullish cross in progress. On the daily chart, RSI has climbed to 63.23 and price trades above both the EMA7 ($80.20) and EMA20 ($76.47), though the looming EMA200 at $96.10 remains a formidable longer-term resistance; short-term bias is cautiously bullish with $78–$79 as the key support floor to hold.
XRP (XRP)
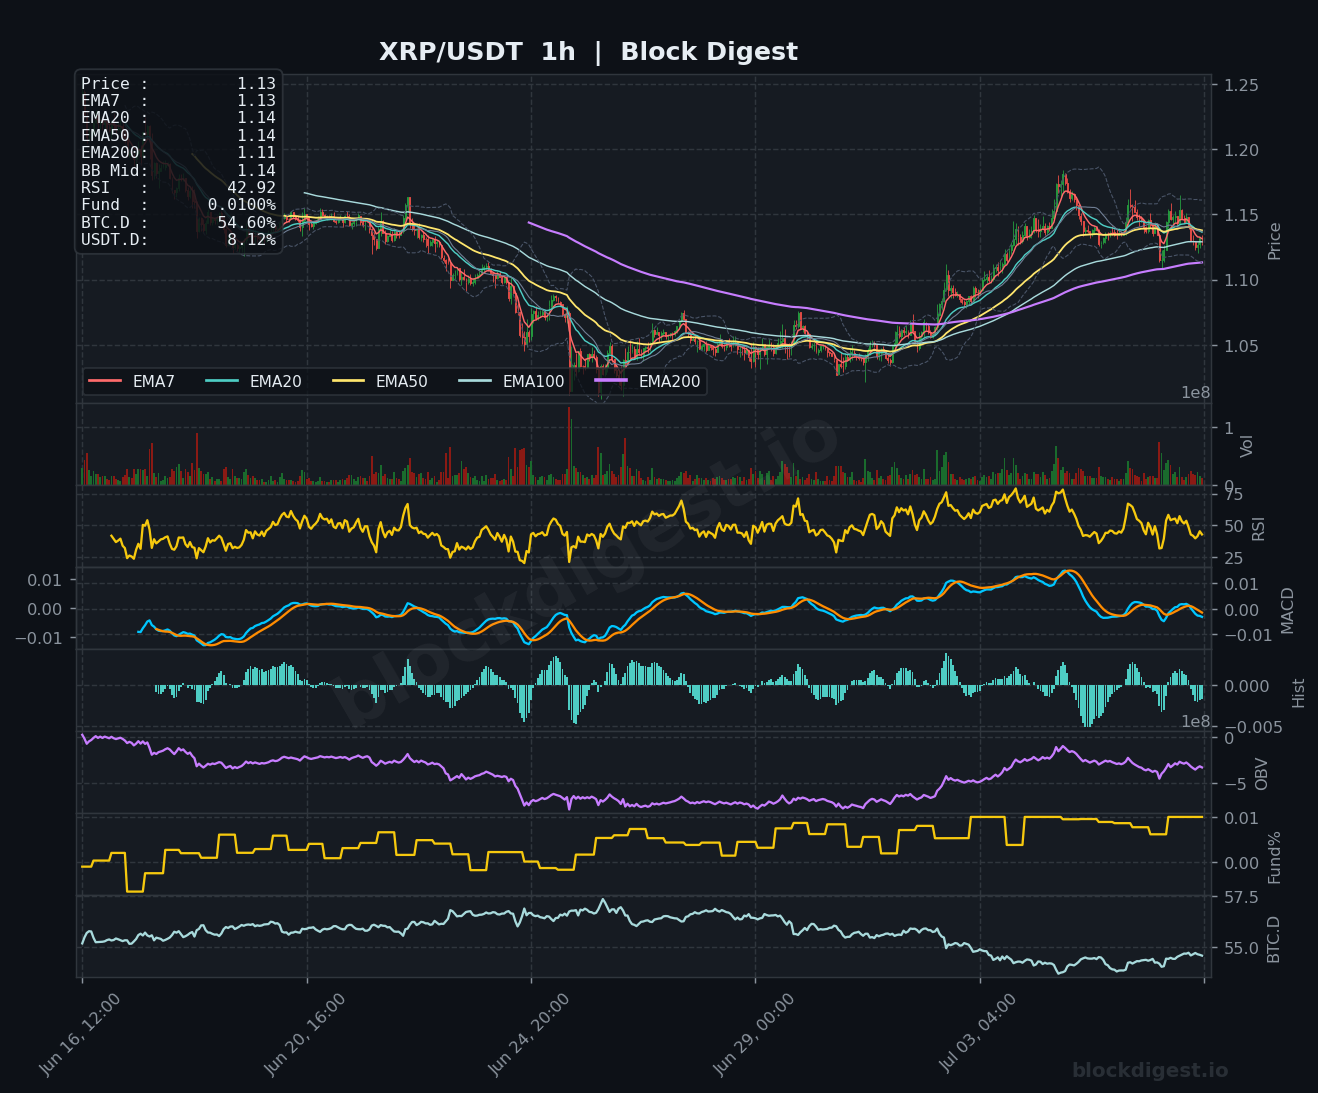
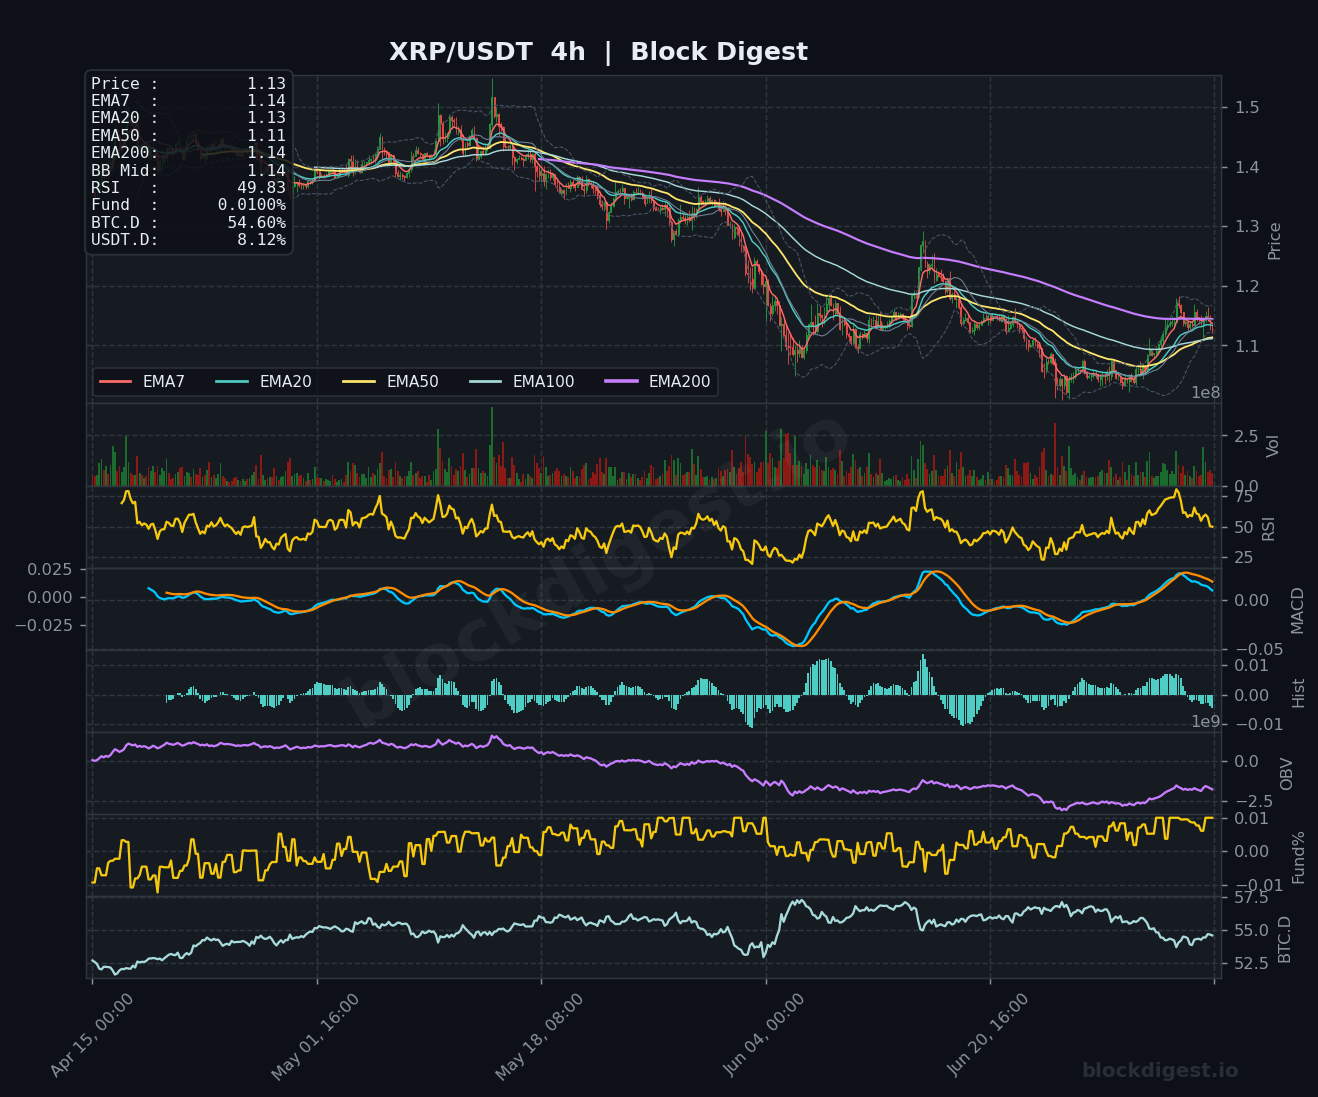
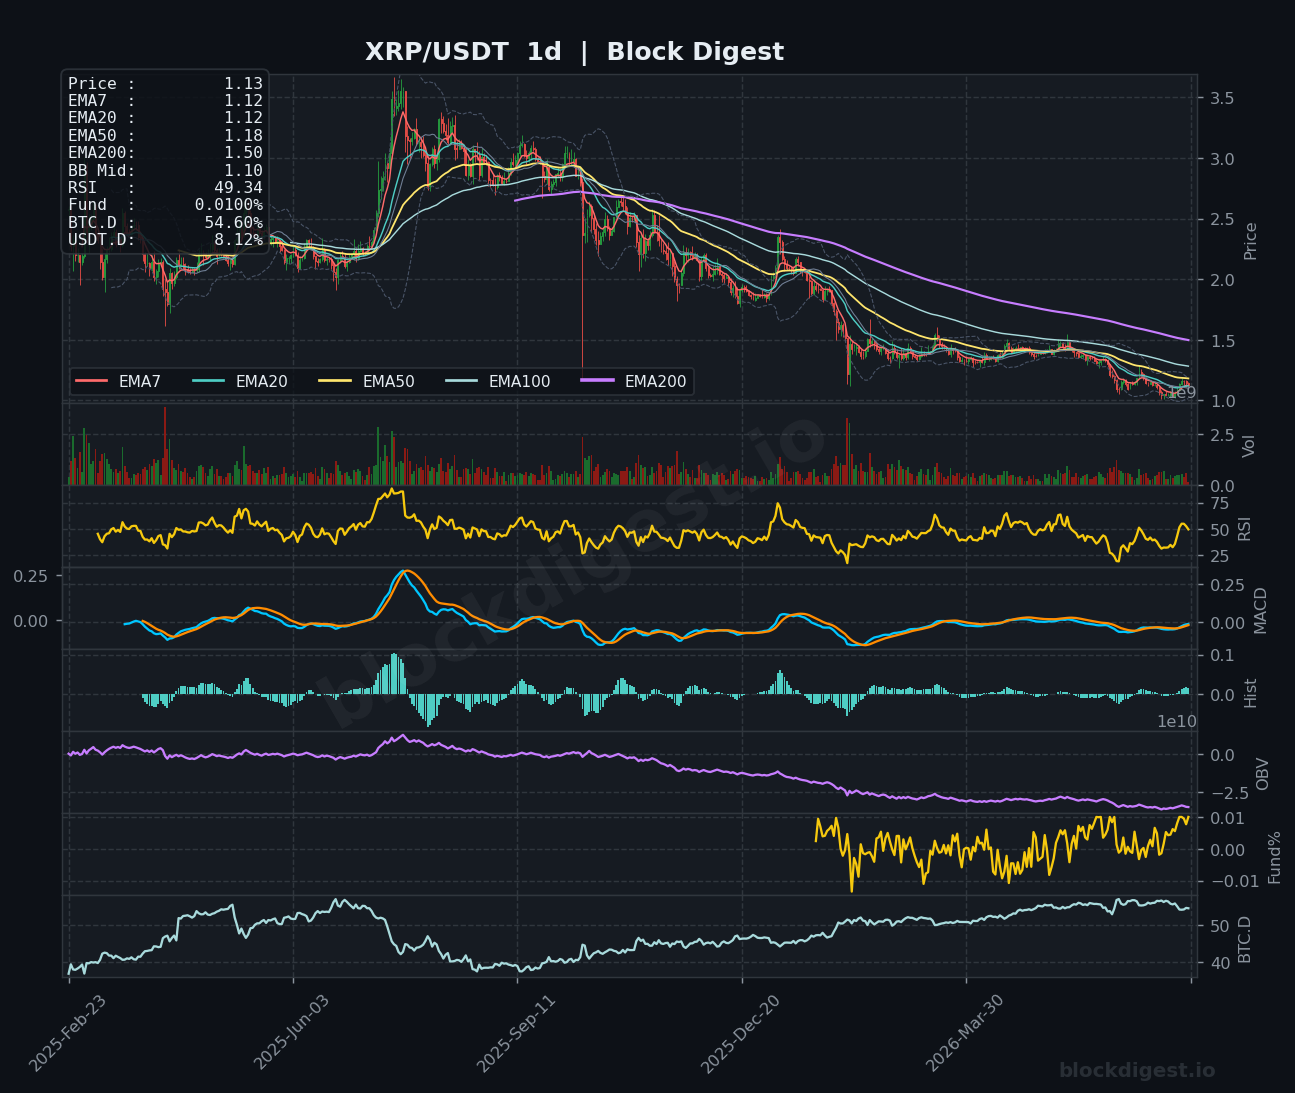
XRP is trading at $1.12–$1.13, struggling to sustain momentum after a recovery attempt from the $1.05 lows, with the 1h RSI sitting at a bearish 42.92 and price currently below the BB mid at $1.14, suggesting near-term softness. The 4h chart shows price caught between declining EMAs — the EMA200 ($1.14) acting as immediate resistance and the EMA50 ($1.11) providing near-term support — while the MACD is attempting a bullish cross near zero but remains unconvincing. The daily chart paints a structurally challenged picture: price sits well below the EMA50 ($1.18) and the distant EMA200 ($1.50), with OBV on a persistent downtrend reflecting sustained distribution pressure since the 2025 peak above $3.00. Despite the positive regulatory catalyst of Ripple securing Luxembourg CASP authorization, the technical setup warrants caution, and a reclaim of $1.20 on volume would be needed to shift the short-term bias to bullish.
BNB (BNB)
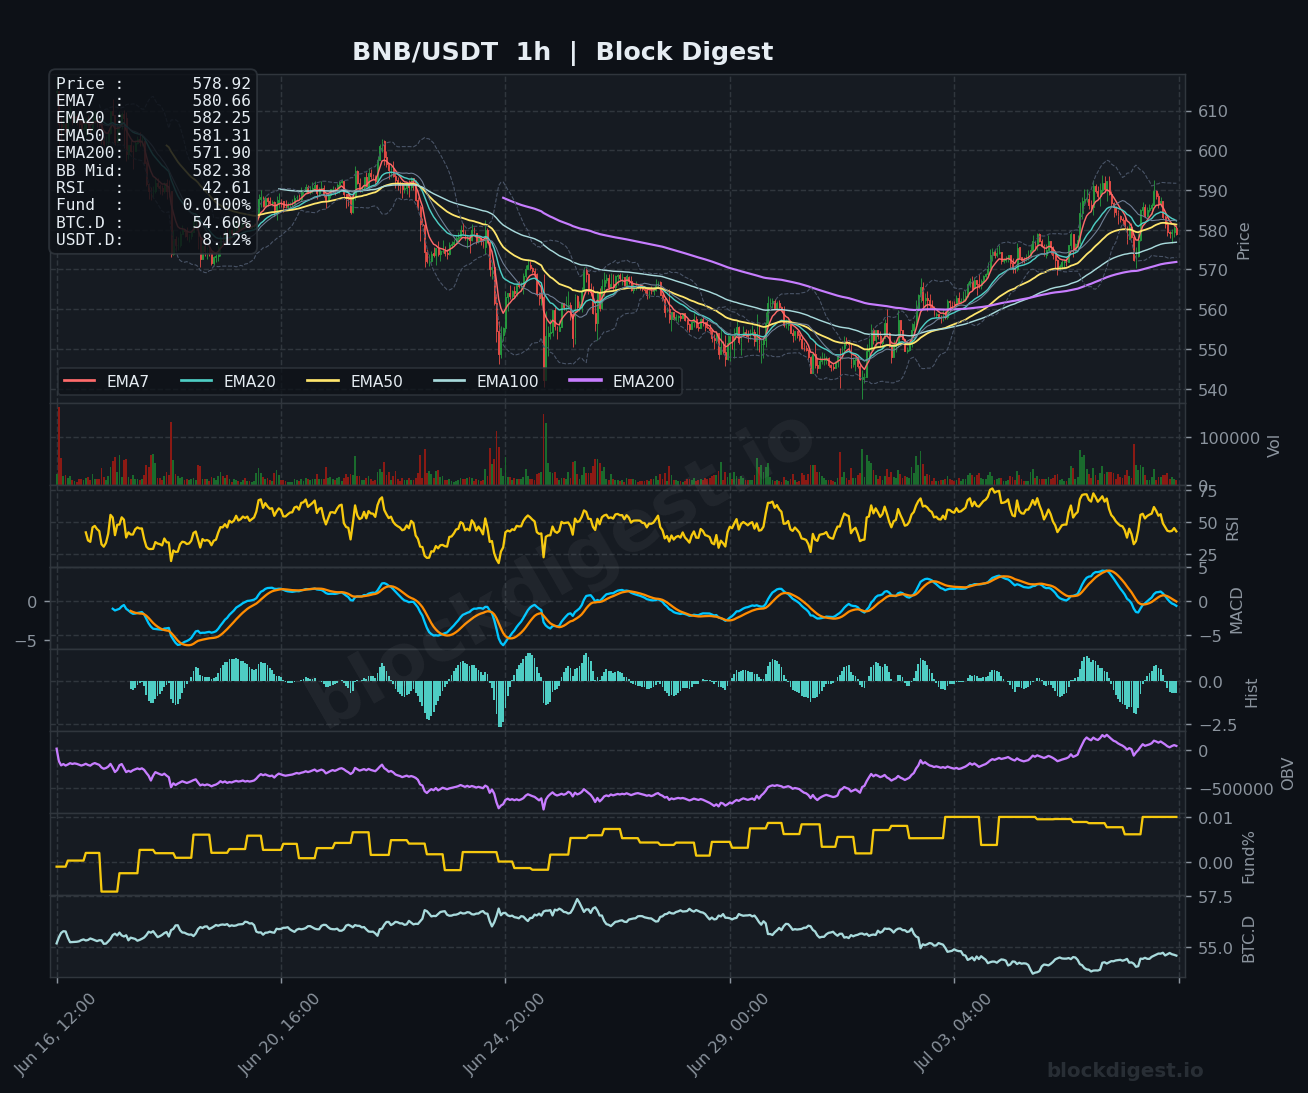
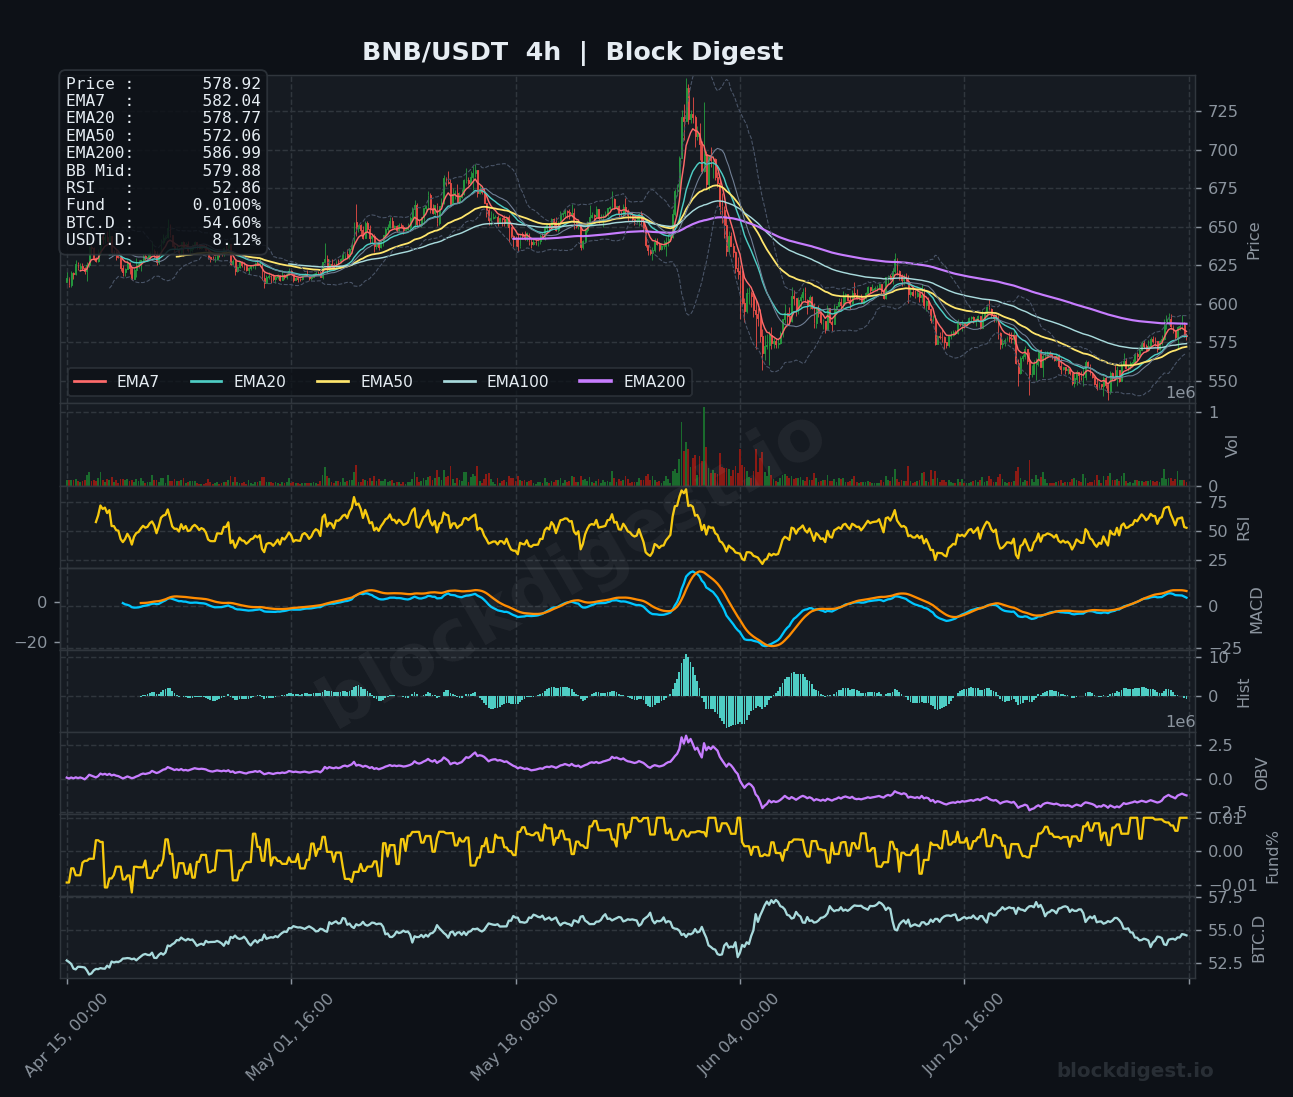
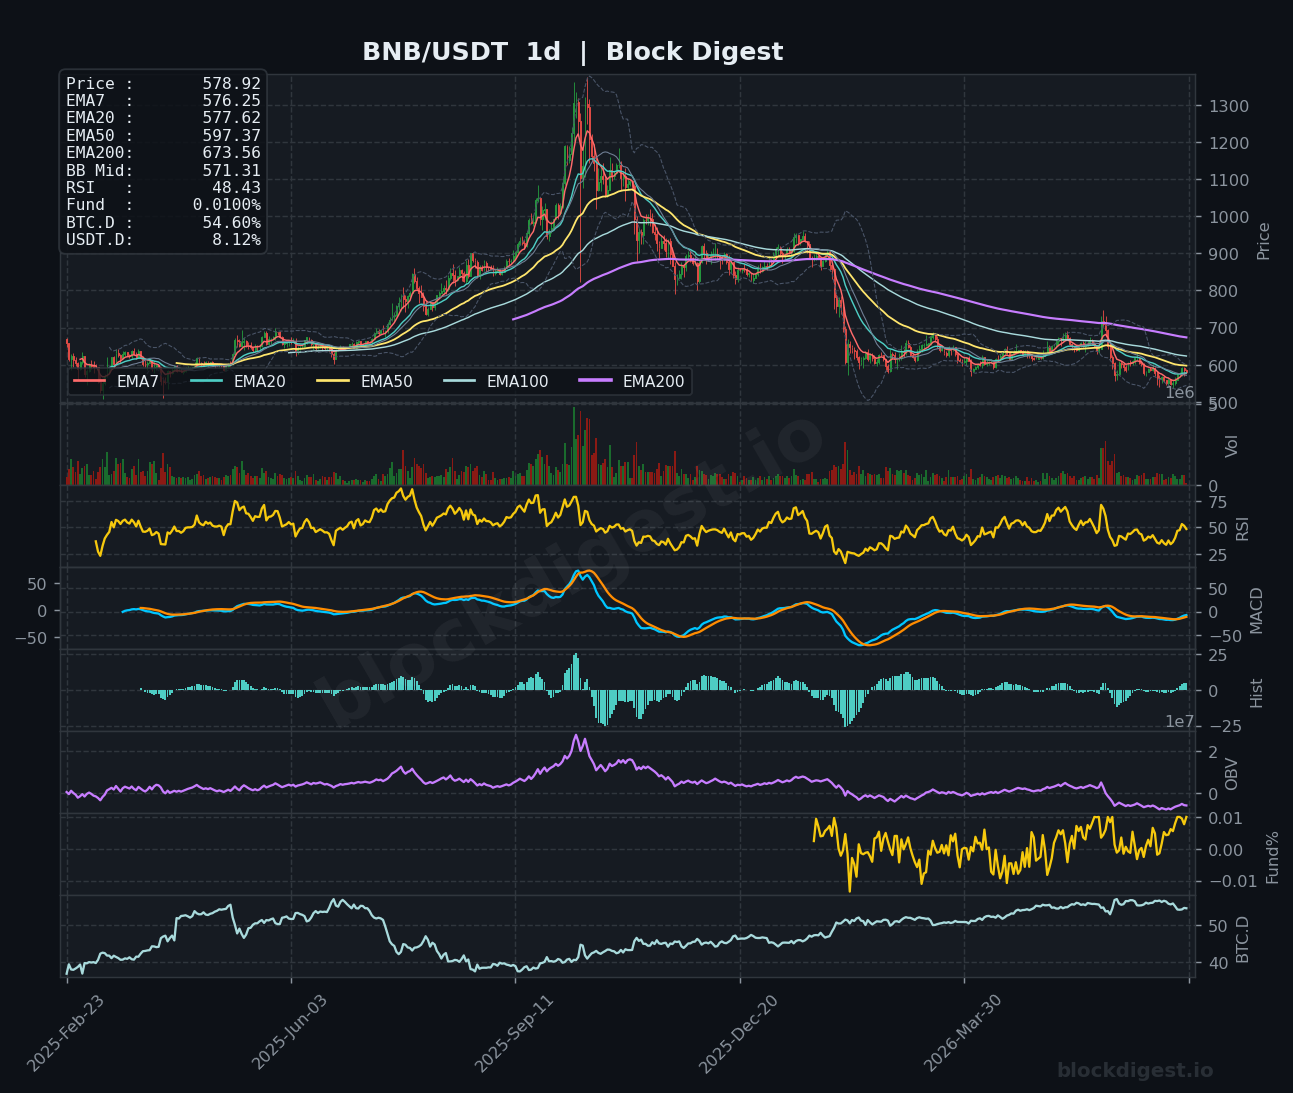
BNB is the standout performer among today’s covered coins, trading at $578–$585 and posting a +2.72% gain on the day, buoyed by strong relative price action that has seen it recover from sub-$545 lows. The 1h chart shows price pulling back slightly from recent highs near $595, with the RSI cooling to 42.61 after a stretch of overbought conditions — this represents a healthy consolidation rather than a trend reversal, with the EMA200 ($571.90) now acting as a rising dynamic support. On the 4h timeframe, the MACD has staged a constructive bullish cross and is trending upward toward zero, with RSI at 52.86 in neutral-to-bullish territory and price reclaiming the EMA7 ($582.04) and EMA20 ($578.77). The daily chart remains under the EMA50 ($597.37) and the heavily declining EMA200 ($673.56), so the broader structure is still bearish; however, the short-term setup favors dip-buyers with $570–$572 as the key support zone and $595–$600 as immediate topside resistance.
Dogecoin (DOGE)
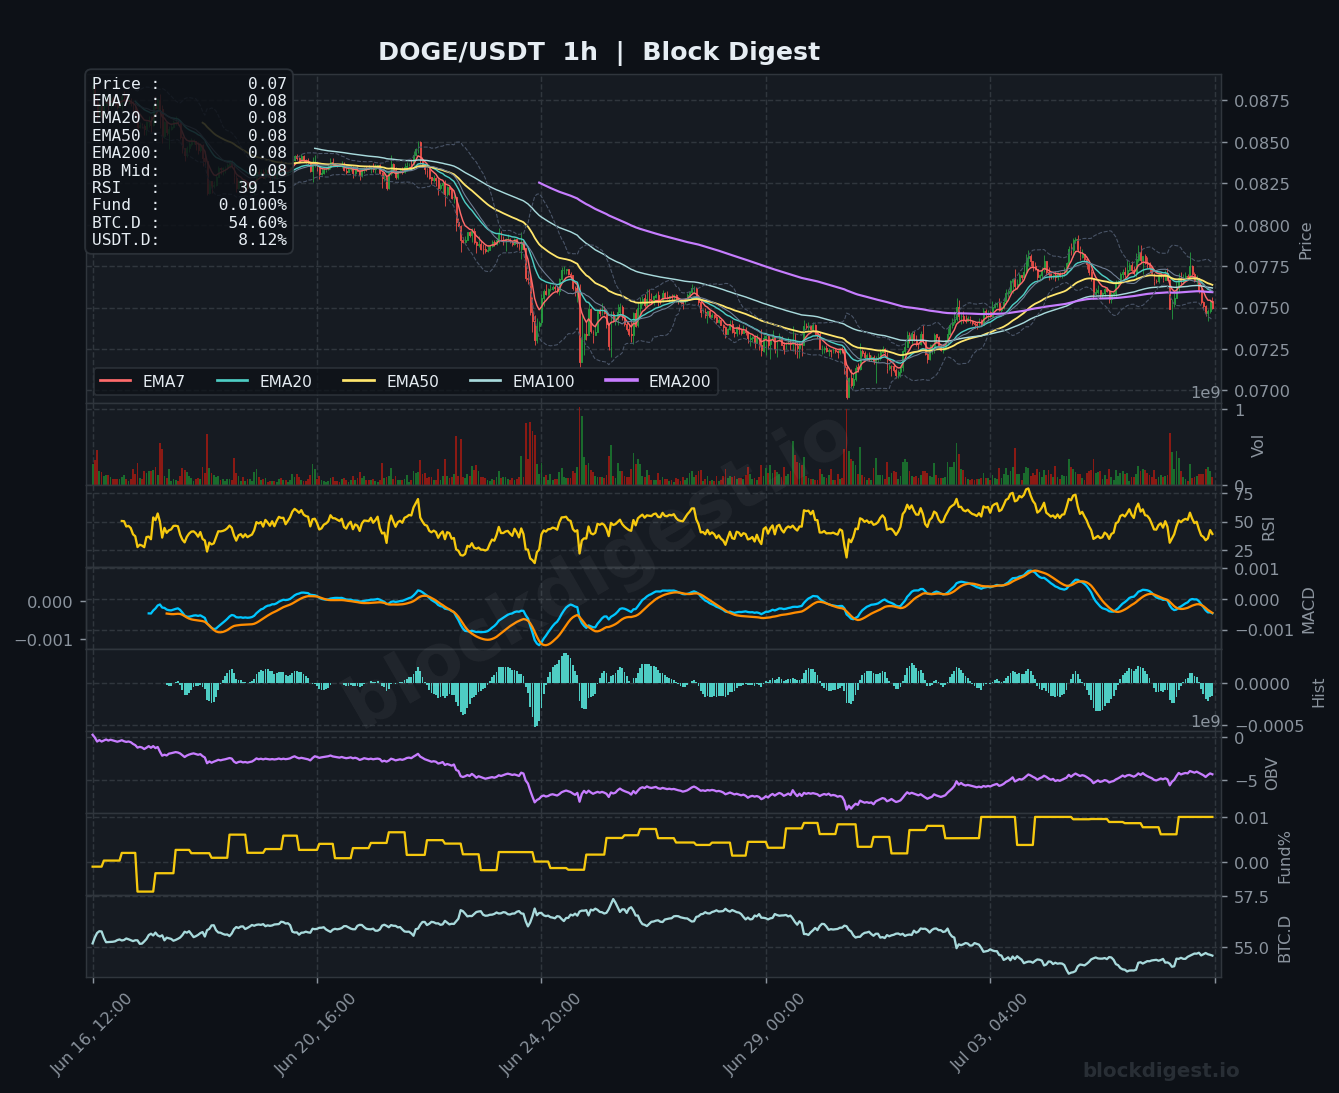
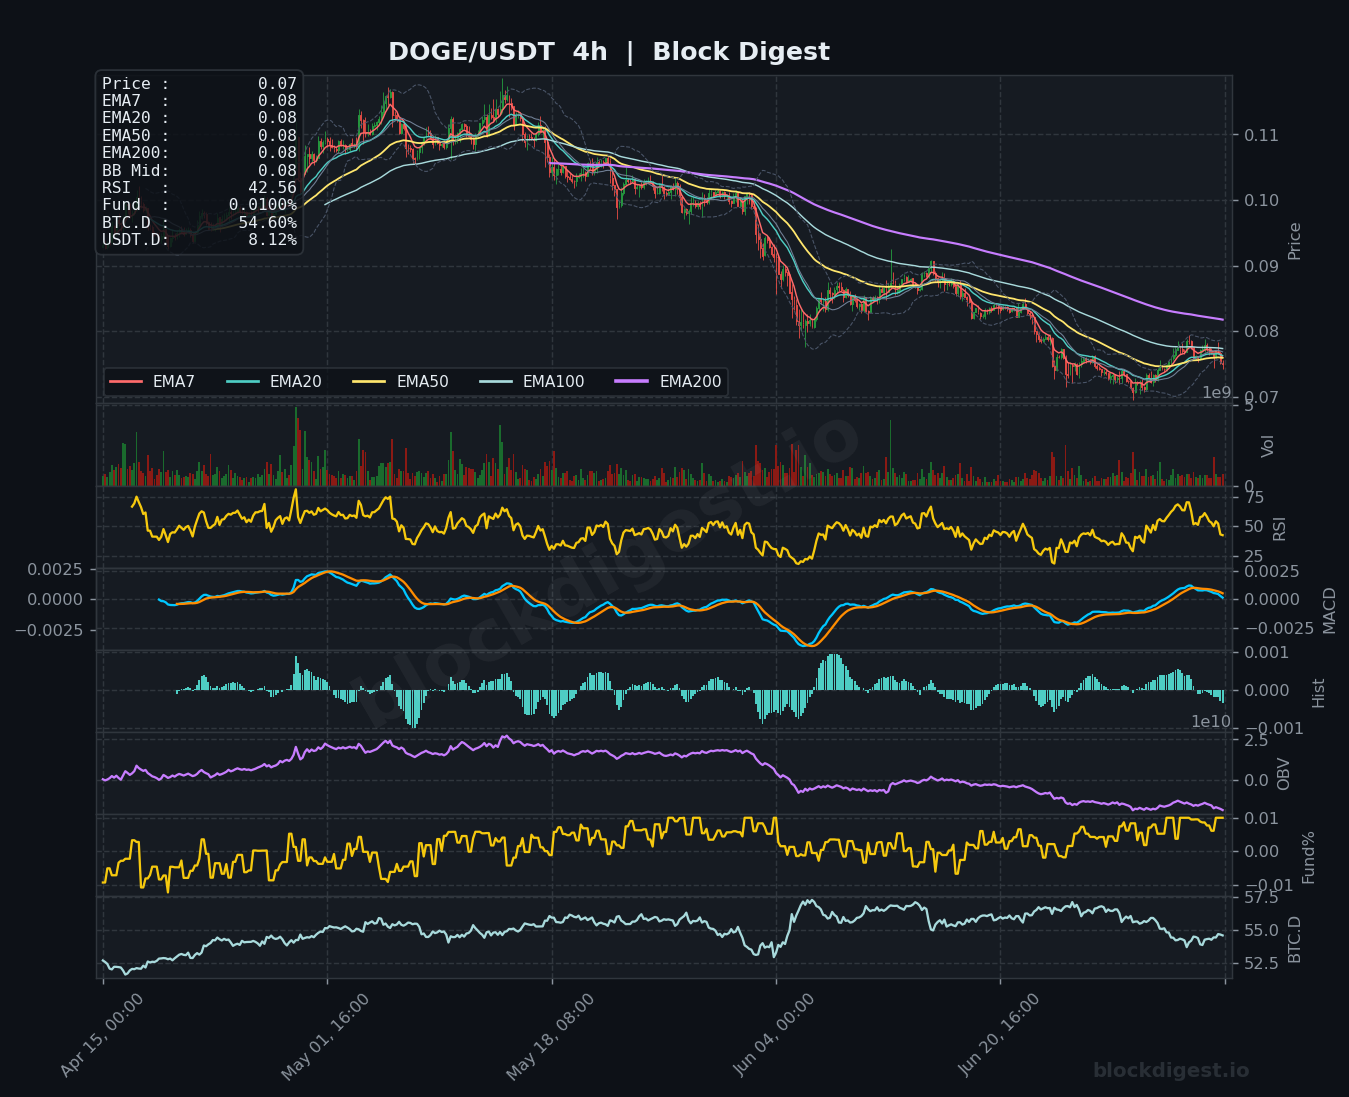
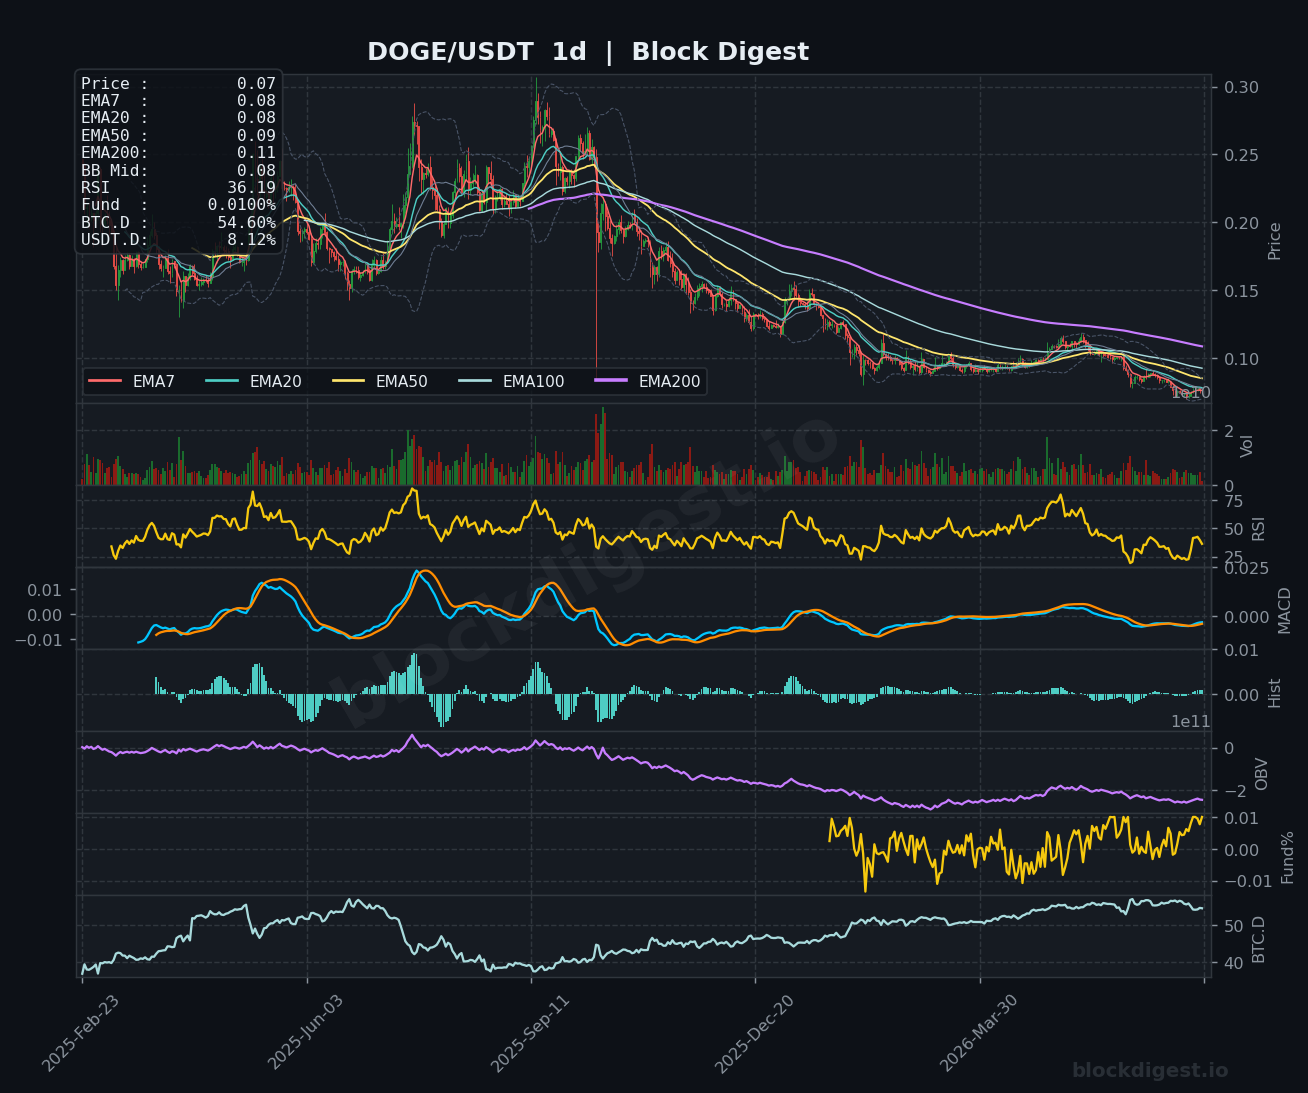
DOGE is trading at approximately $0.0766, and the technical picture across all timeframes remains one of the weakest in today’s review. The 1h RSI sits at a near-oversold 39.15 with price trading below all key EMAs and the MACD histogram generating bearish bars, while the OBV continues to slope downward reflecting persistent sell pressure. The 4h chart shows price languishing near the lower Bollinger Band with an RSI of 42.56 and MACD struggling to break above the zero line — the extended EMA stack in full bearish alignment (EMA7 through EMA200 all declining) leaves little structural support until the $0.070–$0.072 zone. On the daily chart, RSI has deteriorated to 36.19, approaching oversold territory, and the EMA200 ($0.11) is entirely out of reach, confirming DOGE is in a prolonged downtrend since its 2025 highs near $0.28. A daily close above $0.080 with volume confirmation would be the minimum requirement to shift bias from bearish to neutral.
Litecoin (LTC)
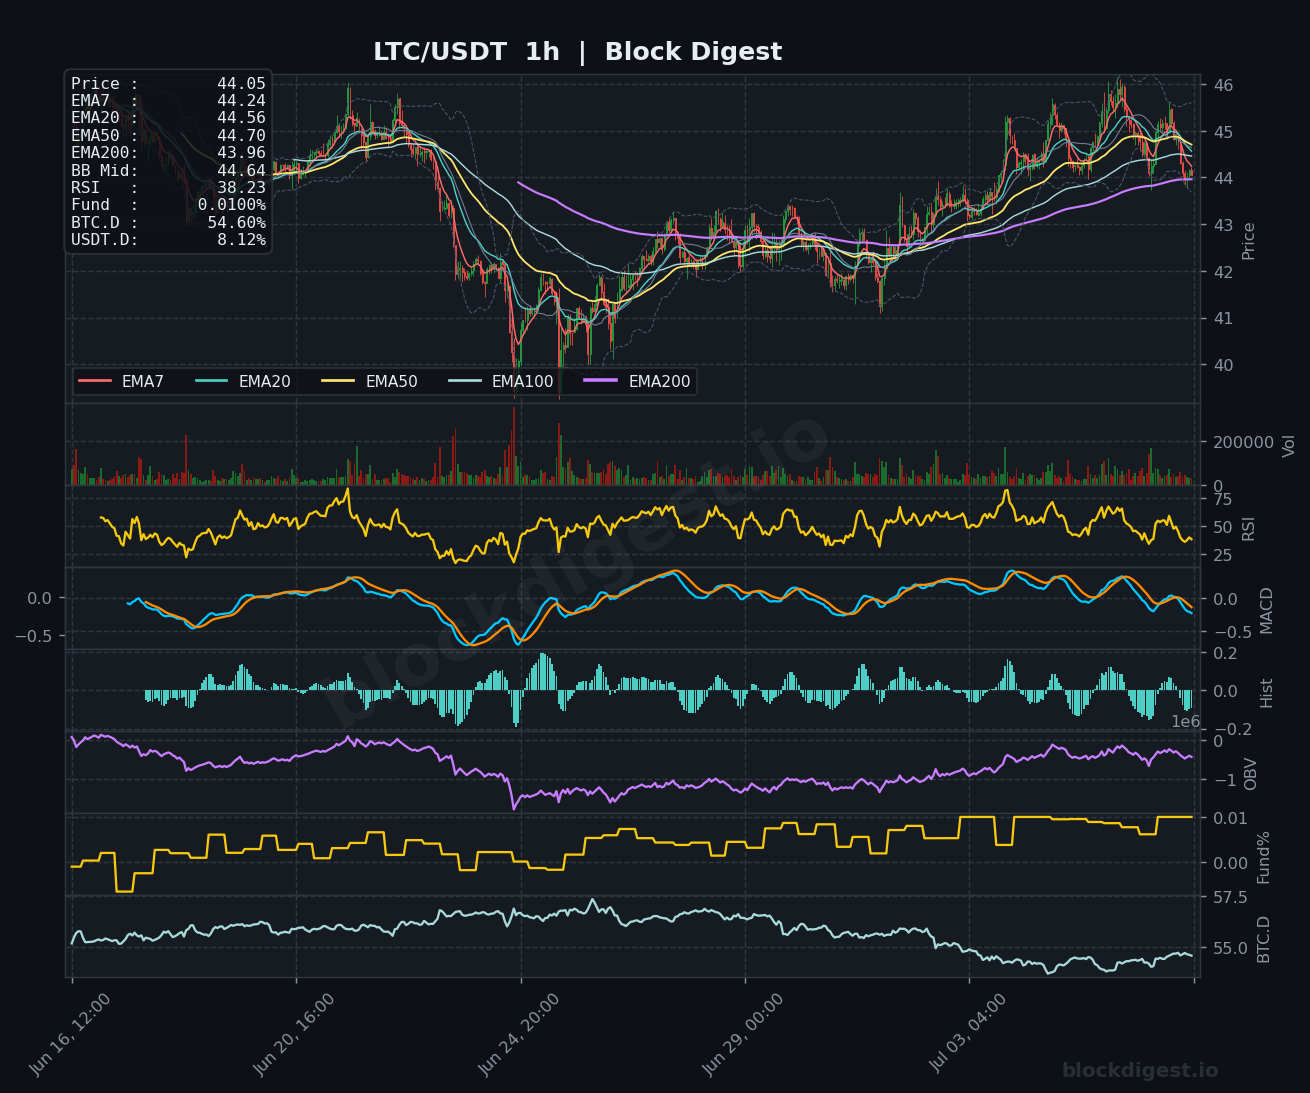
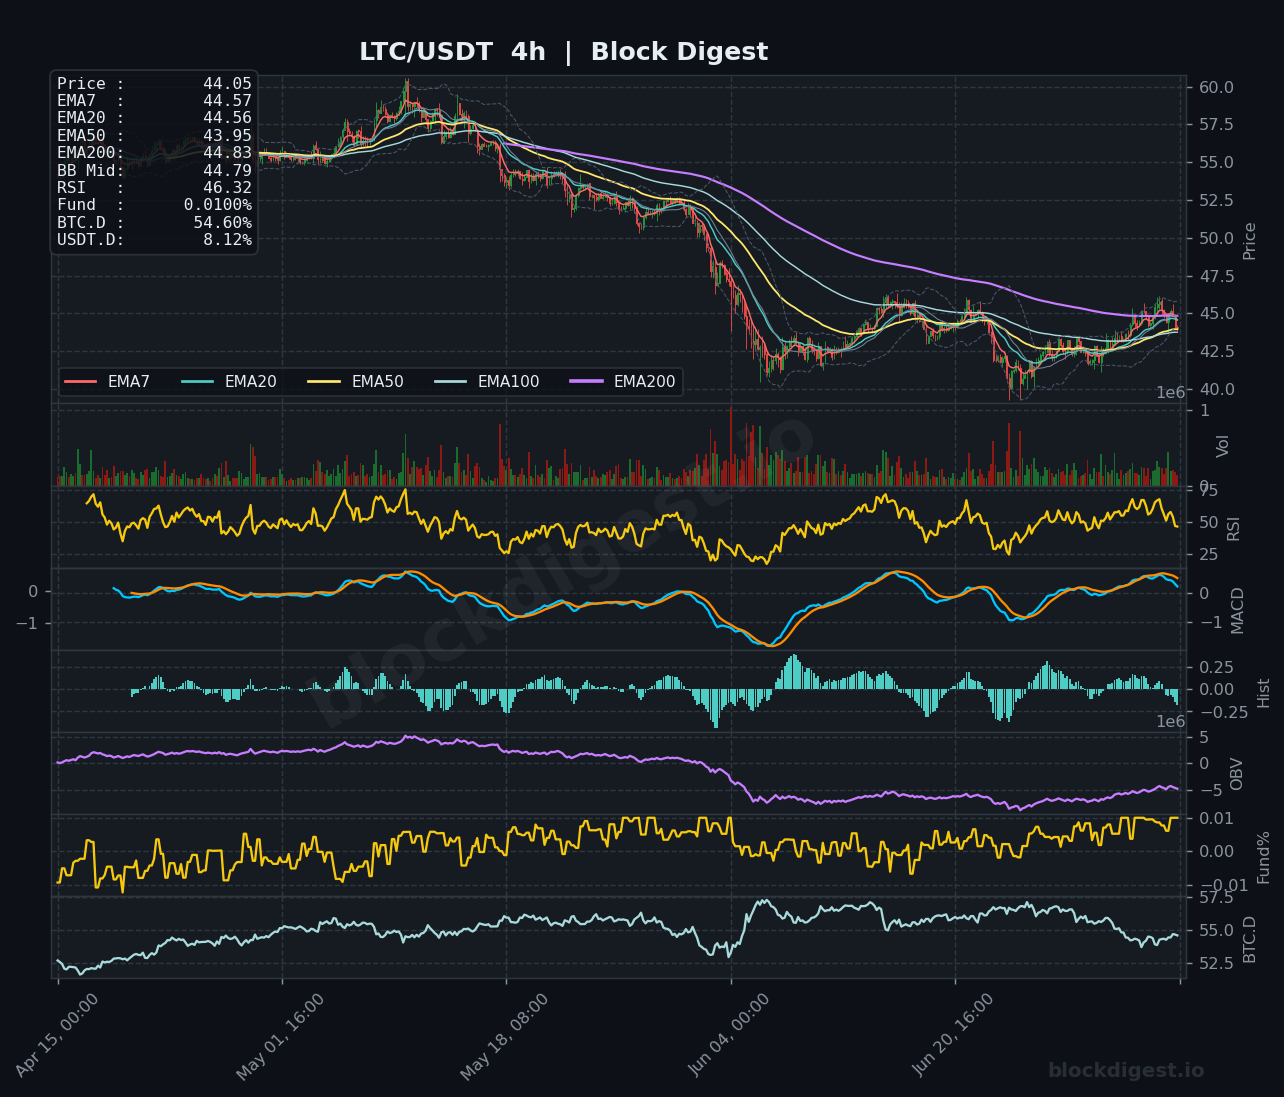
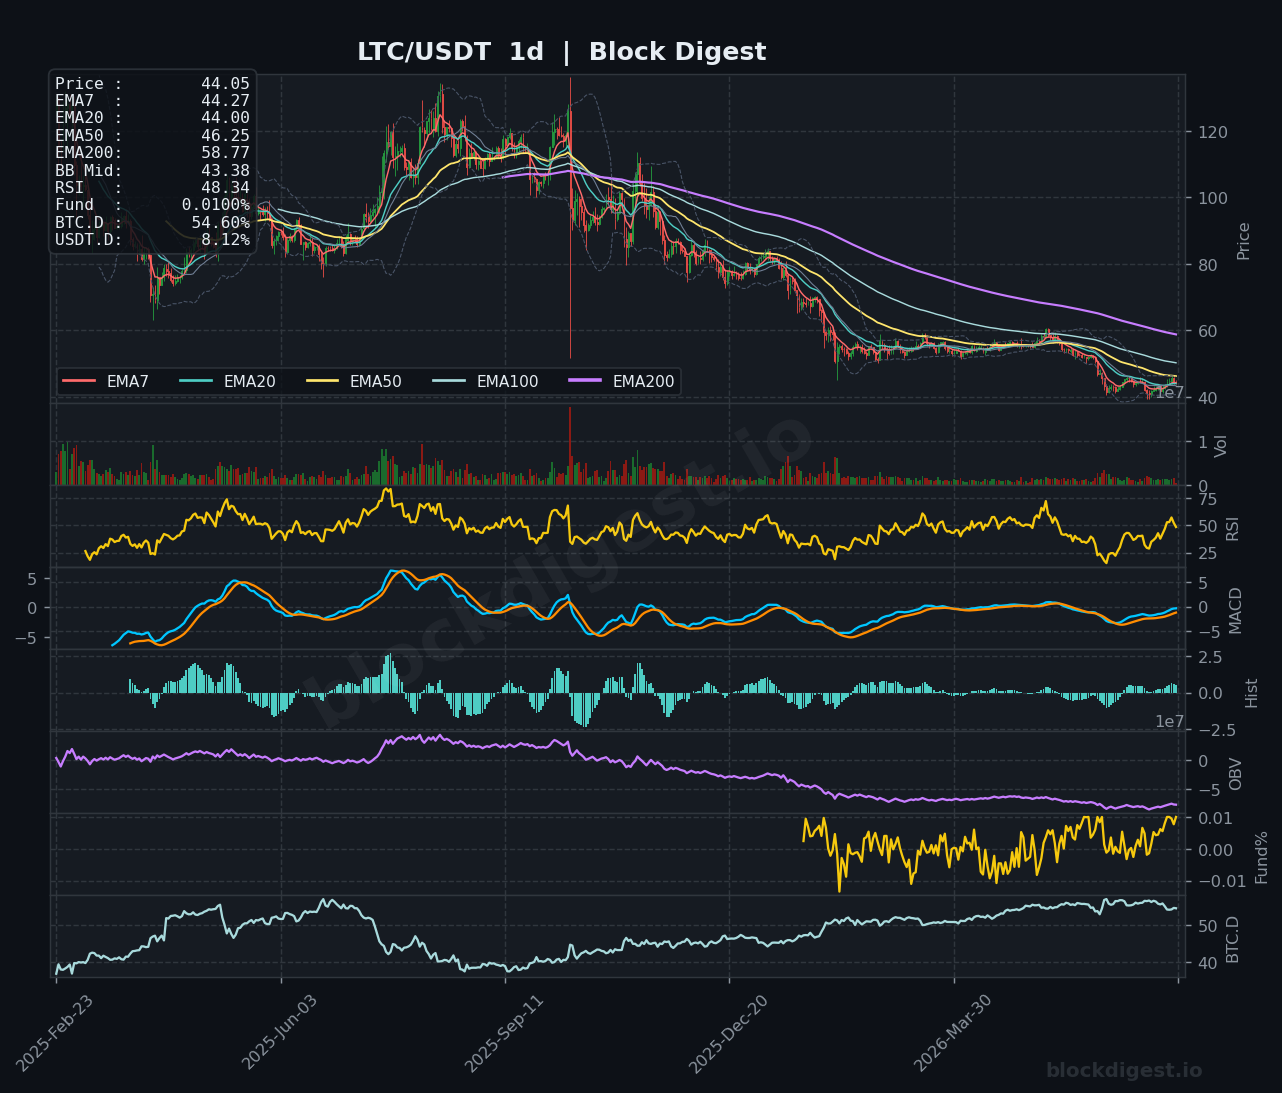
LTC trades at $44.05, wedged in a tight range between $42 and $46 that has defined its consolidation phase following a steep decline from the $120+ levels seen earlier in the cycle. The 1h chart shows RSI at 38.23 and price slipping below the EMA7 ($44.24) and EMA20 ($44.56), with the MACD beginning a bearish cross near zero — suggesting the near-term momentum has shifted to the downside within the range. On the 4h timeframe, RSI at 46.32 is neutral but the EMA200 ($44.83) is acting as immediate overhead resistance, and the OBV shows a gradual recovery from deep lows though it lacks conviction. The daily chart shows price trapped between the EMA7 ($44.27) and EMA20 ($44.00) with RSI at 48.34 — essentially flat momentum — while the EMA50 ($46.25) and EMA200 ($58.77) both represent significant overhead supply; bias is neutral with a slight bearish lean, and $42.00–$42.50 remains the critical demand zone to watch on any further weakness.
TRON (TRX)
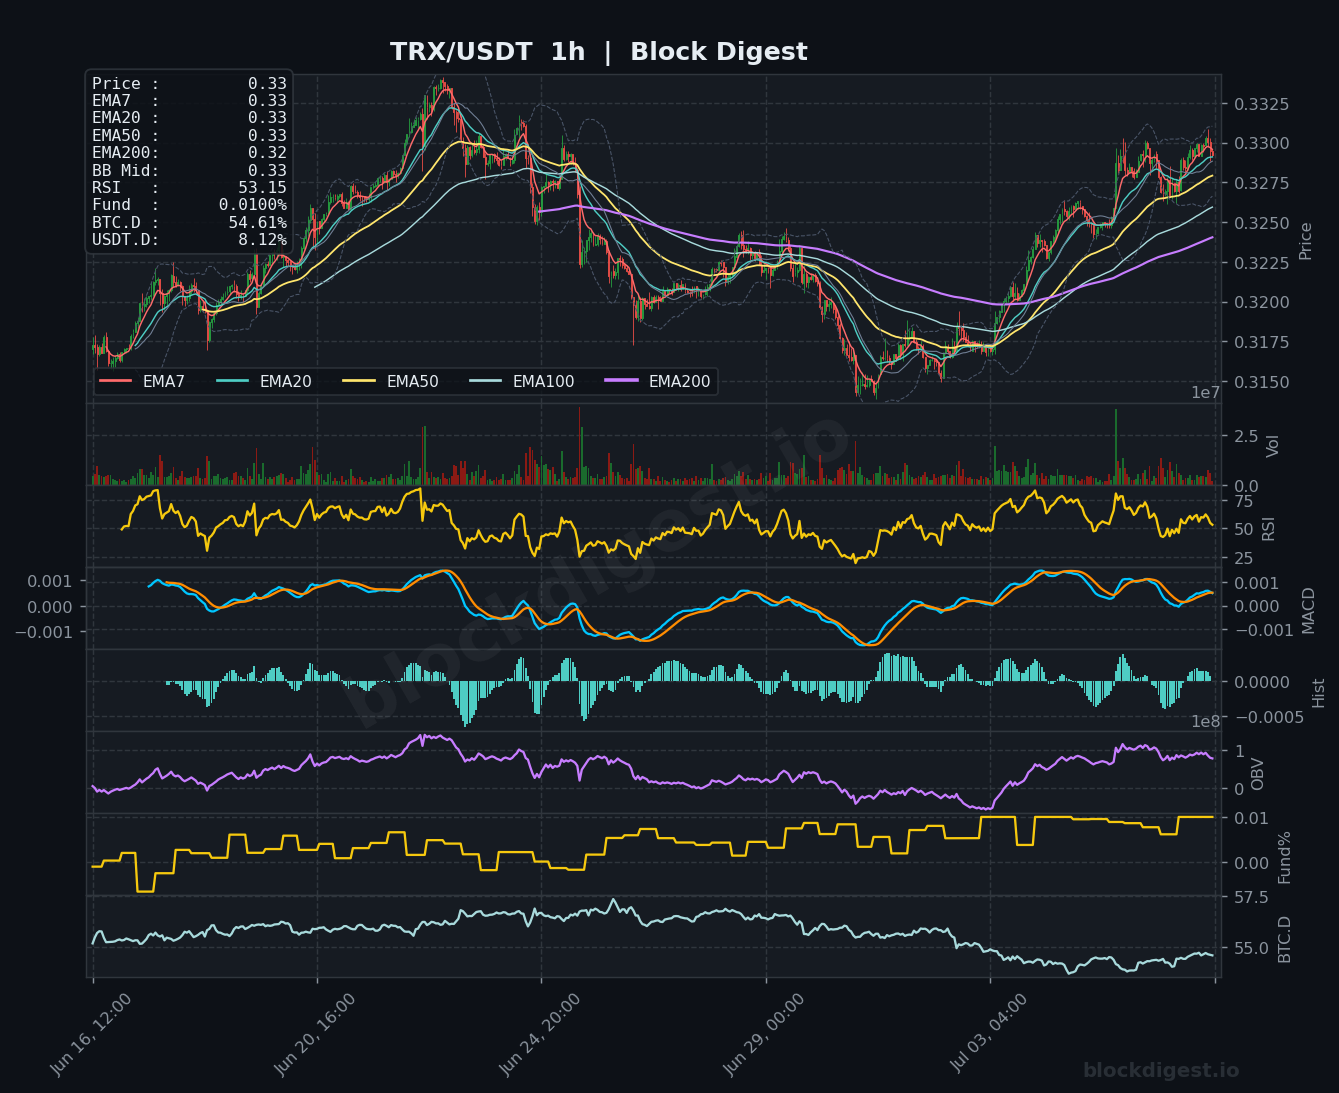
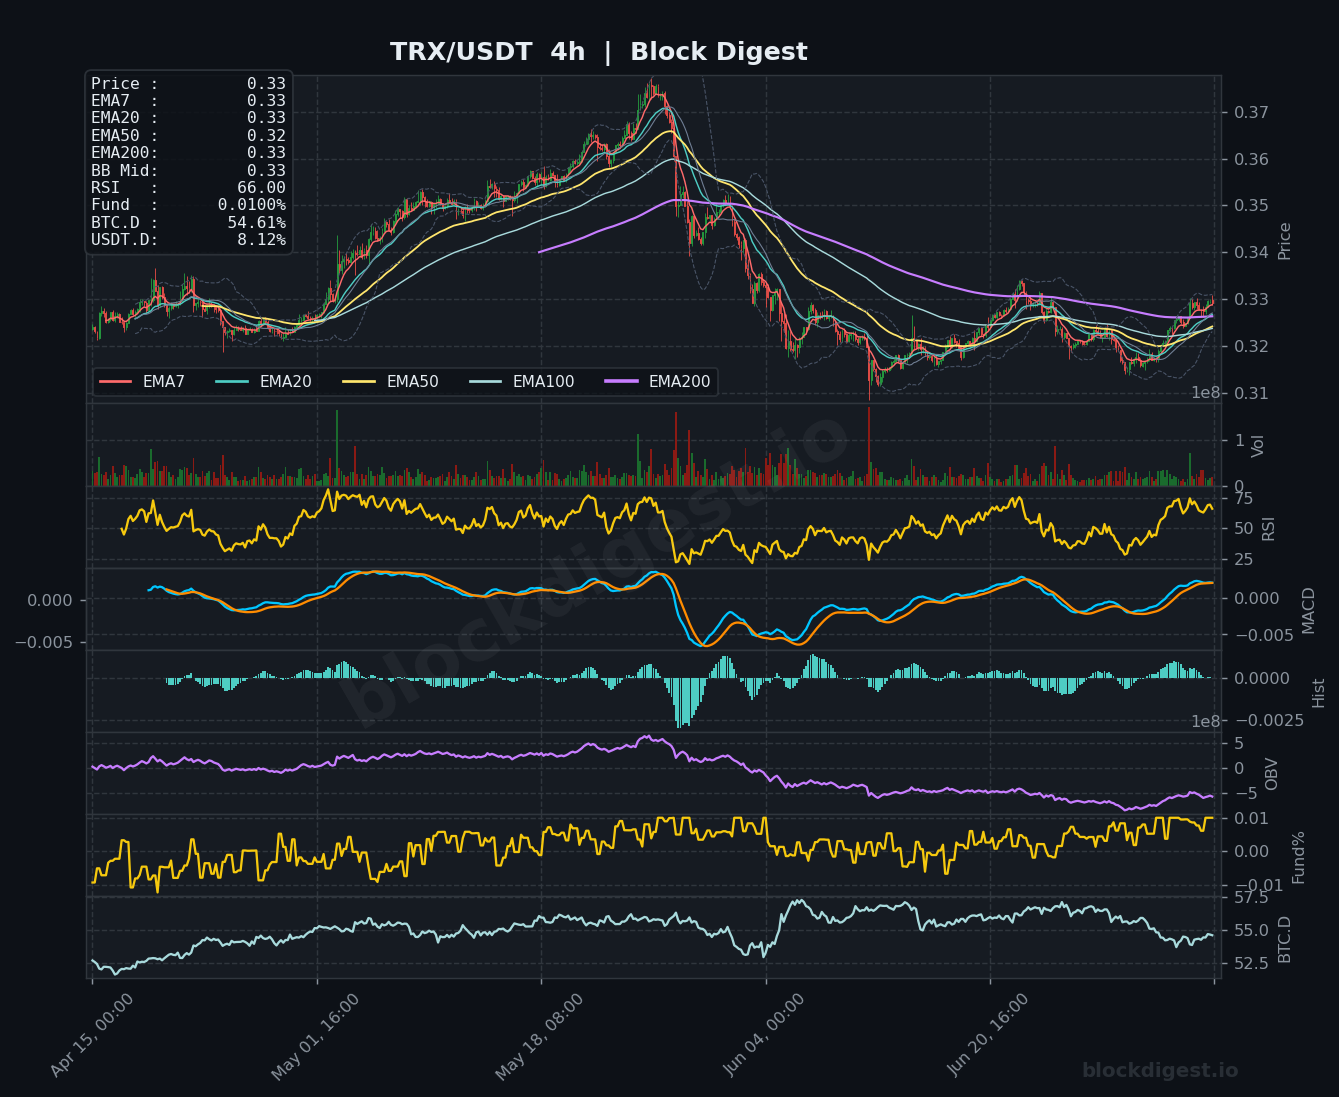
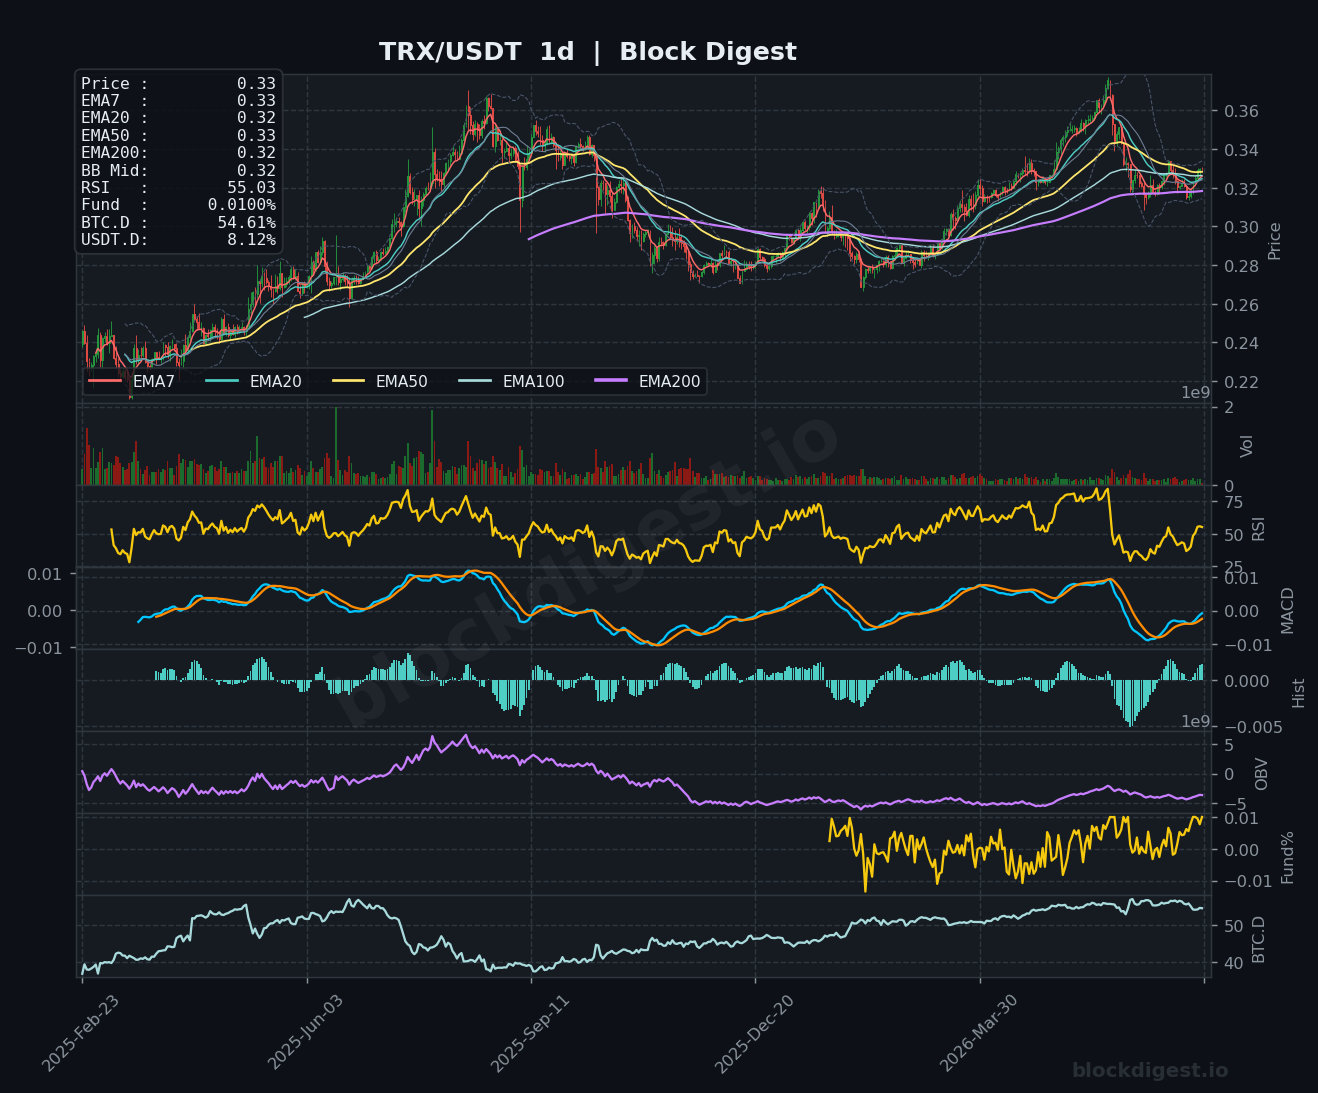
TRX is among the more technically constructive setups in today’s review, trading at $0.33 with price reclaiming its key short-term EMAs following a dip to around $0.315 in recent sessions. The 1h chart is particularly encouraging: RSI at 53.15 is holding above the midline, the MACD has staged a bullish cross with the signal line turning positive, and OBV has been steadily rising — all suggesting accumulation is underway. The 4h chart shows a strong RSI reading of 66.00, which is approaching overbought territory and may invite a brief pause or shallow pullback, though the overall trend structure with the MACD turning positive from negative extremes supports the bullish thesis. On the daily timeframe, RSI holds at a healthy 55.03, price is trading above all major short-term EMAs (EMA7 $0.33, EMA20 $0.32, EMA50 $0.33, EMA200 $0.32), and the Bollinger Bands suggest room for continuation toward the recent highs near $0.36; key support to maintain is the $0.318–$0.320 zone.
Altcoin Outlook
The altcoin landscape on July 7, 2026 presents a bifurcated picture: select assets with strong fundamentals or ecosystem-specific catalysts (BNB, TRX) are carving out near-term upside, while higher-beta, narrative-driven coins (DOGE) and longer-term downtrend victims (LTC, XRP) remain structurally weak. TRX and BNB stand out as the strongest technical setups, each showing improving momentum indicators and price action above key short-term EMAs, while DOGE carries the weakest setup with RSI readings near oversold across multiple timeframes and no credible support structure in sight. SOL occupies a middle ground — its daily RSI recovery to 63 is
Disclaimer: This analysis is for informational purposes only and does not constitute financial advice. Cryptocurrency markets are highly volatile and unpredictable. All trading decisions should be made based on your own research and risk tolerance. Block Digest is not responsible for any financial losses incurred as a result of acting on this content.
Stay Ahead of the Market
Follow BlockDigest for crypto market intelligence, research and real-time updates.


