
Market Context
The altcoin market is navigating a cautious recovery phase as BTC dominance sits at 54.46–54.48%, reflecting a still-elevated Bitcoin preference that continues to cap broad altcoin upside. USDT.D at 8.14% suggests meaningful sidelined capital remains on the bench, though the metric has been drifting lower — a tentative signal that risk appetite is slowly improving. The five-day Bitcoin ETF inflow streak and a dovish pivot from the Fed provide a constructive macro backdrop, but most altcoins are still trading well below their prior cycle highs, and any sustained altcoin rotation remains conditional on BTC holding its own recovery above $61,000.
Solana (SOL)
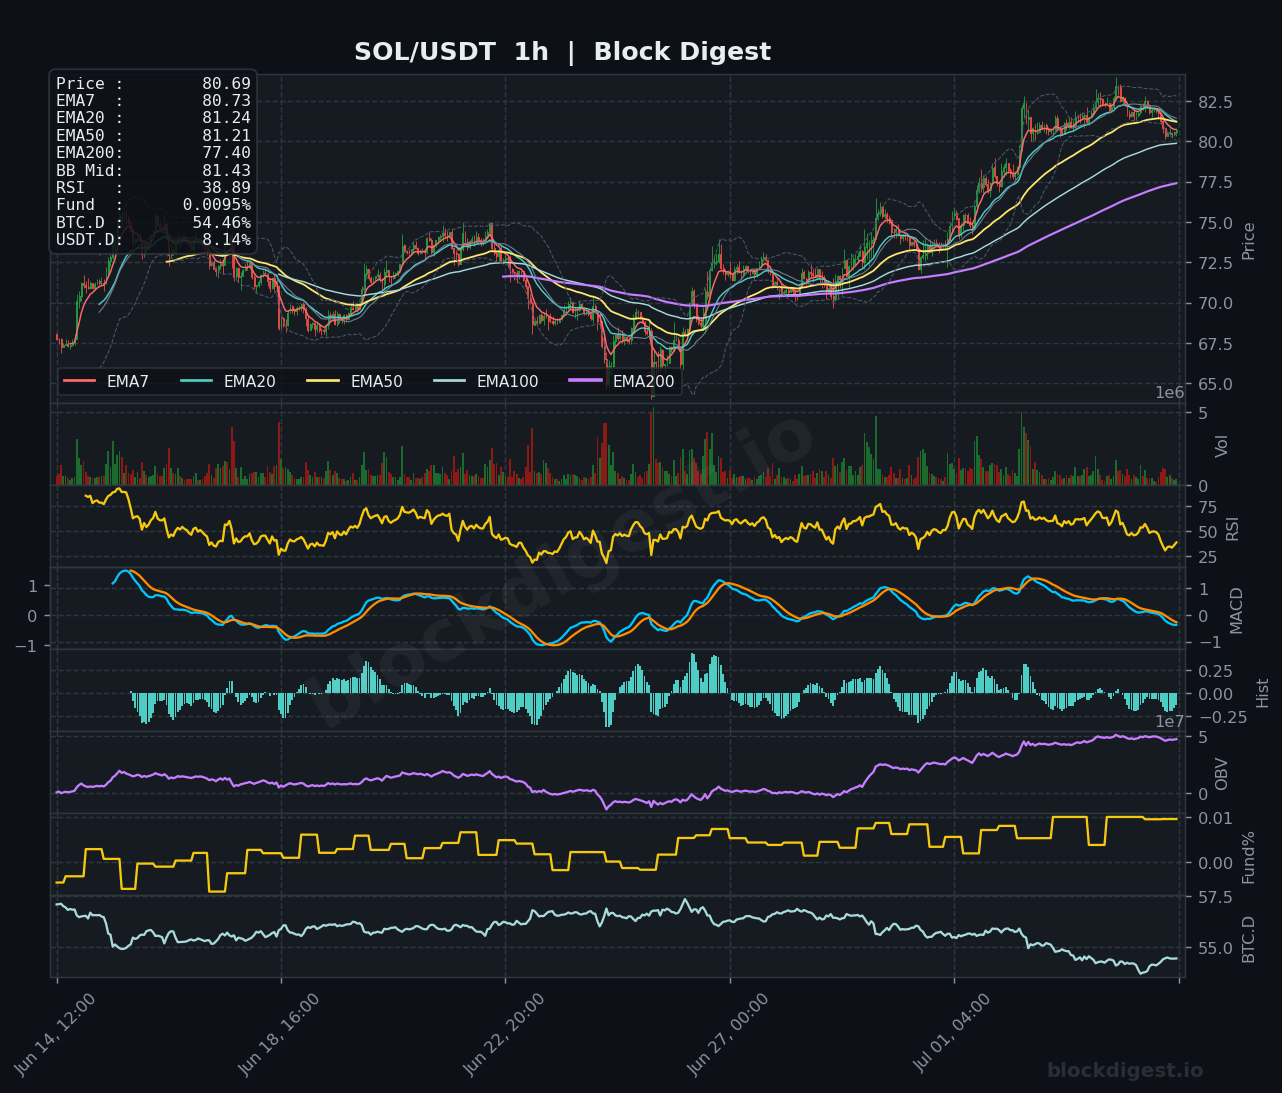
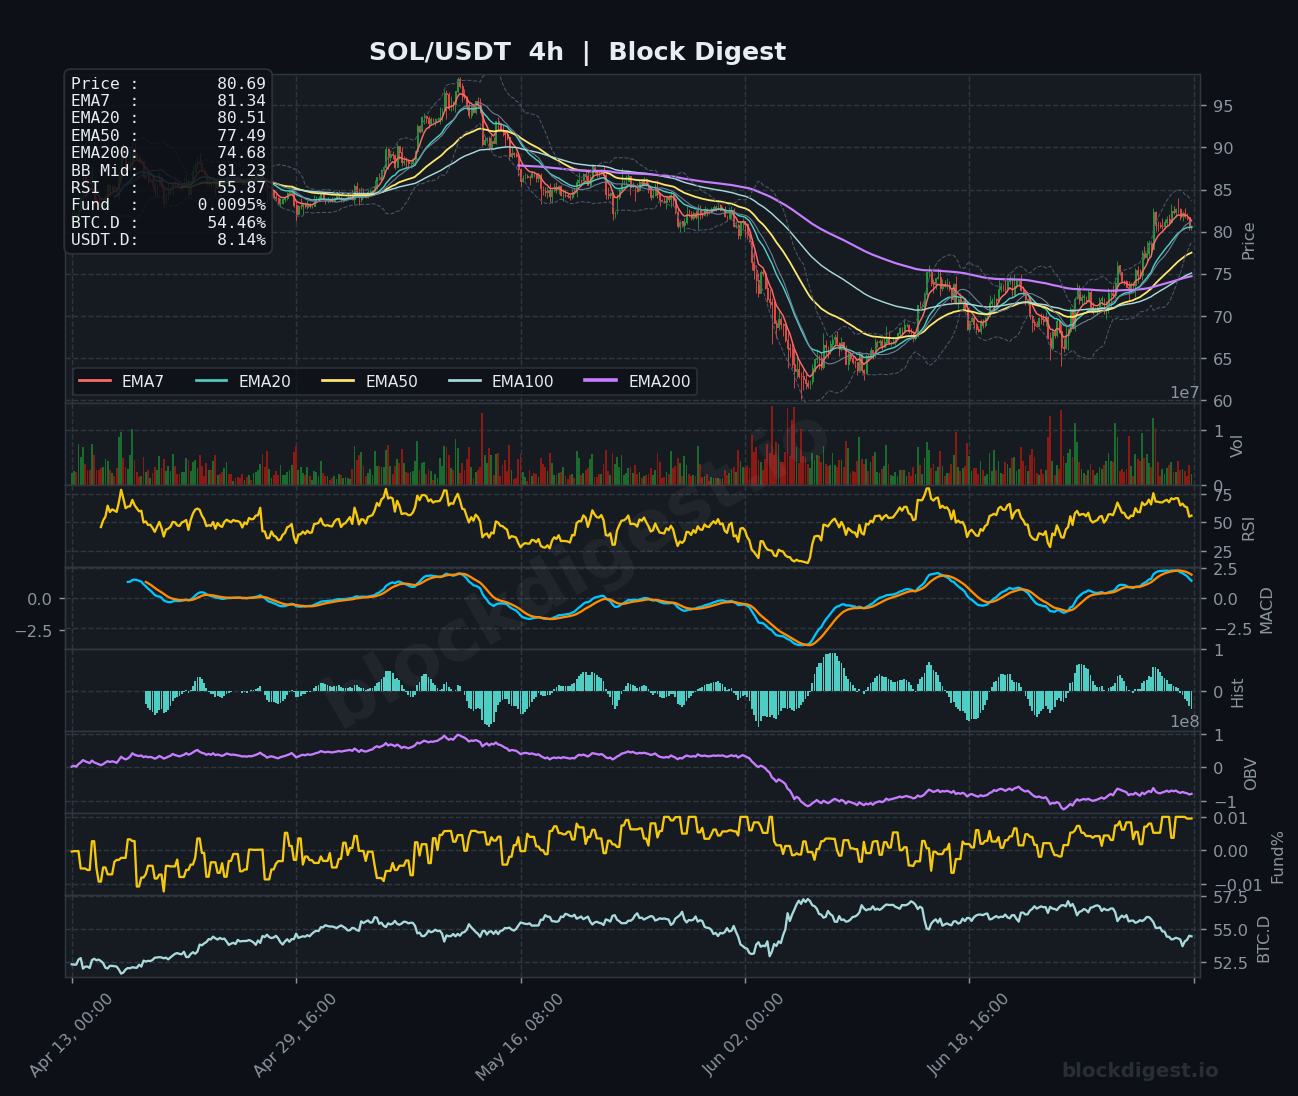
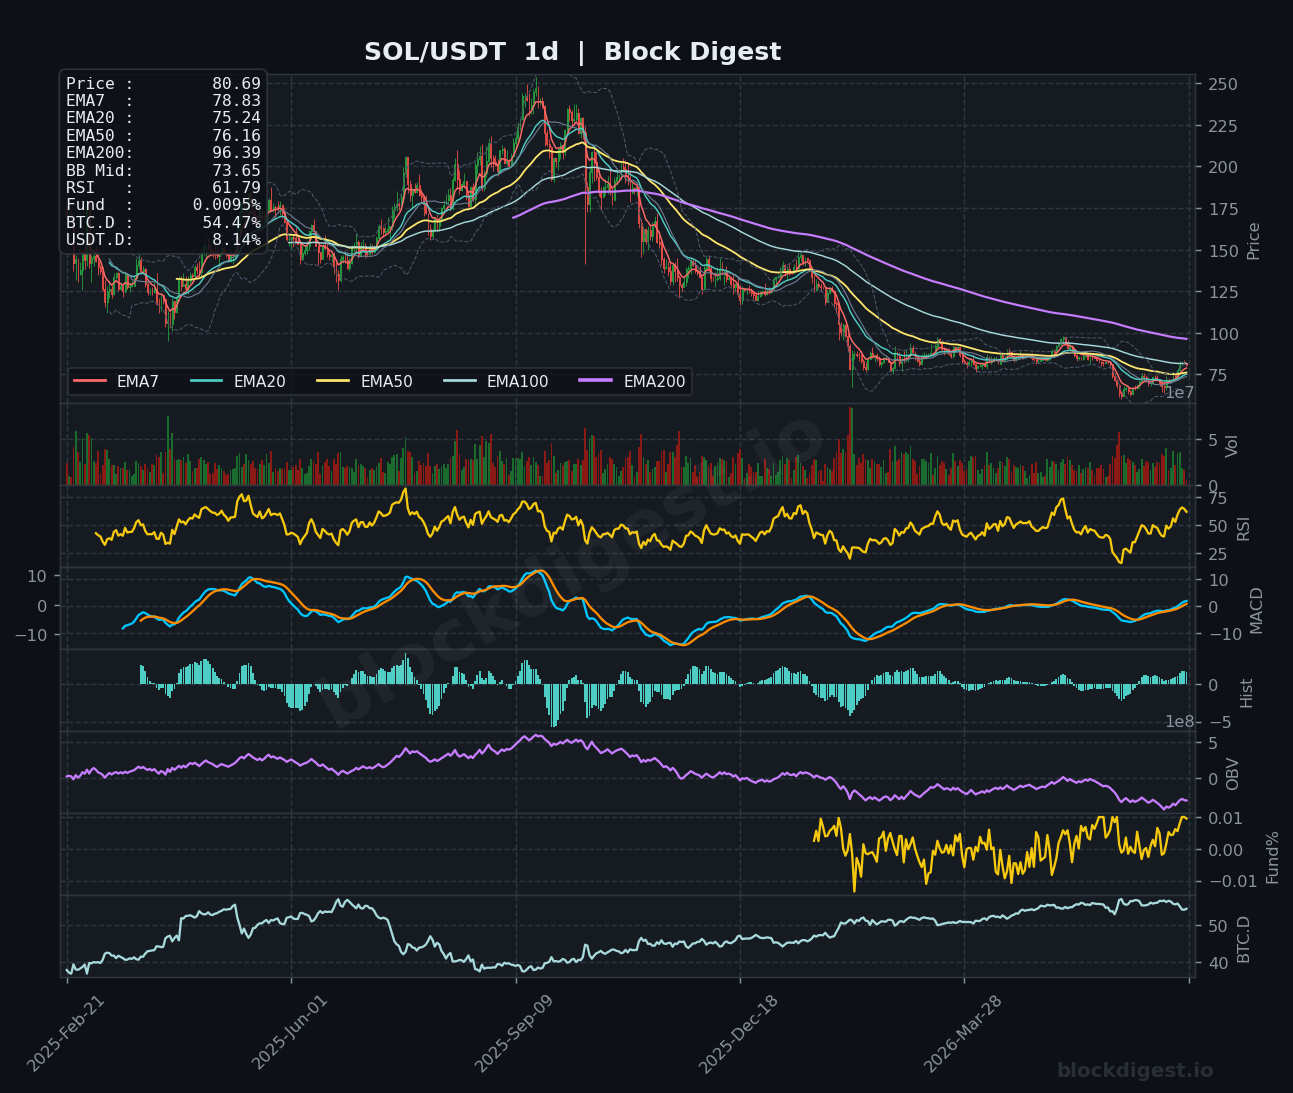
SOL is trading at $80.69, having bounced sharply off the late-June lows near $67–$68 but now running into resistance from the EMA cluster stacked between $80.51 and $81.43 on the 1h chart. The 1h RSI at 38.89 is concerning for near-term bulls — despite the price recovery, momentum has rolled over, and price is now below both the EMA7 ($80.73) and the Bollinger Band midline ($81.43), signaling a loss of short-term conviction. On the 4h timeframe, RSI holds more constructively at 55.87 and MACD is crossing into positive territory, suggesting the intermediate trend is still pointed upward. However, the daily chart tells a sobering longer-term story: SOL remains firmly below its EMA200 ($96.39) and EMA50 ($76.16) is only just beginning to flatten — the bias is cautiously bullish in the short-to-medium term, but traders should watch the $81.50 resistance and the $77–$78 support closely, with the pending Alpenglow consensus upgrade offering a potential fundamental catalyst.
XRP (XRP)
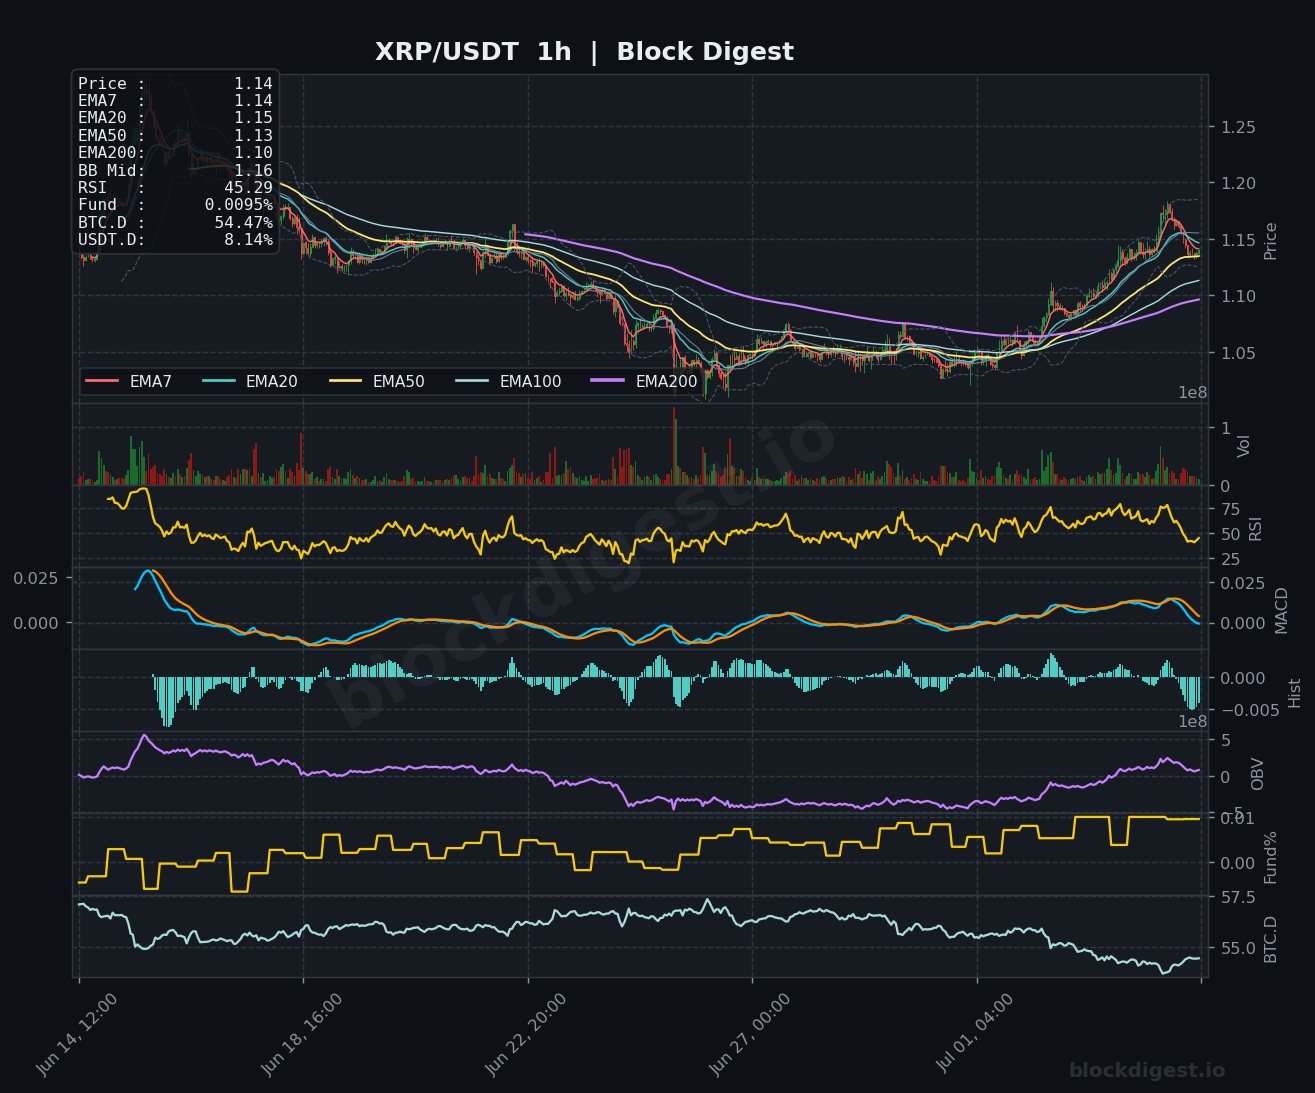
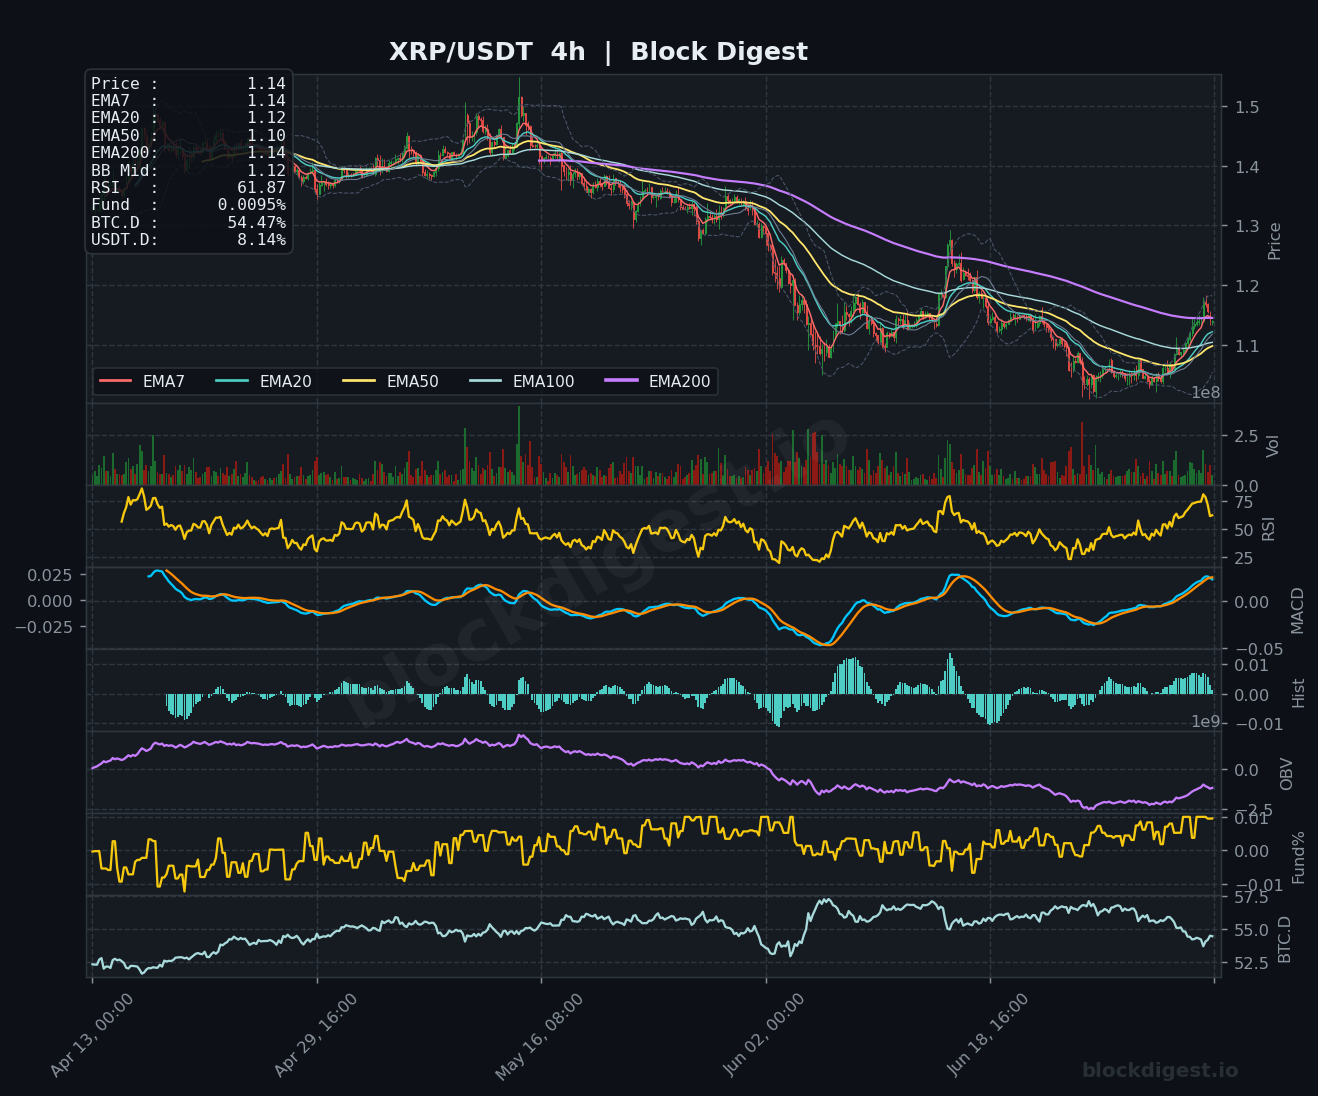
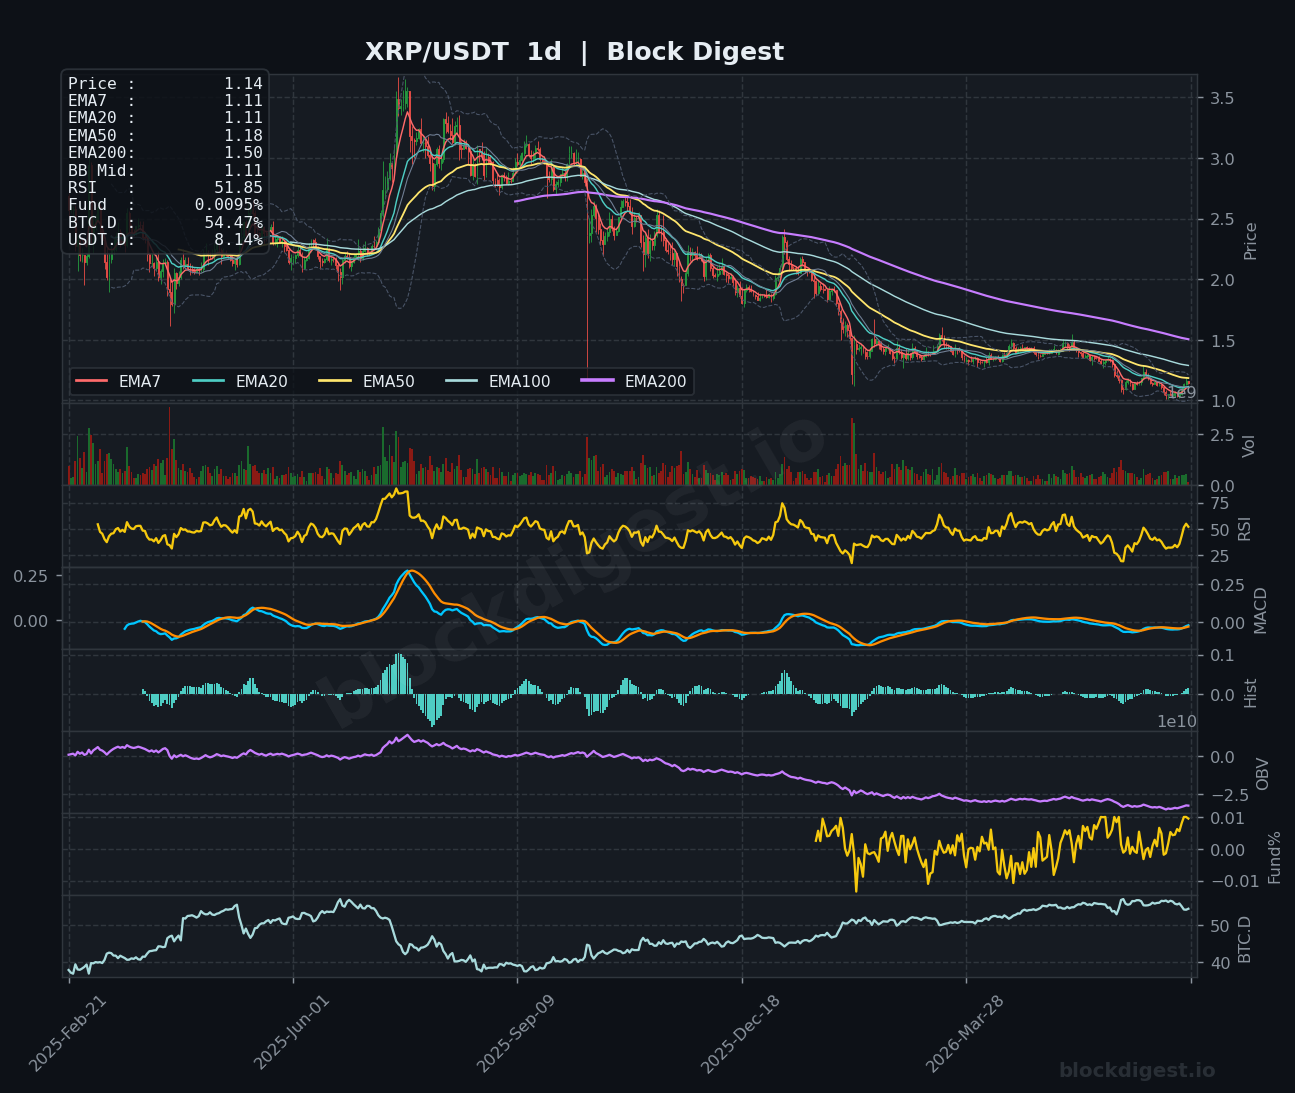
XRP is trading at $1.14, having staged a strong recovery from lows near $1.03–$1.05 seen in late June. On the 1h chart, price has broken above the EMA50 ($1.13) and EMA200 ($1.10) but is now pulling back just below the EMA20 ($1.15) and Bollinger Band midline ($1.16), with RSI cooling to 45.29 after its recent spike — suggesting the immediate rally may need to consolidate. The 4h chart is more encouraging, with RSI at 61.87 and MACD lines in a bullish crossover configuration and both trending higher, confirming the intermediate recovery has real momentum. On the daily chart, price has now cleared the EMA7 ($1.11) and EMA20 ($1.11) from below, with the daily RSI recovering toward 51.85 after a deep oversold read — a meaningful structural improvement. The CLARITY Act legislative backdrop adds a binary event risk: a passage or positive signal could propel XRP toward the $1.25–$1.30 resistance zone, while failure to progress could see price retest $1.05–$1.08 support.
BNB (BNB)
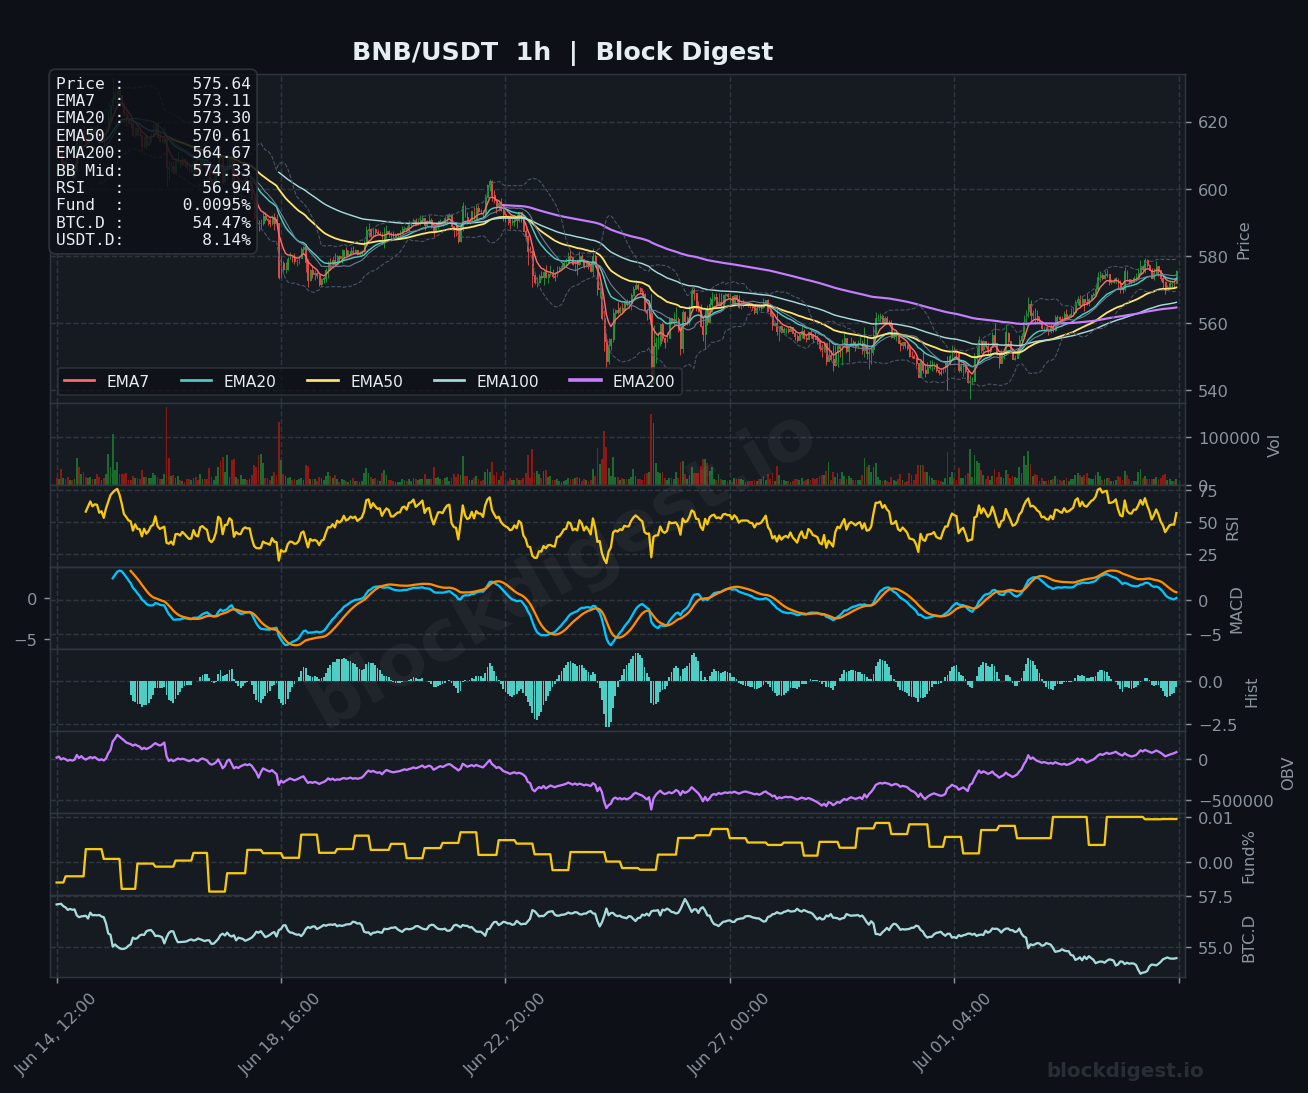
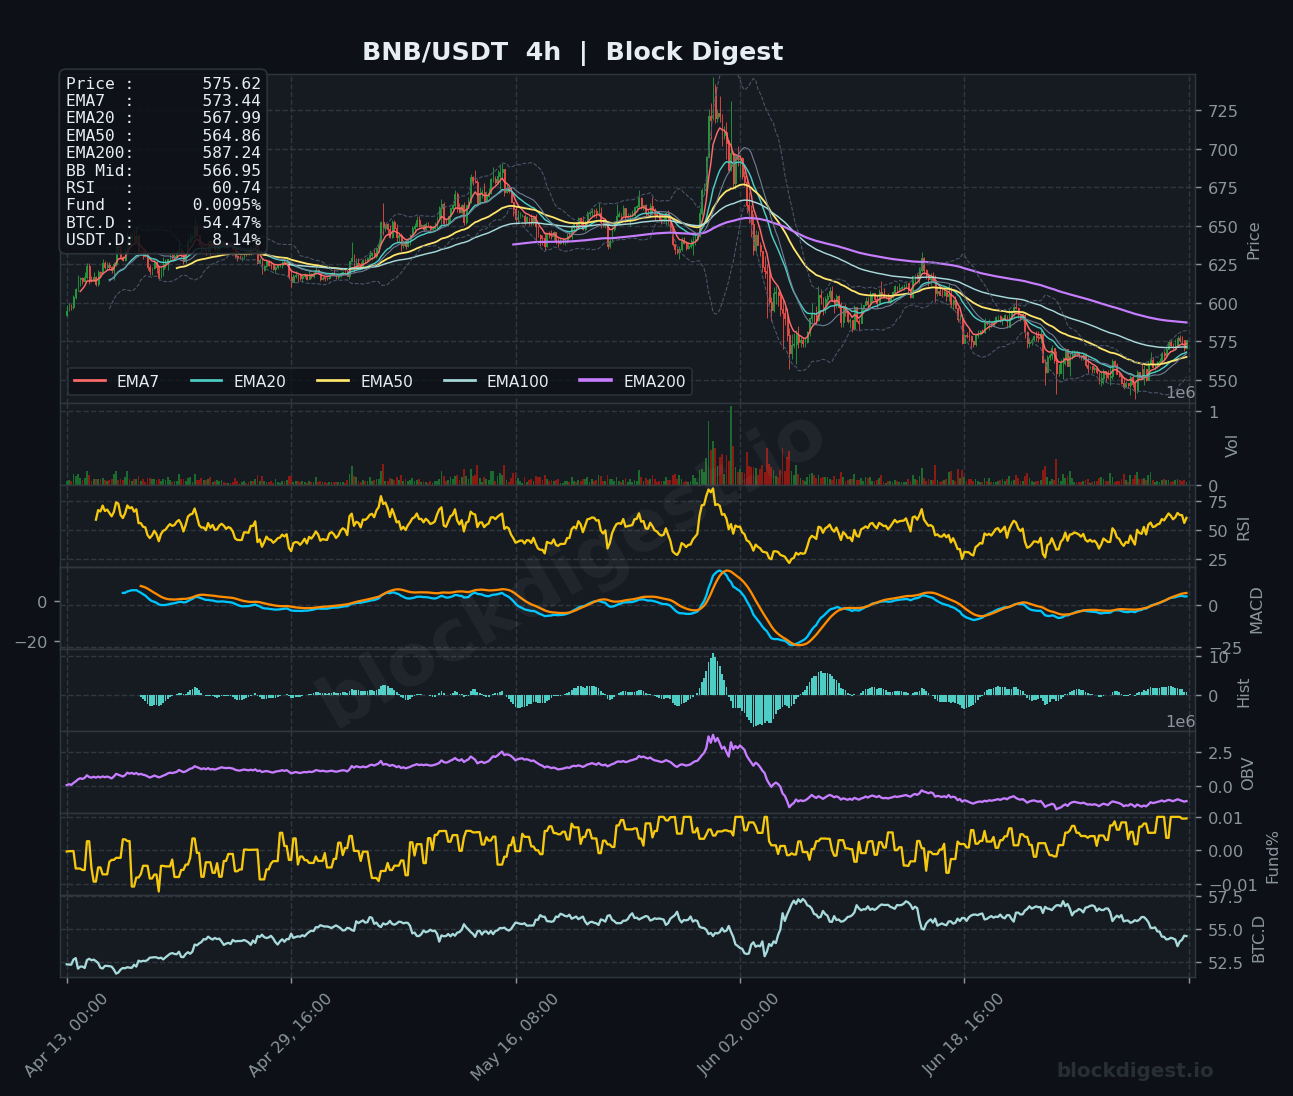
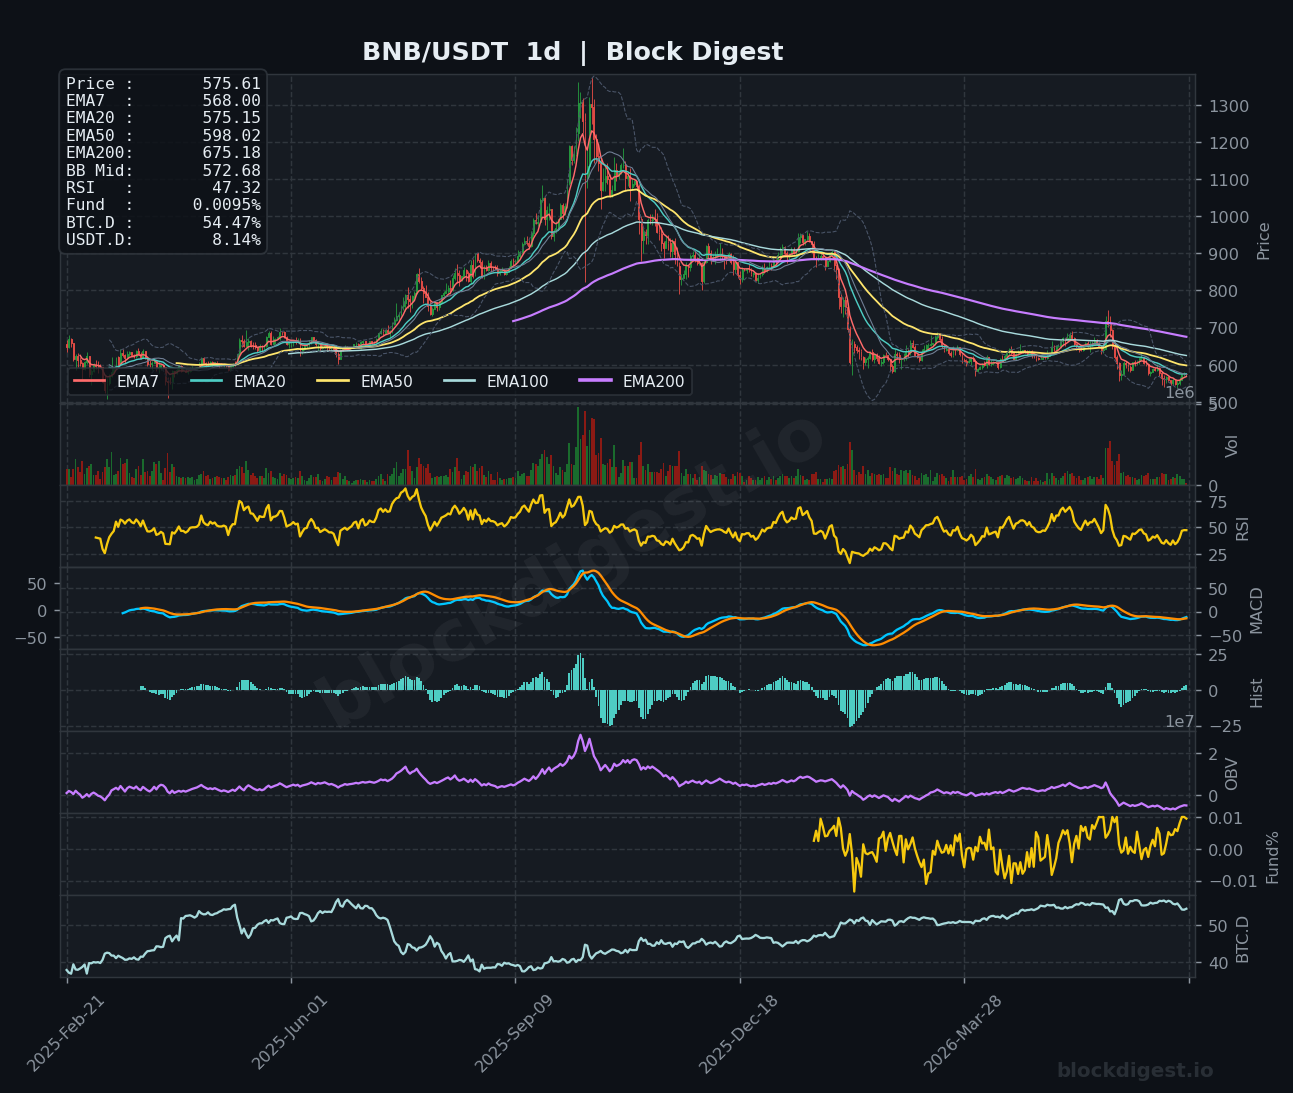
BNB is the relative standout for stability among this group, trading at $575.61–$575.64 with all short-term EMAs tightly clustered just beneath price — EMA7 ($573.11), EMA20 ($573.30), EMA50 ($570.61), and EMA200 ($564.67) are all in bullish alignment on the 1h chart, and the 1h RSI of 56.94 remains healthy with room to run. The 4h chart shows RSI at 60.74 with MACD in a positive crossover, and the OBV has been steadily recovering since the mid-June trough — net buy pressure is returning. The key resistance overhead is the $580–$585 zone, and a clean break there opens the door toward $600; immediate support is the $560–$565 band where the EMA50 and EMA200 converge on the 1h. The daily chart remains structurally bearish given that price is far beneath the EMA200 ($675.18), but BNB’s relative resilience and tightly bunched short-term EMA stack give it the most constructive near-term setup in this cohort.
Dogecoin (DOGE)
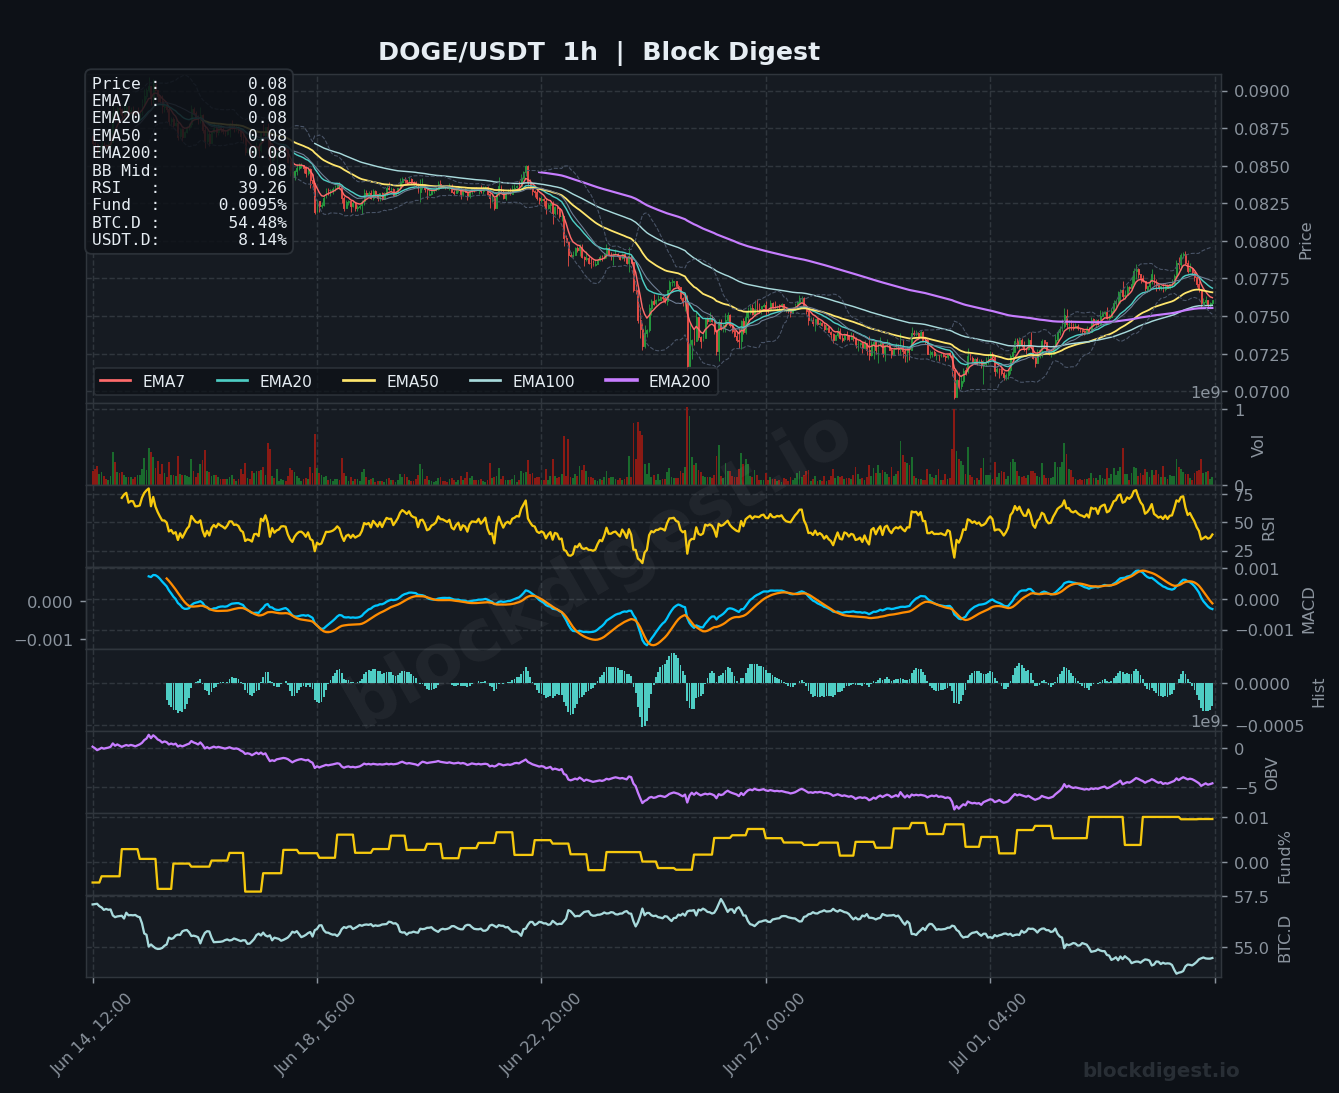
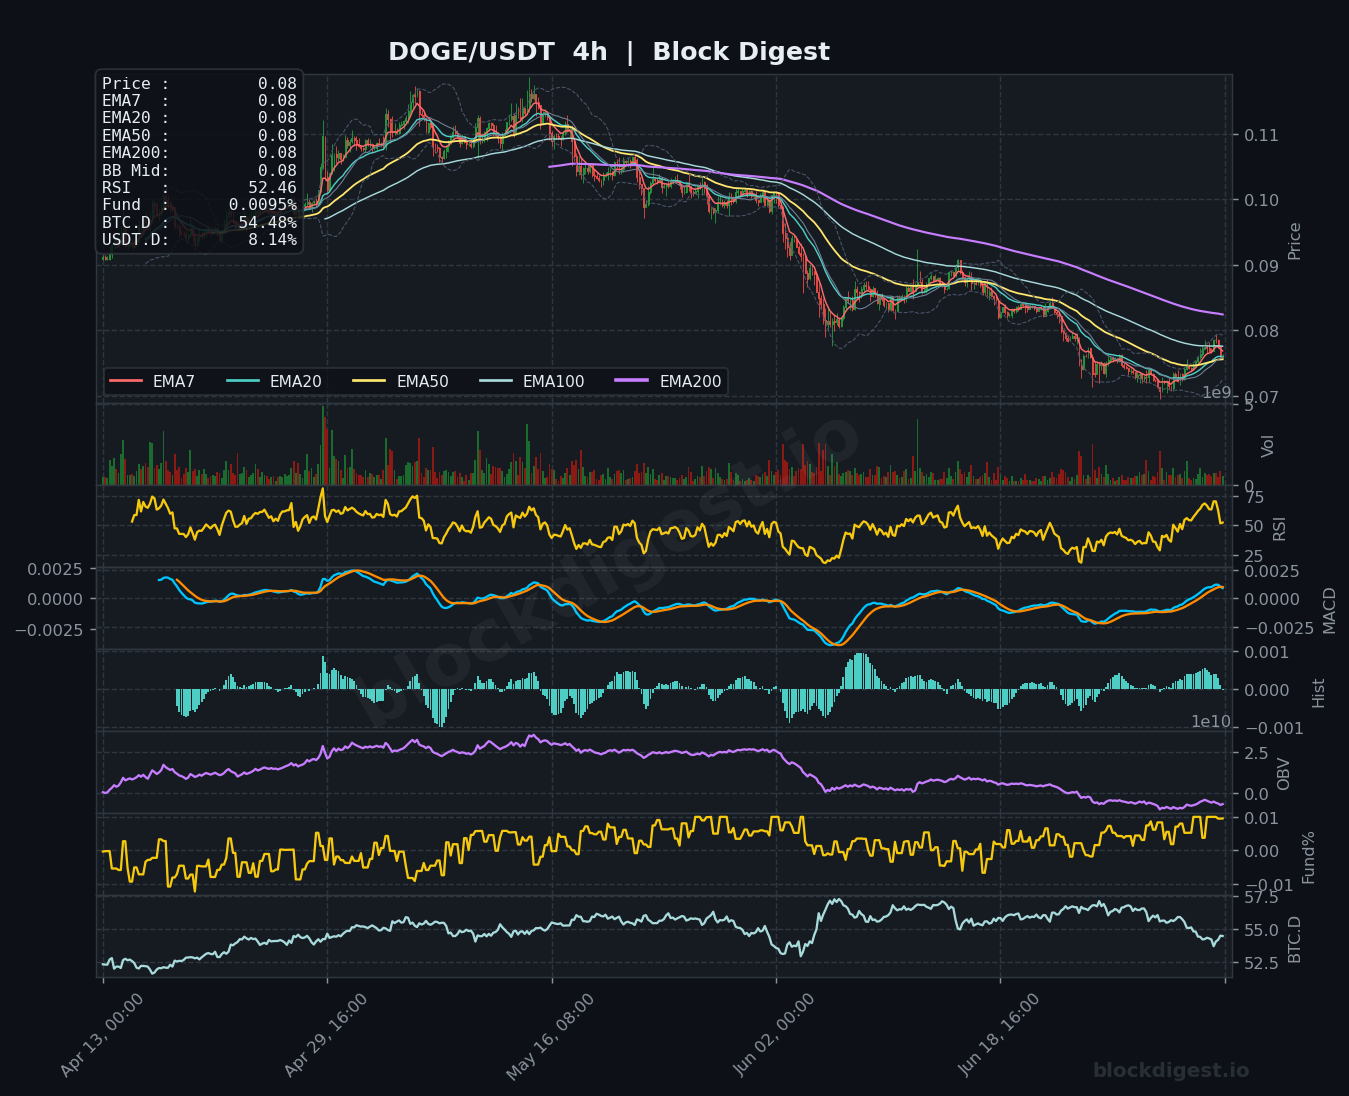
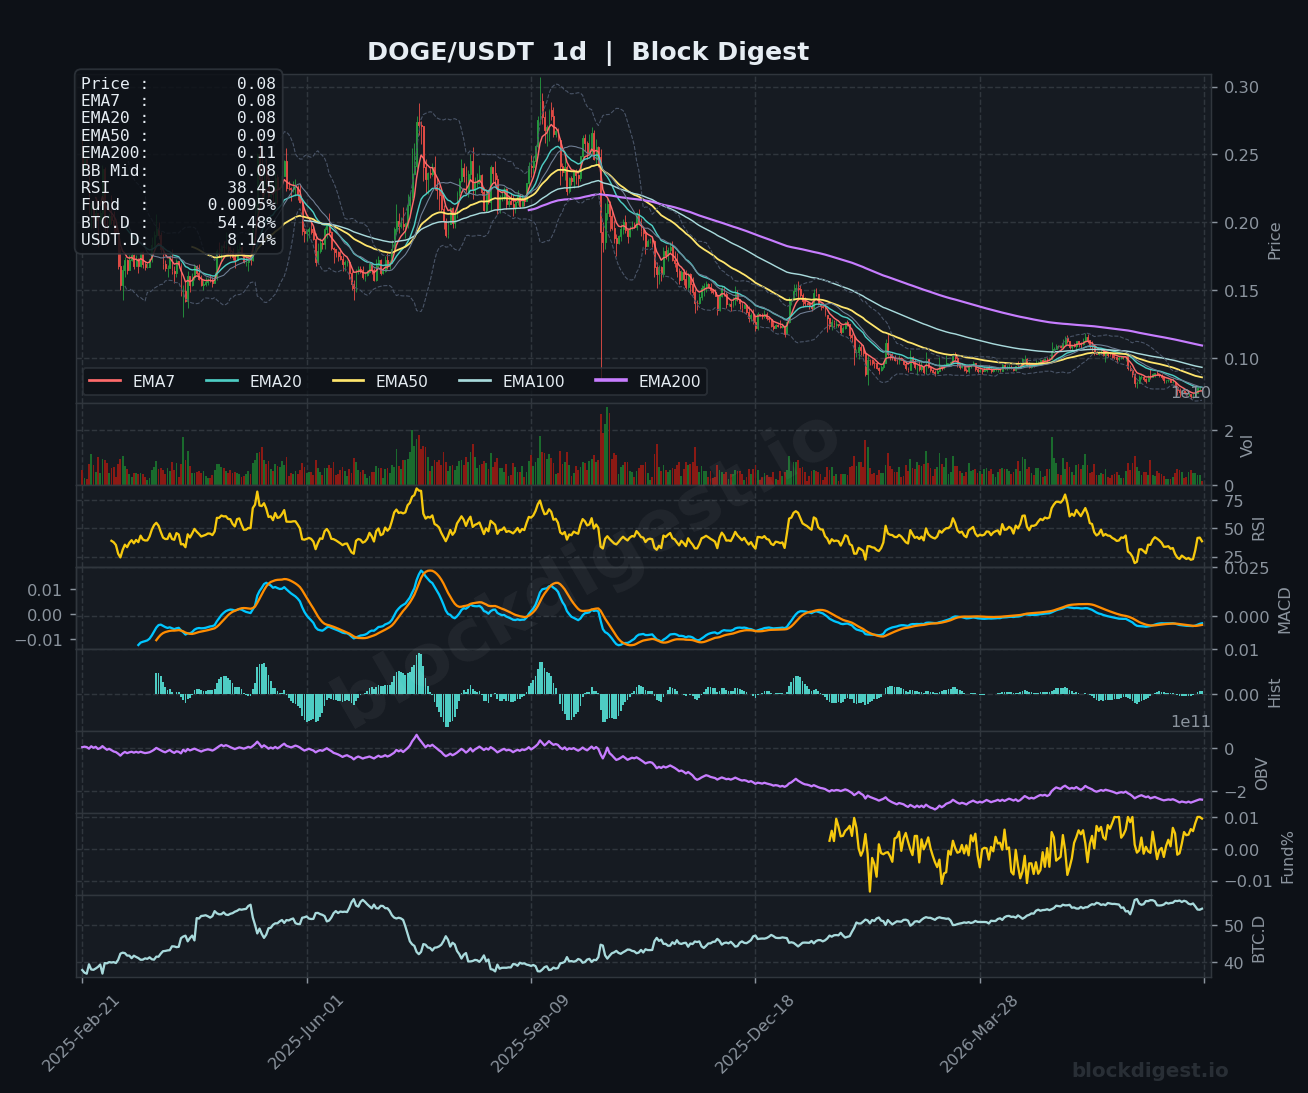
DOGE is trading at $0.077–$0.080, showing early signs of a base forming after the protracted decline from the $0.085–$0.090 range seen in mid-June. The 1h RSI at 39.26 is dangerously close to oversold territory, and all EMAs are compressed tightly around the $0.08 level, indicating price is coiling at a potential inflection point. On the 4h chart, RSI has recovered to 52.46 from heavily oversold conditions, and the MACD histogram is printing modest positive bars — a tentative shift, but the OBV trend remains decisively negative, showing persistent distribution. The daily chart is unambiguously bearish: price is trading below the EMA50 ($0.09), EMA200 ($0.11), and daily RSI sits at a weak 38.45 with the MACD signal line still pointing lower. DOGE needs a sustained hold above $0.080 and a recapture of the $0.082–$0.085 range to suggest any meaningful recovery; downside risk to the $0.070–$0.072 area remains open if broader market conditions deteriorate.
Litecoin (LTC)
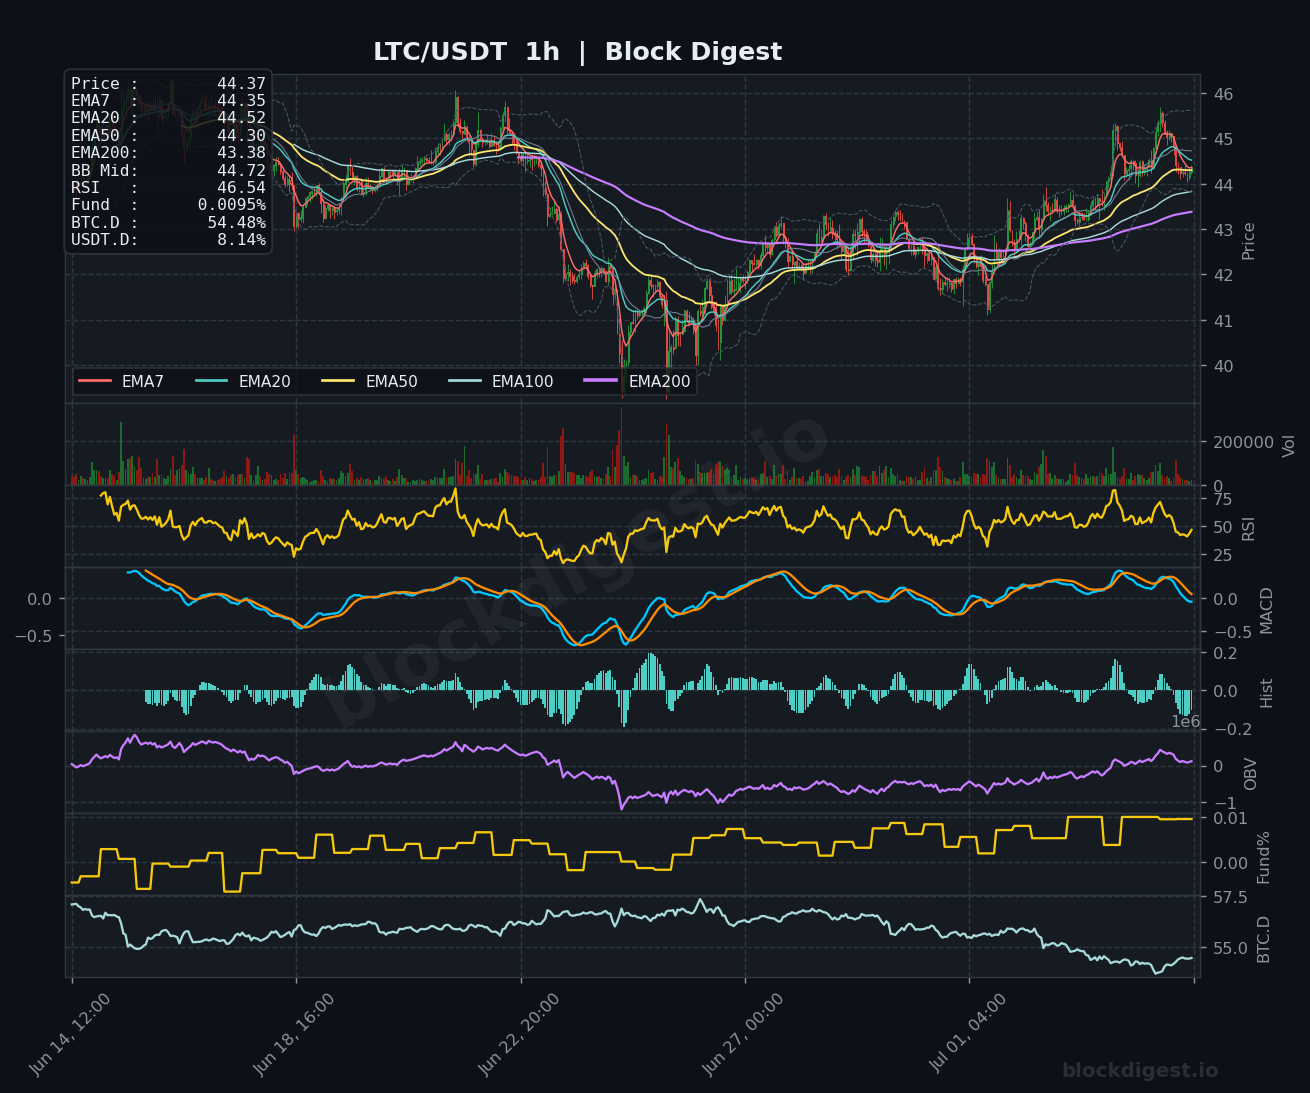
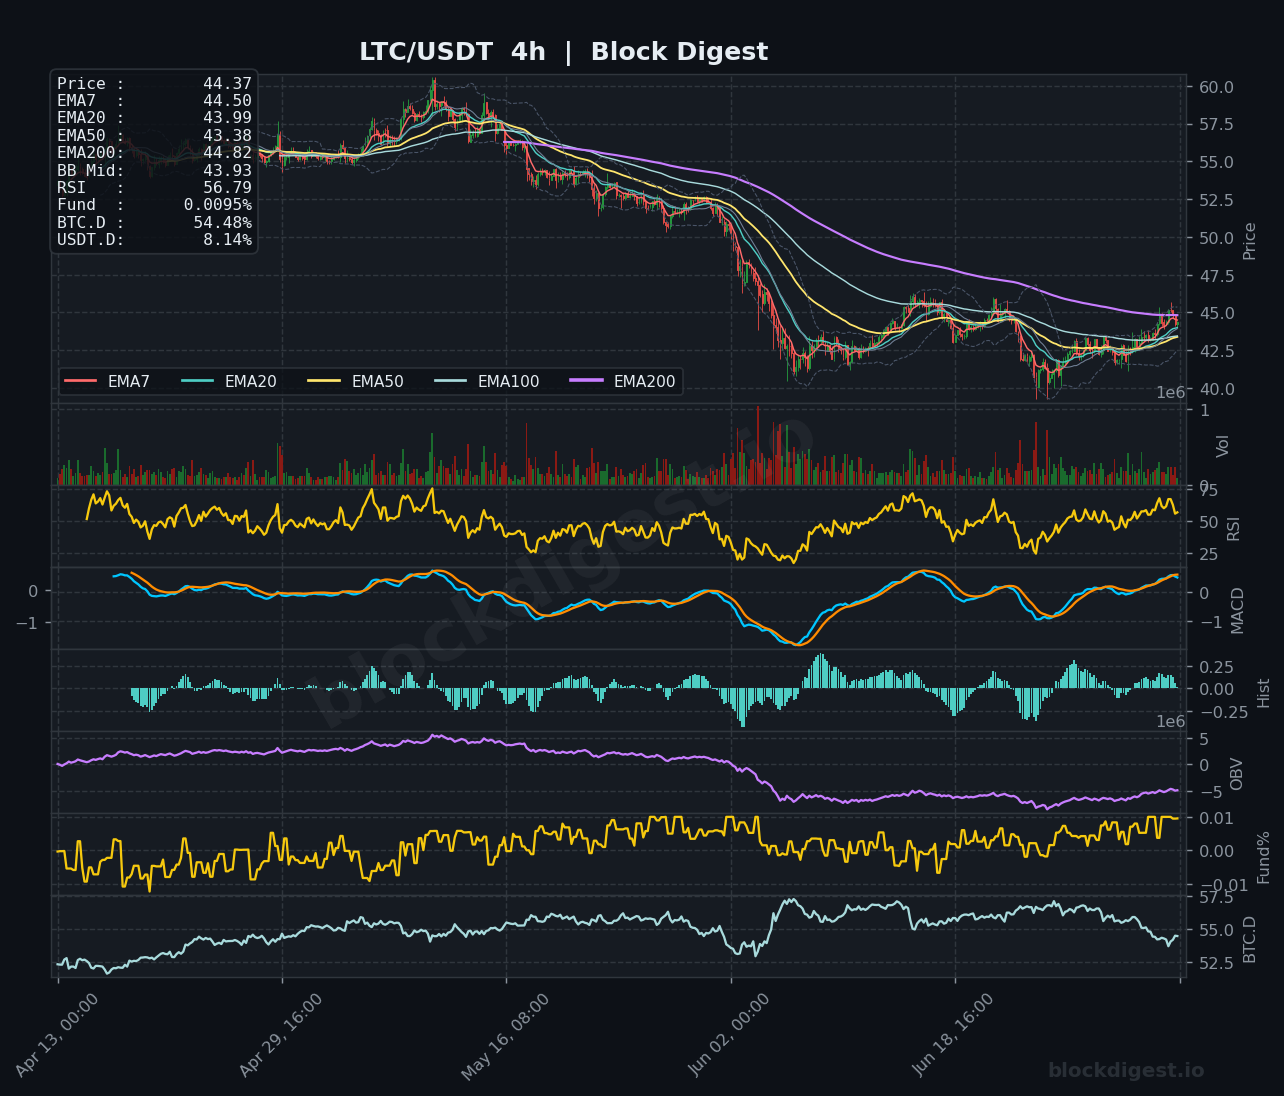
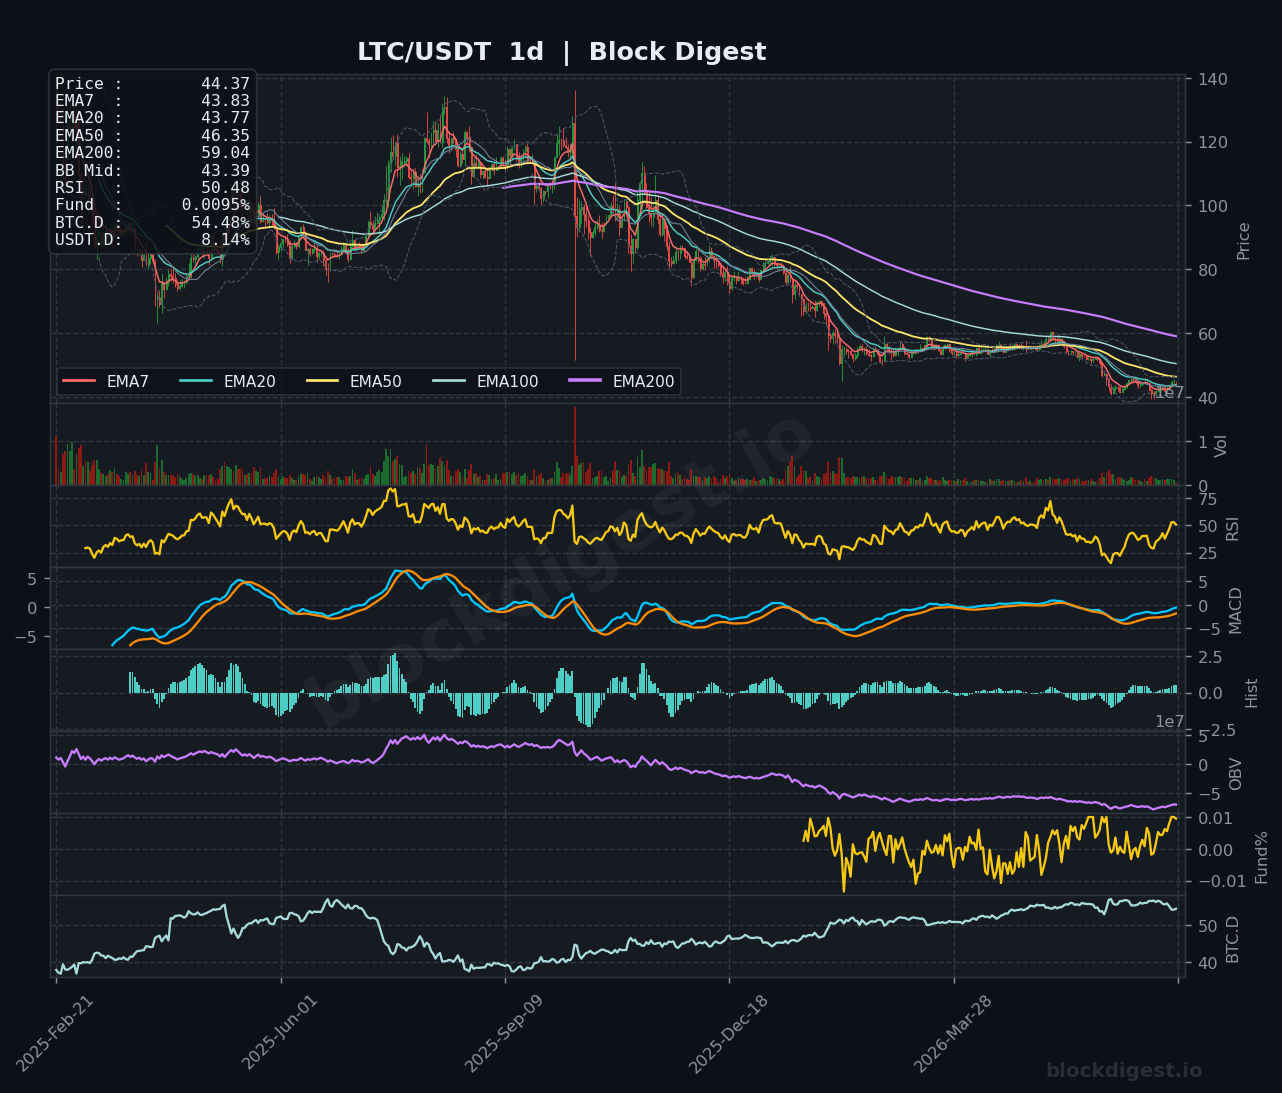
LTC is trading at $44.37, having recovered from the late-June lows around $40–$41 and is now testing the EMA20 ($44.52) as resistance on the 1h chart. The 1h RSI at 46.54 is neutral-to-soft, and while the MACD has been recovering from deeply negative territory, the histogram bars are beginning to shrink again — indicating the bounce may be losing steam near current levels. The 4h RSI at 56.79 and a MACD that has crossed back into positive territory are more encouraging, suggesting the intermediate structure is improving, and the OBV has started turning upward on the 4h after a lengthy decline. The daily chart remains structurally challenged: price is well below the EMA50 ($46.35) and the distant EMA200 ($59.04), with daily RSI at 50.48 sitting right on the fence. A confirmed daily close above $46 would be a meaningful bull signal; failure to hold $42–$43 would negate the recovery and likely test the recent cycle lows.
TRON (TRX)
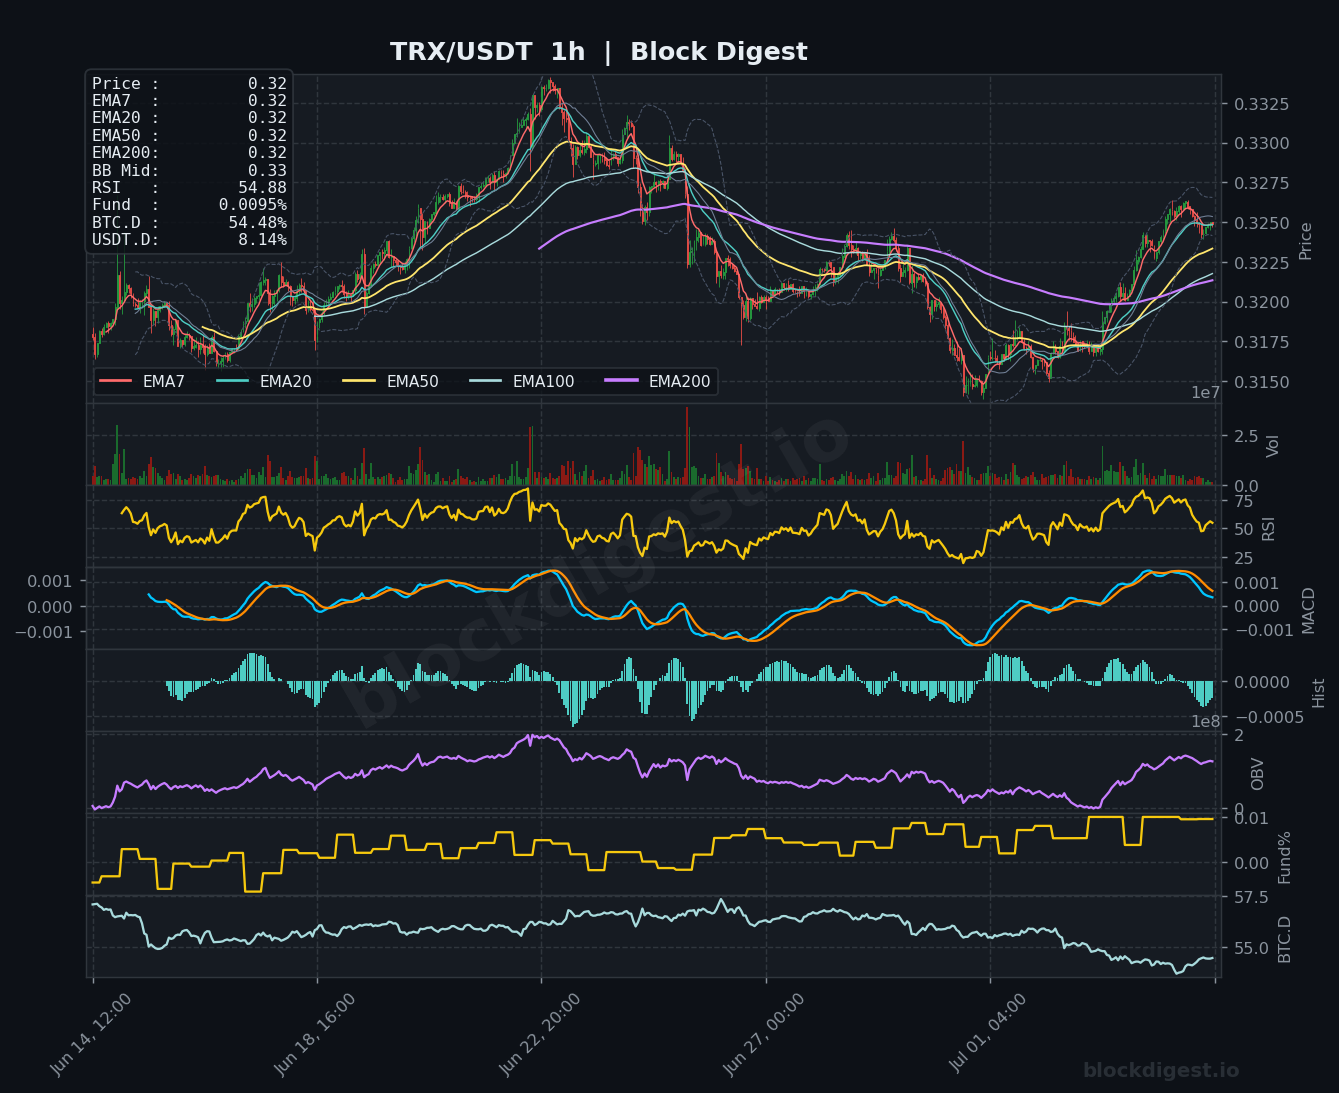
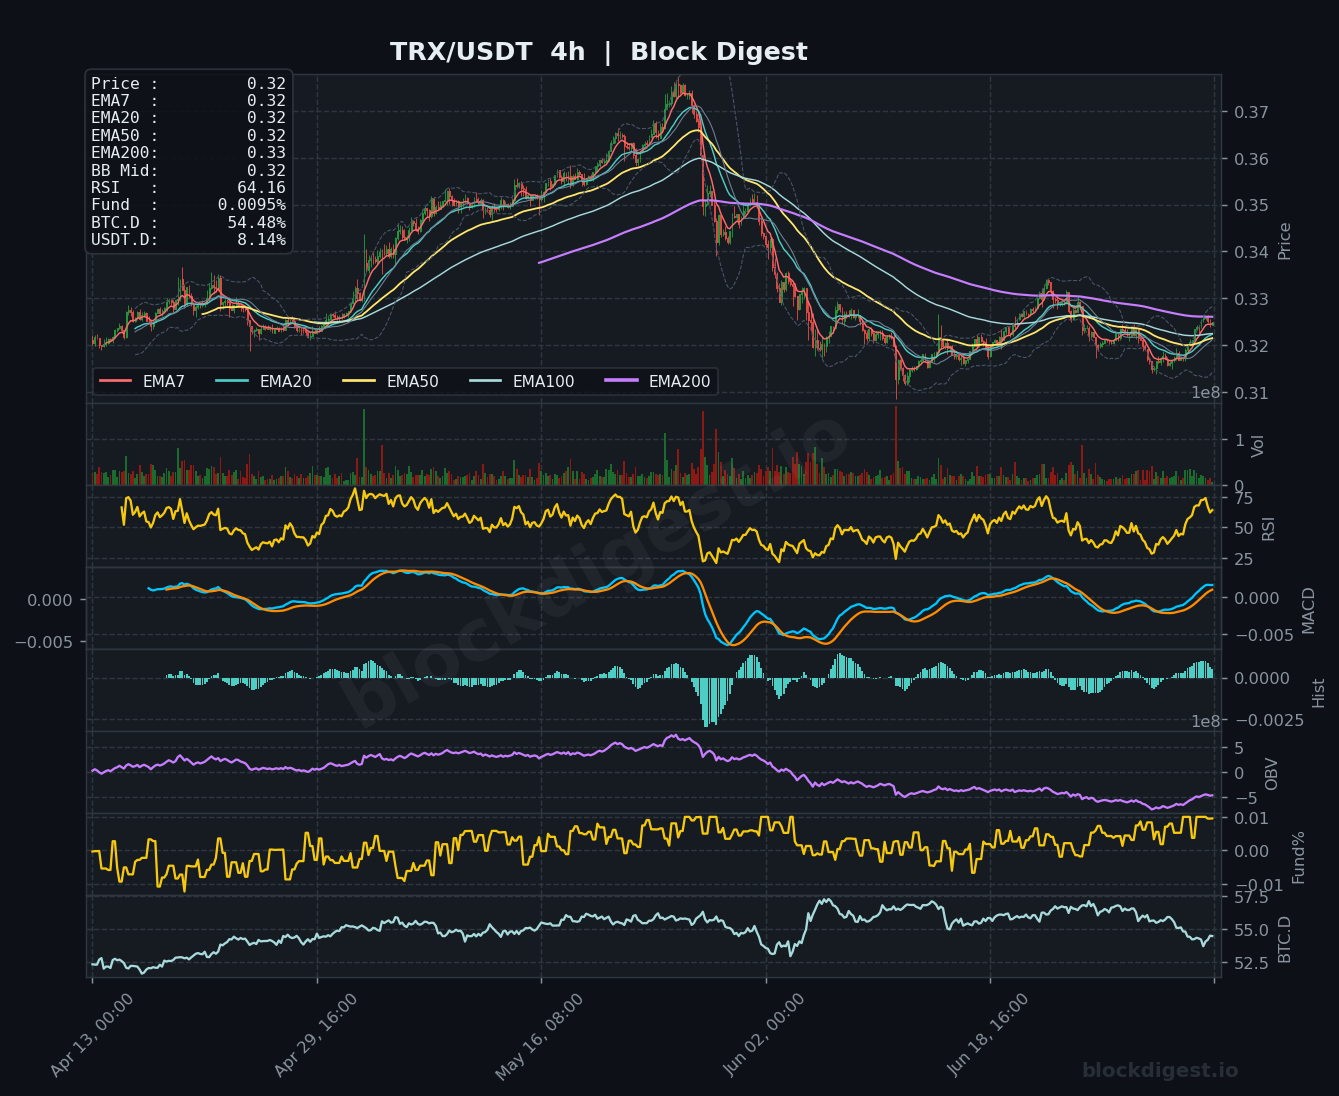
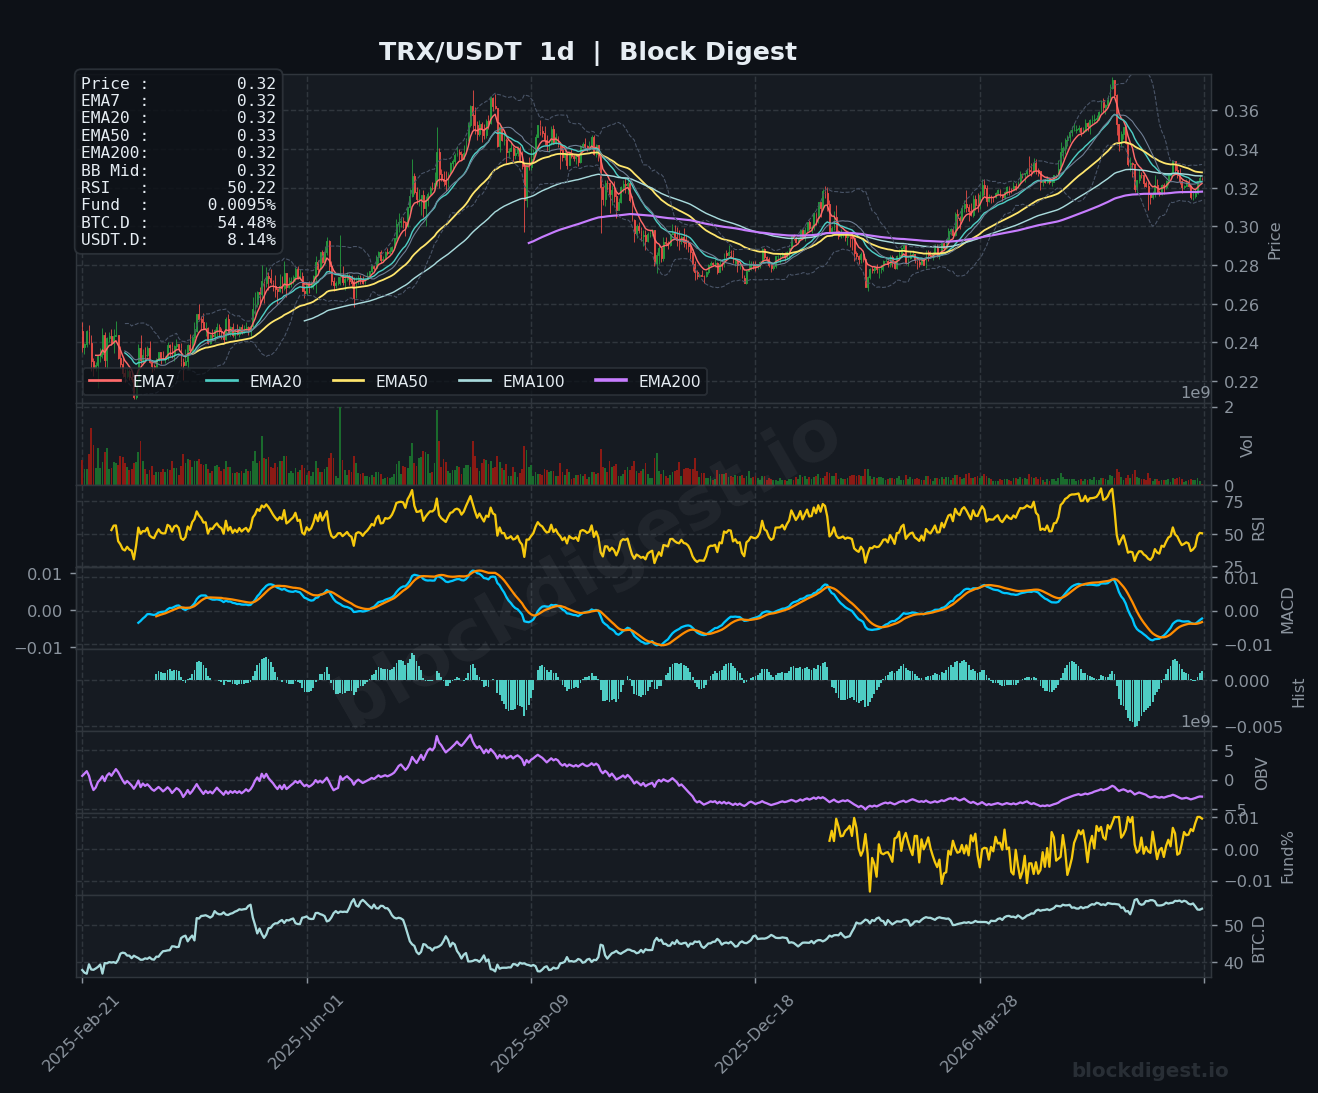
TRX is one of the most technically interesting setups in today’s review, trading at $0.32 with daily price action still above its EMA200 ($0.32) — a distinction no other coin in this group can claim. The 1h chart shows all five EMAs compressed at $0.32 with RSI at 54.88 and MACD crossing back into positive territory, suggesting a modest but real recovery is underway after the sharp mid-June pullback from the $0.33+ highs. On the 4h timeframe, RSI has climbed to 64.16 — approaching overbought conditions — and the MACD signal is tightening toward a bullish crossover from below zero, which would confirm medium-term trend resumption. The daily chart RSI is neutral at 50.22 with MACD histogram bars beginning to tick positive after a deep corrective phase; the EMA50 ($0.33) just overhead represents the key hurdle, and a close above it would set up a retest of the recent $0.35–$0.37 highs. Bias is cautiously bullish, with TRX demonstrating superior relative strength compared to most altcoins in this group.
Altcoin Outlook
The overall altcoin setup on July 5, 2026 is one of tentative recovery rather than confirmed breakout — most coins have bounced from June lows but face meaningful EMA resistance overhead, and the failure to recapture higher timeframe moving averages keeps the structural bias bearish-to-neutral for the majority of the group. TRX and BNB present the strongest near-term setups, with TRX holding above its daily EMA200 and BNB exhibiting the most orderly EMA alignment; XRP has the highest event-driven upside potential via crypto legislation but remains technically fragile beneath $1.16. SOL and DOGE carry the most downside risk given weakening fundamentals
Disclaimer: This analysis is for informational purposes only and does not constitute financial advice. Cryptocurrency markets are highly volatile and unpredictable. All trading decisions should be made based on your own research and risk tolerance. Block Digest is not responsible for any financial losses incurred as a result of acting on this content.
Stay Ahead of the Market
Follow BlockDigest for crypto market intelligence, research and real-time updates.


