Weekly Market Overview
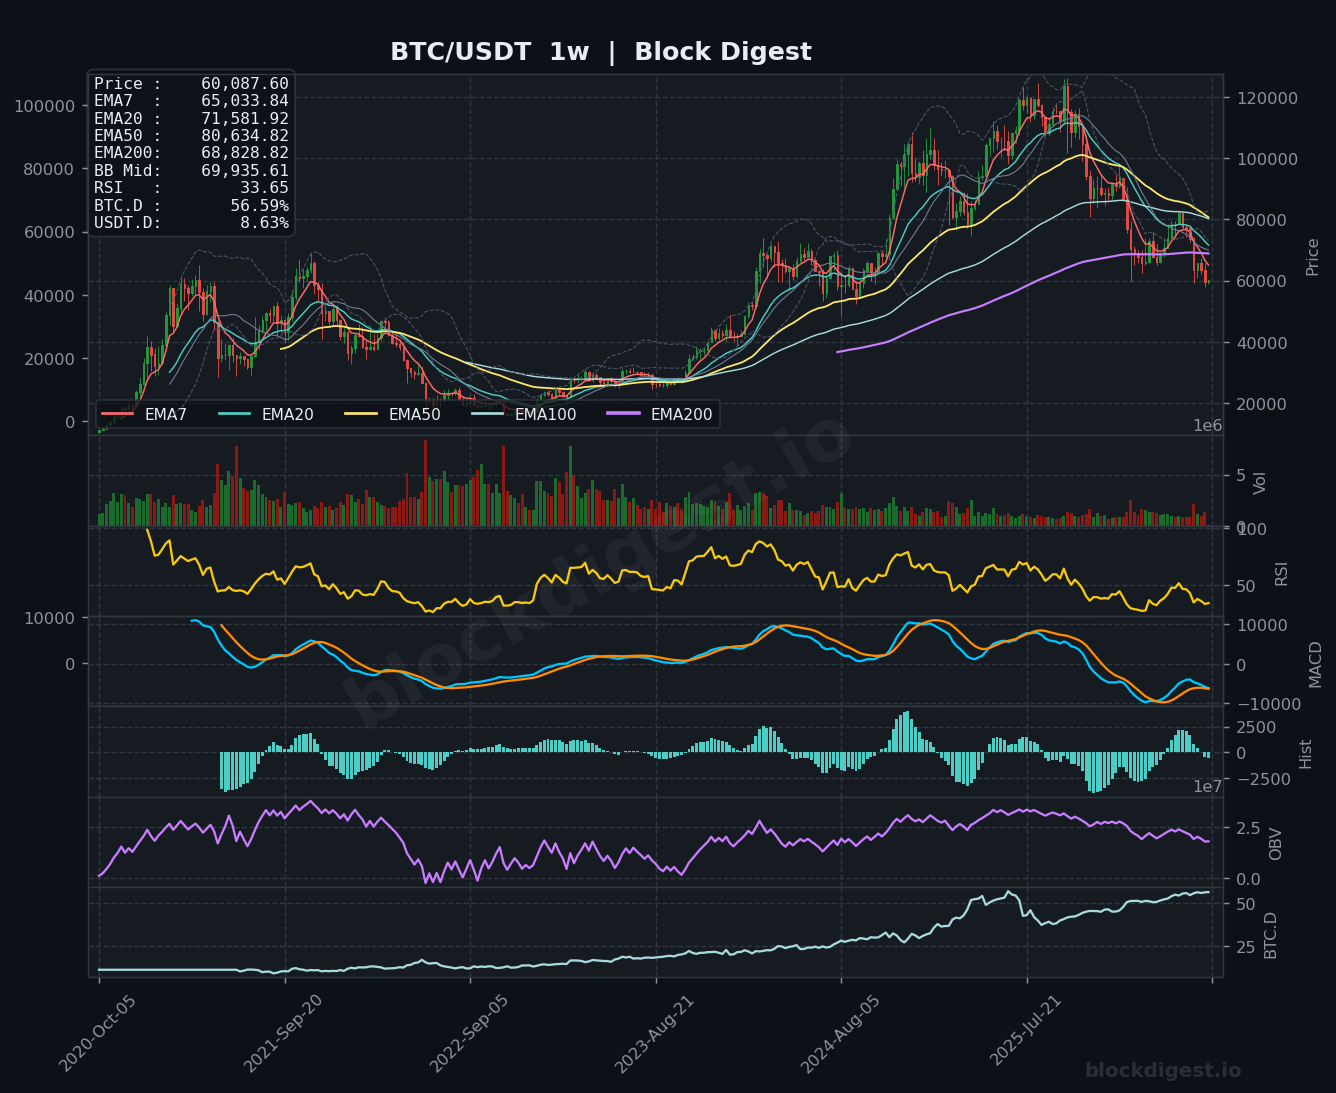
Bitcoin closes the week of June 29, 2026 at approximately $60,087, marking a significant deterioration in market structure as price has breached the psychologically critical $60,000 zone. The weekly candle reflects sustained selling pressure following a prolonged downtrend from the all-time high region above $109,000, with price now trading at levels not seen since mid-2024. This week’s price action confirmed a breakdown below the prior consolidation range near $63,000–$65,000, and the market is struggling to find meaningful demand. The broader macro structure has shifted from bullish trend continuation to a clear distribution phase, raising serious questions about near-term recovery prospects.
Higher Timeframe Structure
On the weekly chart, the EMA stack has undergone a full bearish inversion, with the EMA7 ($65,033) crossed below the EMA20 ($71,581), EMA50 ($80,634), and EMA100, all sloping sharply downward — a classically bearish configuration. Price is currently trading below every major moving average on the weekly timeframe, including the EMA200 ($68,828), which represents a macro-level loss of trend support that is historically significant. The weekly Bollinger Band midline sits at $69,935, some $9,800 above current price, confirming that BTC is pressing against the lower band extremity and is deeply extended to the downside. This is the first time since the 2022 bear market cycle that price has convincingly traded below the weekly EMA200, placing the current structure in a critically important historical context.
Multi-Timeframe Confluence
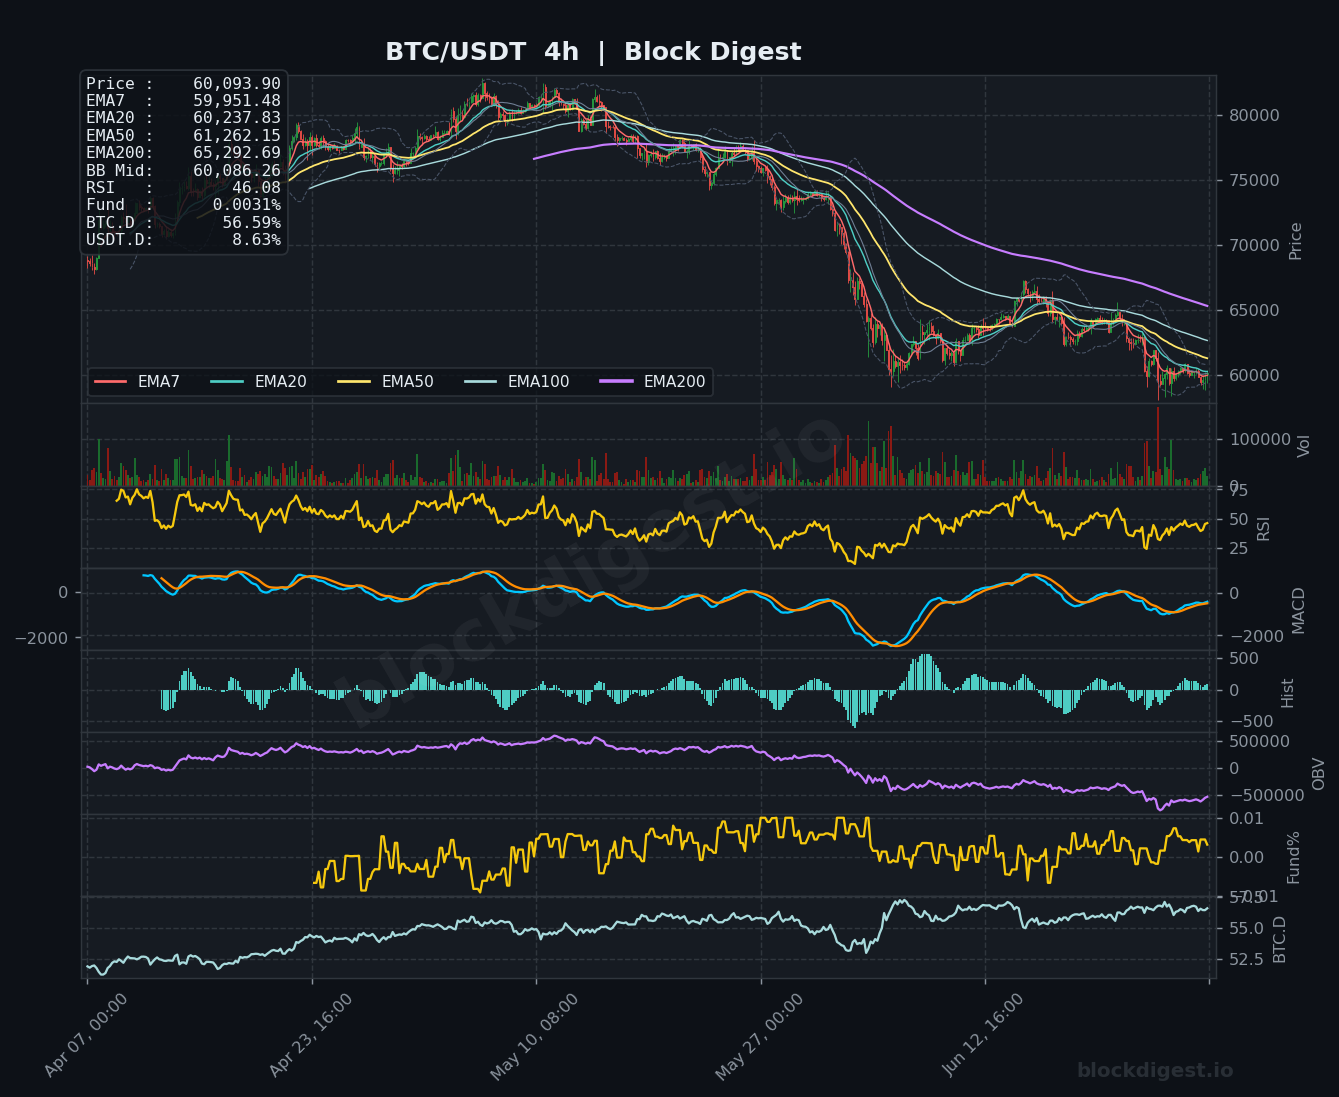
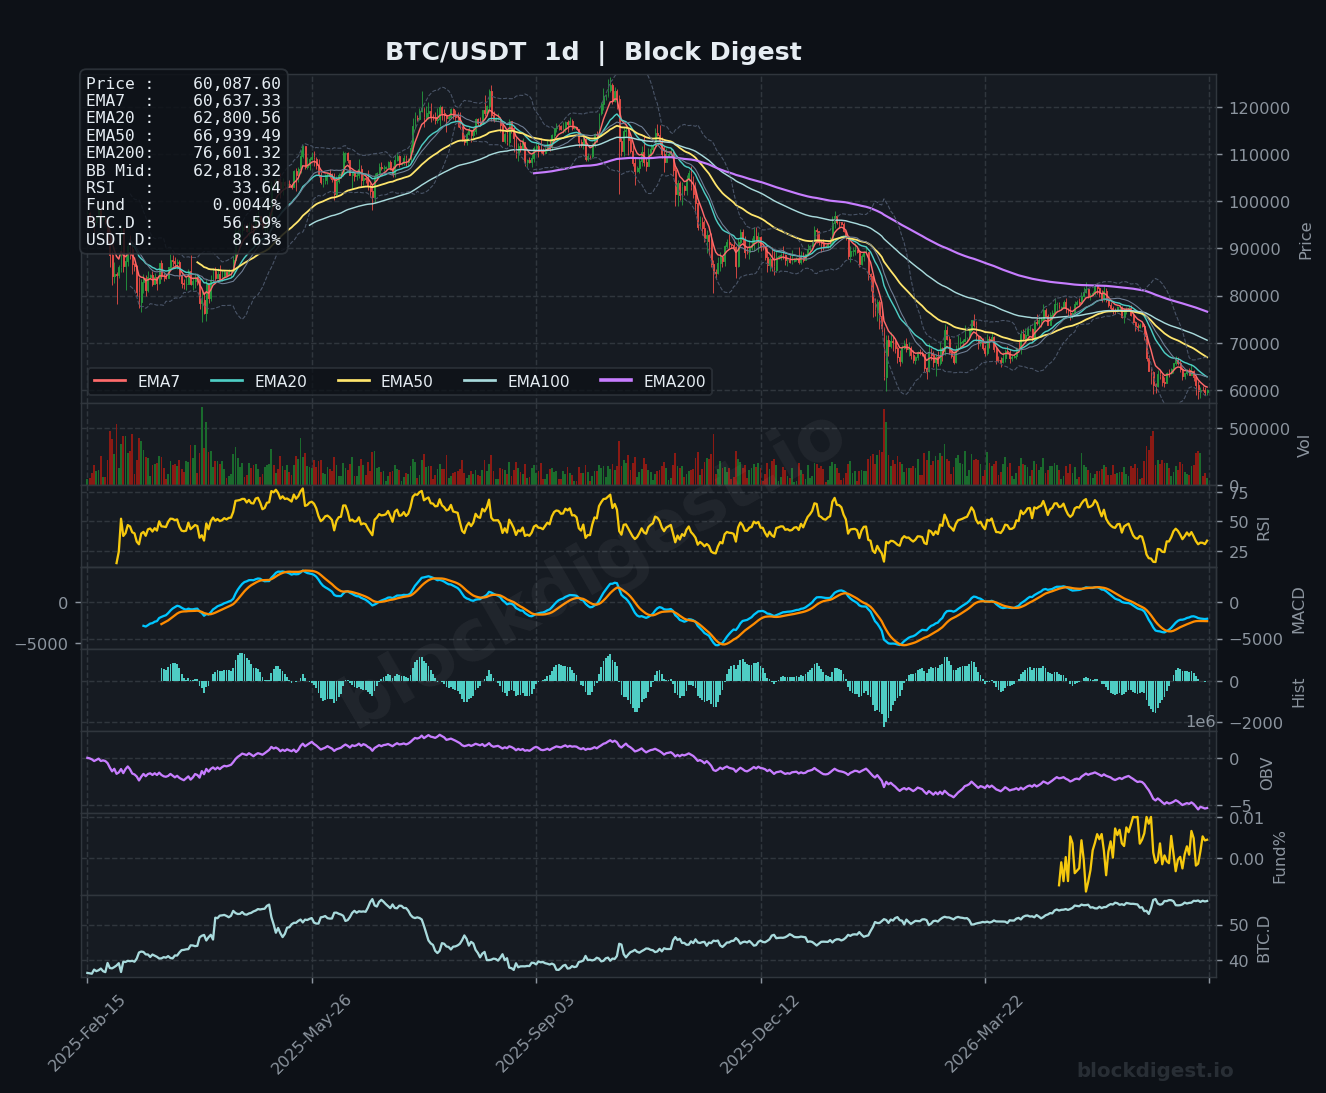
Across all three timeframes, the analysis converges on a single bearish thesis: the trend is down, momentum is negative, and there is no credible reversal signal in place. On the daily chart, price sits below the EMA7 ($60,637), EMA20 ($62,800), EMA50 ($66,939), and EMA200 ($76,601), with the daily BB midline at $62,818 acting as immediate overhead resistance. The 4-hour chart mirrors this structure, with EMA50 at $61,262 and EMA200 at $65,292 forming layered resistance that any recovery attempt will need to reclaim. The $62,800–$63,000 zone represents strong confluence resistance across both the daily EMA20 and the 4-hour structure, making it the critical line in the sand for any near-term bounce thesis.
Key Weekly Levels
- Weekly Resistance: $62,800 (daily EMA20 / 4h structure confluence), $65,000–$65,292 (weekly EMA7 / 4h EMA200 cluster), $68,828–$69,935 (weekly EMA200 and BB midline — macro resistance)
- Weekly Support: $58,500–$59,000 (recent intraweek lows and lower Bollinger Band proximity), $55,000 (psychological round number and historical 2024 consolidation region), $52,000–$53,000 (major 2024 pre-halving accumulation zone and potential macro floor)
Momentum & Volume Analysis
The weekly RSI sits at 33.65, approaching oversold territory but not yet at the extreme readings (sub-30) that have historically preceded meaningful reversals in prior cycles — it remains in a sustained downtrend without a bullish divergence signal. The weekly MACD is deep in negative territory with the histogram still expanding to the downside, indicating that bearish momentum has not yet peaked or begun to rotate. On the daily timeframe, RSI reads 33.64, almost identical to the weekly, confirming alignment in oversold-but-not-exhausted conditions, while the 4-hour RSI at 46.08 shows a brief stabilization at the $60,000 level without strength. The funding rate on both the 4h ($0.0031%) and daily ($0.0044%) remains marginally positive, suggesting that despite the sharp decline, leveraged longs have not been fully flushed — this leaves the market vulnerable to further liquidation cascades if $58,500 support fails.
BTC Dominance & Altcoin Implications
BTC Dominance currently stands at 56.59%, having risen substantially from the sub-40% levels seen in early 2025, reflecting a classic risk-off rotation where capital consolidates into Bitcoin relative to altcoins during a broader market downturn. USDT Dominance at 8.63% indicates a meaningful amount of capital sitting on the sidelines in stablecoins, which is a double-edged signal — it confirms risk aversion is elevated but also represents potential buying power waiting for a credible entry. Until BTC.D shows a clear topping pattern and begins to roll over, altcoin recoveries are likely to remain shallow and short-lived, and broad altcoin market outperformance should not be expected.
Risk Scenarios
- Bull case: A weekly close back above $63,000 — reclaiming the daily EMA20 and 4h structure — would be the minimum requirement to suggest a bottoming attempt is underway. Sustained follow-through above $65,000 with volume confirmation could trigger a relief rally toward the $68,800–$70,000 weekly EMA200/BB midline zone. RSI reclaiming 40+ on the weekly timeframe alongside a MACD histogram contraction would add confirmation to a potential trend shift.
- Bear case: Failure to hold $58,500 on a weekly closing basis opens the door to a swift move toward the $55,000 psychological level, with the $52,000–$53,000 zone representing the next meaningful macro support where 2024 pre-halving accumulation occurred. A weekly RSI print below 30 combined with continued OBV deterioration and a positive funding flush would signal capitulation conditions, potentially accelerating the decline before any durable base forms.
Weekly Outlook
Heading into the week of June 29, 2026, the directional bias remains cautiously bearish with a close eye on the $58,500–$60,000 support shelf, which is now the most critical zone to monitor. The convergence of oversold weekly and daily RSI readings near 33–34 suggests the market is approaching a zone where short-term bounces become increasingly probable, but oversold alone is never a buy signal in a confirmed downtrend. Any relief rally should be treated as a counter-trend move unless price can reclaim $63,000 on strong volume and hold it on a daily closing basis. Macro catalysts — including global risk sentiment, institutional flow data, and any regulatory developments — will be key variables that could accelerate either scenario this week. Overall, the risk/reward for aggressive long positioning at current levels is unfavorable given the lack of a confirmed reversal structure; disciplined traders should await either a capitulation wick with bullish follow-through or a confirmed reclaim of the $63,000–$65,000 resistance band before considering meaningful exposure.
Disclaimer: This analysis is for informational purposes only and does not constitute financial advice. Cryptocurrency markets are highly volatile and unpredictable. All trading decisions should be made based on your own research and risk tolerance. Block Digest is not responsible for any financial losses incurred as a result of acting on this content.
Stay Ahead of the Market
Follow BlockDigest for crypto market intelligence, research and real-time updates.