Ethereum Weekly Analysis: ETH trades below EMAs at $1,717 structural lows
Weekly Market Overview
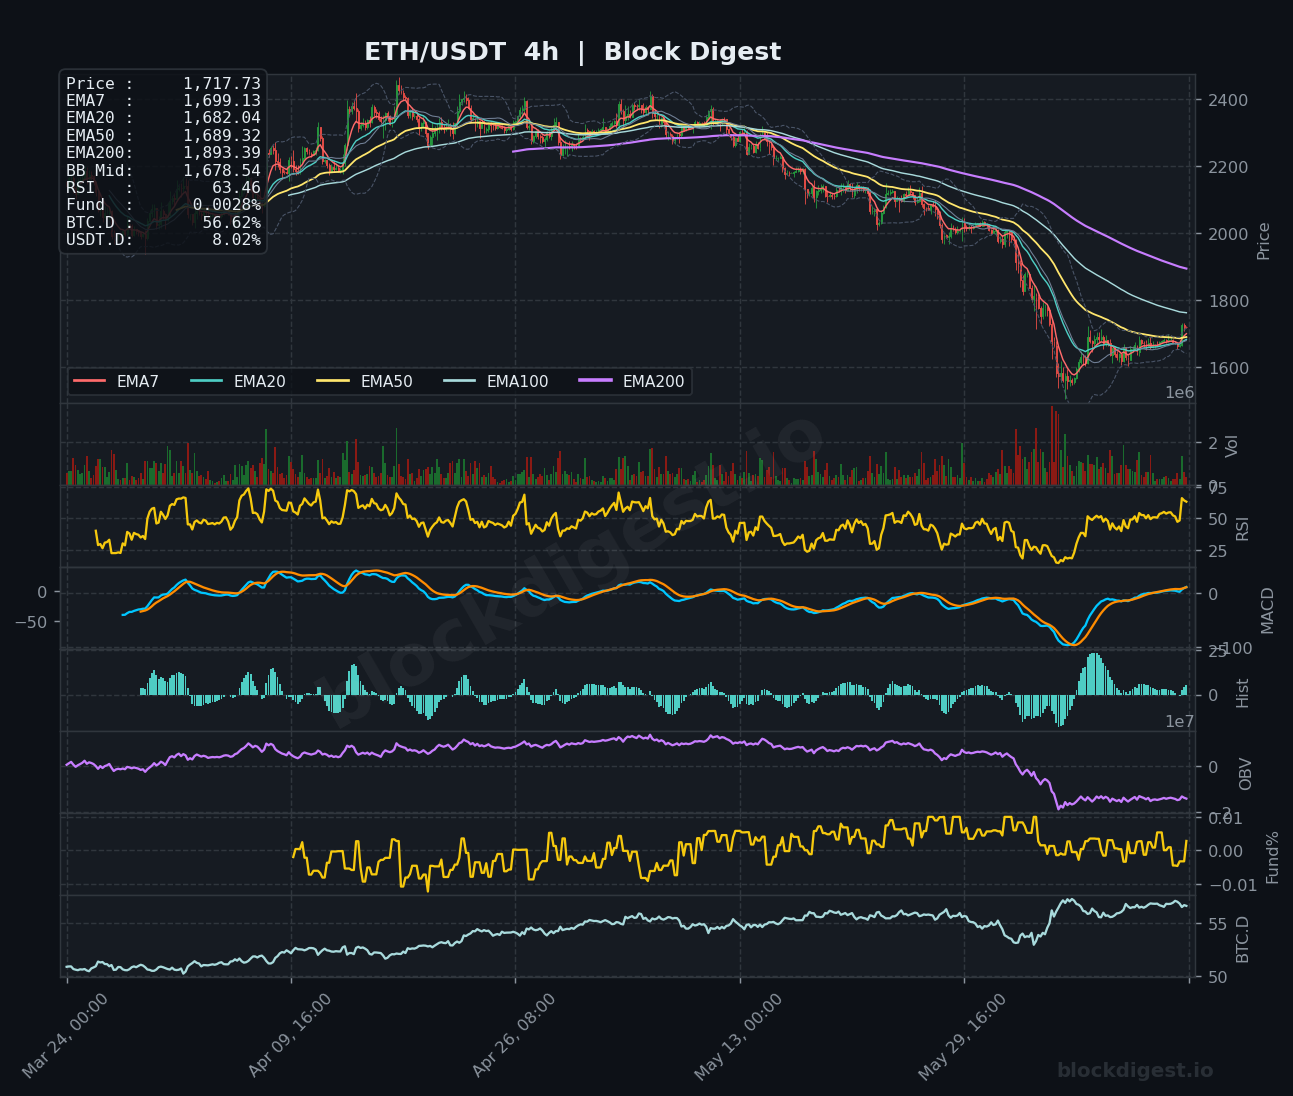
ETH/USDT continues to trade under significant macro pressure, with price currently sitting at $1,717 — well below all major EMAs on the weekly timeframe and near multi-year structural lows relative to the 2024–2025 bull cycle peak. This week’s price action reflects a modest intraweek recovery attempt from the $1,550–$1,600 range lows seen in recent sessions, but the broader structure remains firmly bearish. The weekly candle is forming a tentative green body after a prolonged sequence of red candles, though this should be interpreted as a potential dead-cat bounce rather than confirmed reversal until higher timeframe resistance levels are reclaimed. Context is critical here: ETH has shed over 60% from its cycle highs, and current price action is testing levels not seen since early 2023.
Higher Timeframe Structure
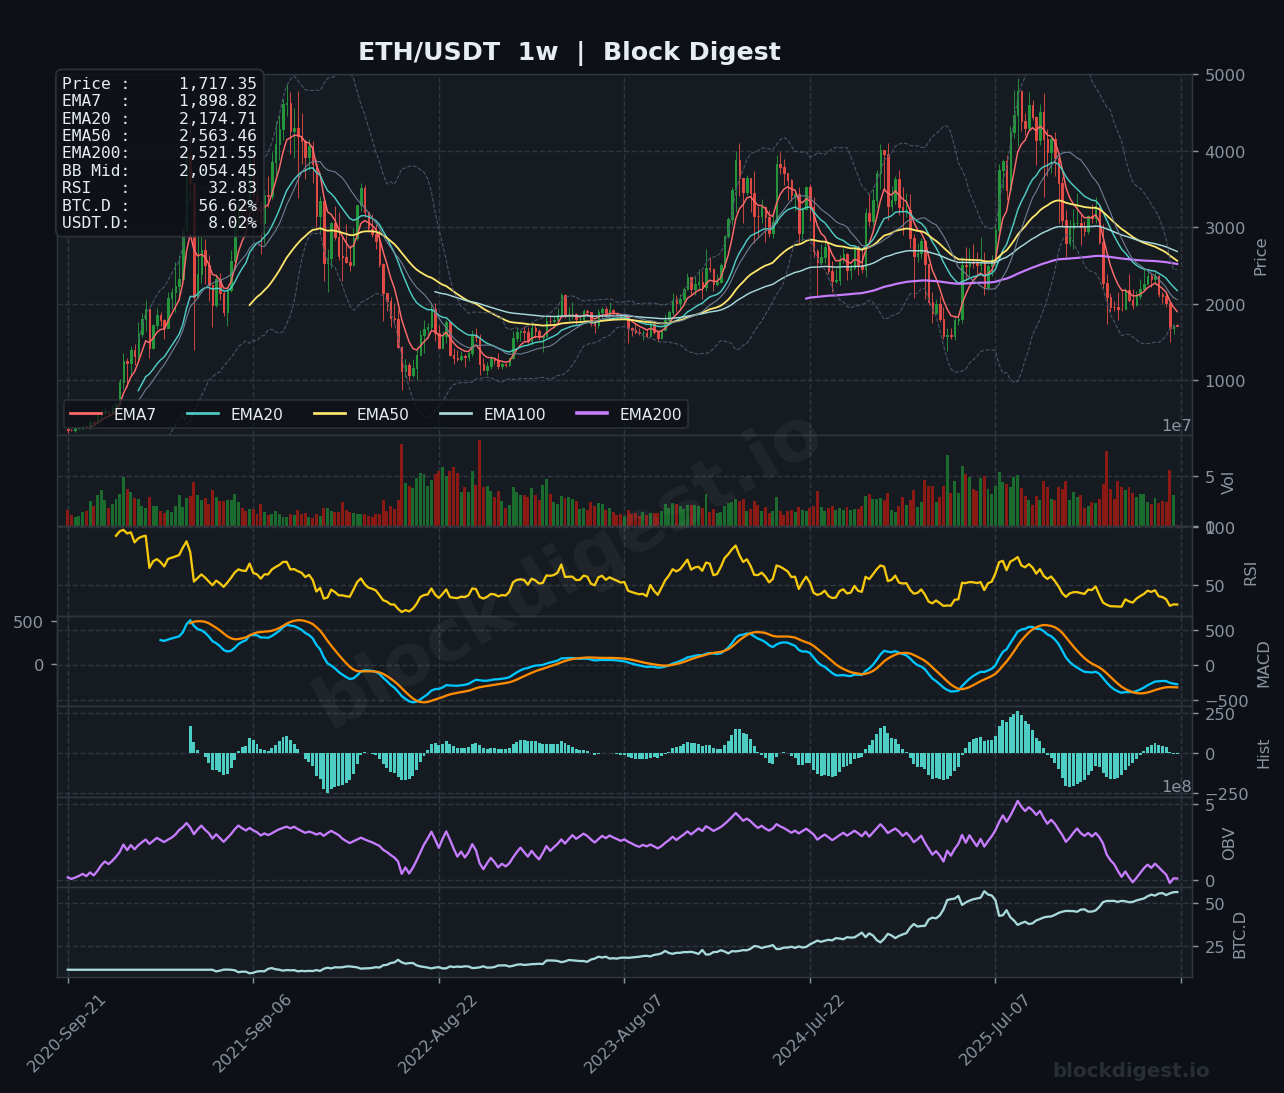
On the weekly chart, the EMA structure is in full bearish cascade — price sits well beneath the EMA7 ($1,899), EMA20 ($2,175), EMA50 ($2,563), and EMA200 ($2,522), with all moving averages sloping aggressively downward. The weekly Bollinger Band midline at $2,054 now acts as a significant overhead resistance, and price is testing the lower Bollinger Band region, which historically has marked oversold exhaustion zones on macro timeframes for ETH. The weekly RSI at 32.83 is approaching — but has not yet reached — the deeply oversold sub-30 territory that has historically coincided with major cycle bottoms (e.g., mid-2022 lows). This suggests the macro downtrend remains intact, though the risk/reward for additional short exposure is becoming increasingly unfavorable at these levels.
Multi-Timeframe Confluence
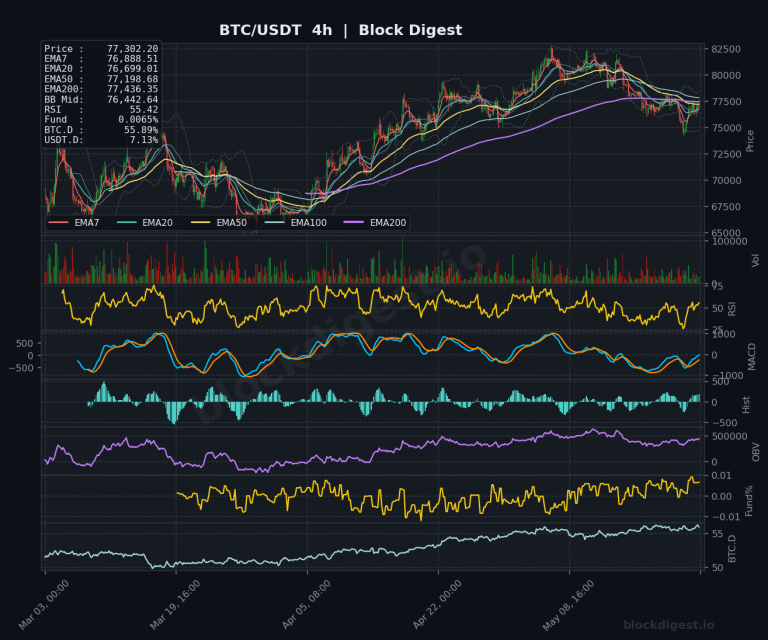
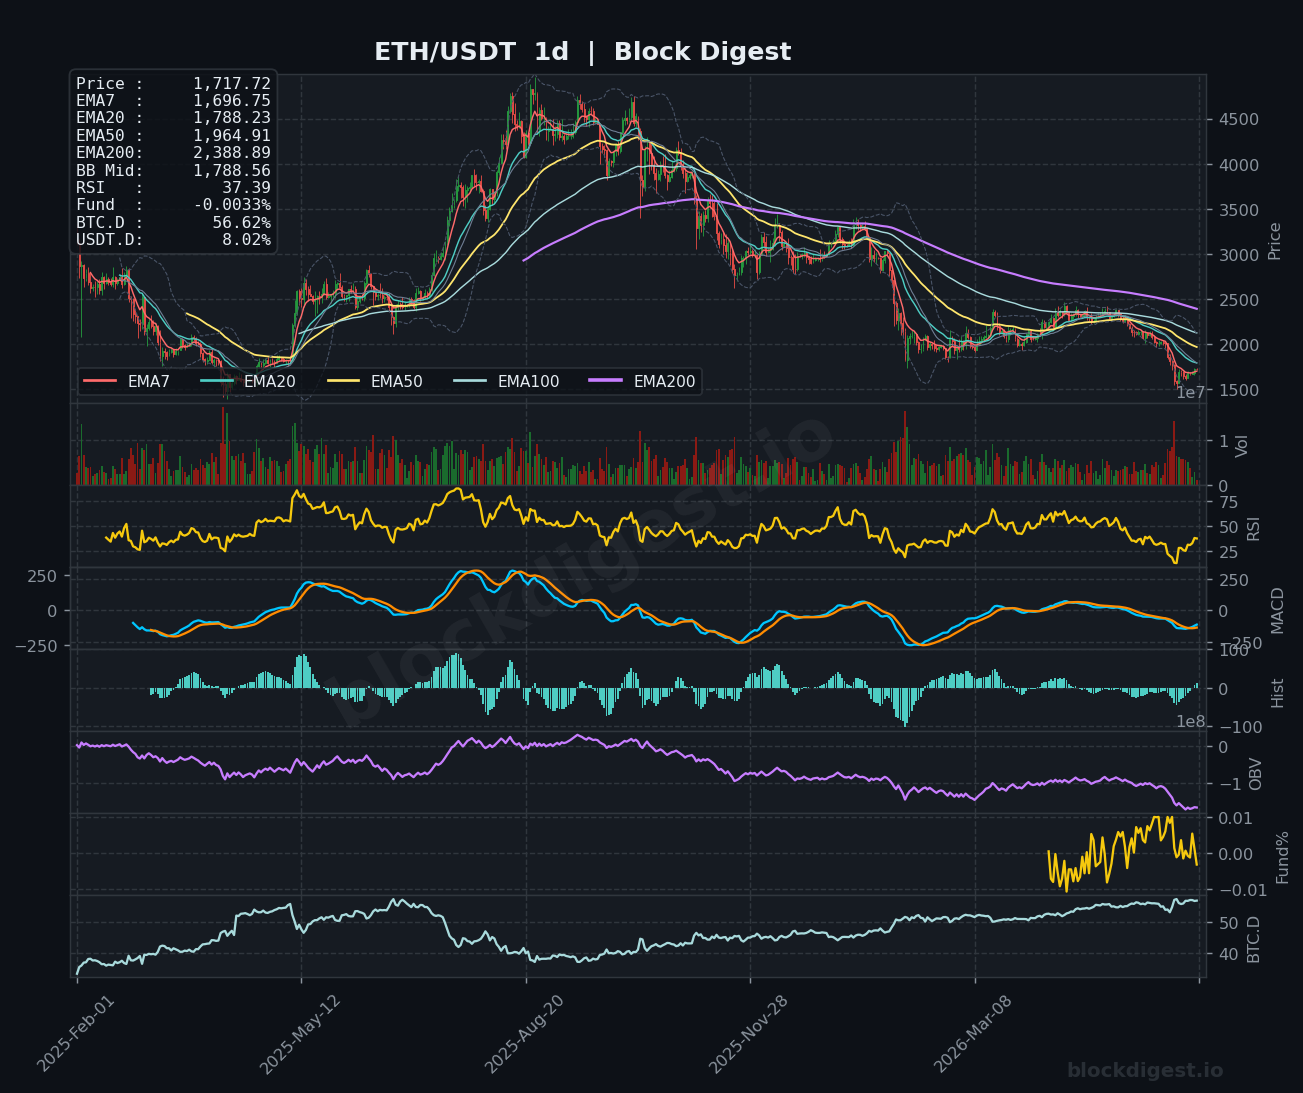
Across all three timeframes, the bearish trend is uniformly confirmed, though the 4h chart is beginning to show the first tentative signs of short-term momentum recovery. On the 4h, price has reclaimed the EMA7 ($1,699) and EMA20 ($1,682), with the RSI pushing to 63.46 — indicating short-term bullish momentum that has not yet translated into daily or weekly trend reversal. The daily chart shows price still trading below all EMAs (EMA7: $1,697; EMA20: $1,788; EMA50: $1,965), with the daily RSI at a deeply oversold 37.39, suggesting the bounce may have further room before hitting structural resistance. Confluent resistance converges sharply in the $1,788–$1,900 zone, where the daily BB midline, daily EMA20, and weekly EMA7 all cluster together.
Key Weekly Levels
- Weekly Resistance:
- $1,788 — Daily BB midline / Daily EMA20, first major overhead confluence
- $1,899 — Weekly EMA7, the critical short-term weekly moving average that must be reclaimed for any bullish thesis
- $2,054–$2,175 — Weekly BB midline and weekly EMA20, macro resistance band that would define a genuine trend reversal
- Weekly Support:
- $1,680–$1,700 — Current 4h EMA cluster and near-term intraweek floor
- $1,550–$1,580 — Recent cycle lows and lower weekly Bollinger Band extension, critical structural support
- $1,400–$1,450 — Major historical demand zone from 2023, last line of macro defense if current lows fail
Momentum & Volume Analysis
The weekly MACD remains in deeply negative territory with the signal line and MACD line both below zero and continuing to trend lower, showing no imminent bullish crossover on the macro timeframe. Weekly OBV has declined sharply from its cycle peak, confirming that net volume distribution has dominated this entire downtrend — a bearish structural signal that cannot be dismissed. On the 4h timeframe, MACD is curling bullish with a positive histogram, and the OBV has stabilized and begun a modest uptick, which is an encouraging short-term development but insufficient to reverse the macro picture. The funding rate sits at a near-neutral +0.0028% on the 4h (slightly negative on the daily at -0.0033%), suggesting the market is not significantly overleveraged to either side — a balanced positioning environment that typically precedes directional resolution rather than a squeeze-driven move.
BTC Dominance & Altcoin Implications
BTC dominance at 56.62% remains elevated and has been on a persistent uptrend visible across all timeframes, reflecting ongoing capital rotation out of altcoins and into Bitcoin as the risk-off asset of choice within crypto. USDT dominance at 8.02% indicates that a meaningful portion of market participants remain in stablecoins, which could represent dry powder for a re-entry but also confirms the broader risk-off sentiment that has weighed on ETH and the altcoin complex. Until BTC.D shows a decisive reversal and begins compressing, sustained ETH outperformance or a meaningful altcoin season rotation remains unlikely in the near term.
Risk Scenarios
- Bull case: A sustained 4h close above $1,788 (daily EMA20/BB mid) followed by a daily candle reclaim would open the door toward $1,900–$1,965, where the weekly EMA7 and daily EMA50 converge. For this scenario to gain traction, BTC dominance would need to peak and roll over, and the daily RSI would need to break above 50, signaling a trend regime shift. Weekly targets on a confirmed reversal would extend toward $2,054–$2,175.
- Bear case: Failure to hold the $1,680–$1,700 support cluster on any pullback from the current bounce would expose the $1,550 cycle lows for retest. A weekly close below $1,550 with expanding volume would be a critical bearish signal, potentially triggering a flush toward the $1,400–$1,450 macro support zone where longer-term buyers historically have stepped in at scale.
Weekly Outlook
The directional bias for the week of June 15, 2026 is cautiously neutral-to-bearish with a short-term counter-trend bounce in play — the 4h momentum recovery is real, but it must be viewed within the context of a structurally broken higher timeframe trend. The critical level to monitor this week is the $1,788–$1,800 zone: a decisive reclaim here would shift the narrative toward a potential weekly low being established, while rejection at that level would likely see price retest the $1,600–$1,650 region. Key catalysts to watch include any macro risk sentiment shifts, Ethereum ecosystem news, and ETH ETF flow data, all of which could amplify moves in either direction. Traders should note that the weekly RSI at 32.83 is historically approaching levels where risk/reward for new short positions deteriorates significantly, even in structural bear markets. The overall setup suggests patience is warranted — waiting for either a confirmed daily EMA20 reclaim for a recovery trade, or a failed retest of that level for continuation shorts toward cycle lows.
Disclaimer: This analysis is for informational purposes only and does not constitute financial advice. Cryptocurrency markets are highly volatile and unpredictable. All trading decisions should be made based on your own research and risk tolerance. Block Digest is not responsible for any financial losses incurred as a result of acting on this content.