Bitcoin Daily Analysis: Bitcoin below EMA20 as recovery phase continues
Market Overview
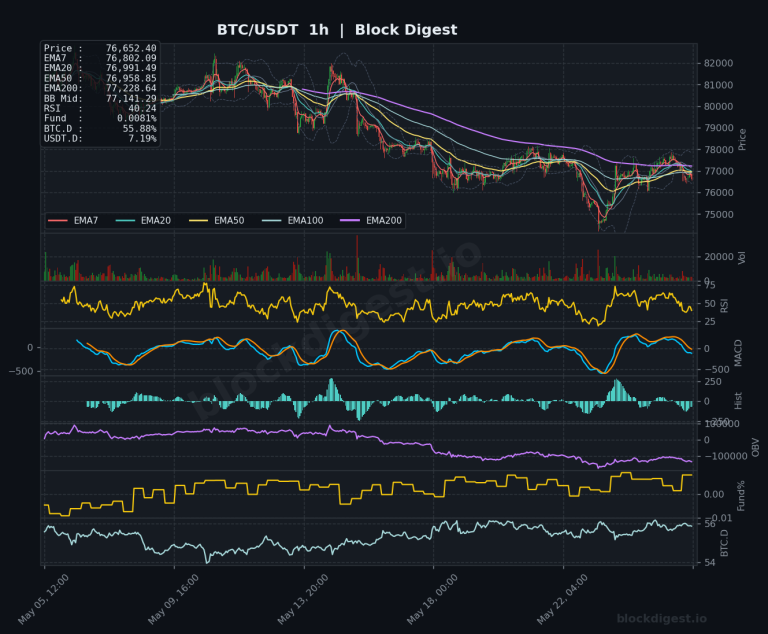
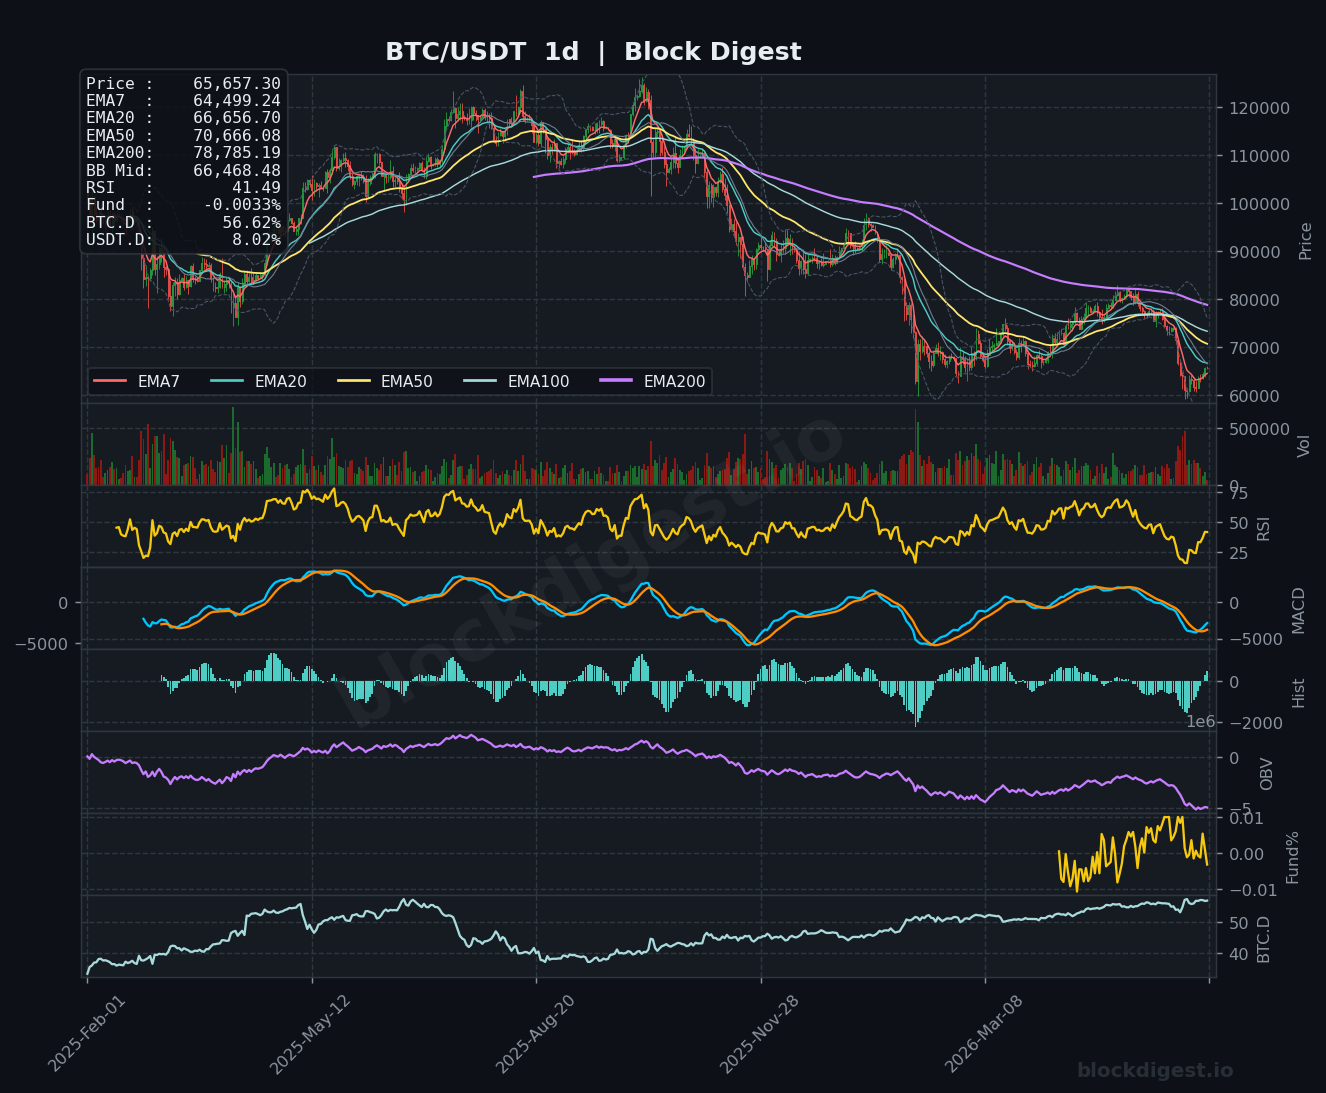
Bitcoin is currently trading at $65,659.40, navigating a critical recovery phase following a significant multi-week drawdown from highs above $109,000. On the daily timeframe, price remains firmly below the EMA20 ($66,656.70), EMA50 ($70,666.08), and EMA200 ($78,785.19), confirming that the macro trend remains bearish. The daily Bollinger Band midline sits at $66,468.48, and price is currently trading just beneath it — a level that has historically acted as a dynamic resistance during downtrends. The daily EMA7 at $64,499.24 is the only short-term average providing immediate support, suggesting the recent bounce remains fragile.
Multi-Timeframe Confluence
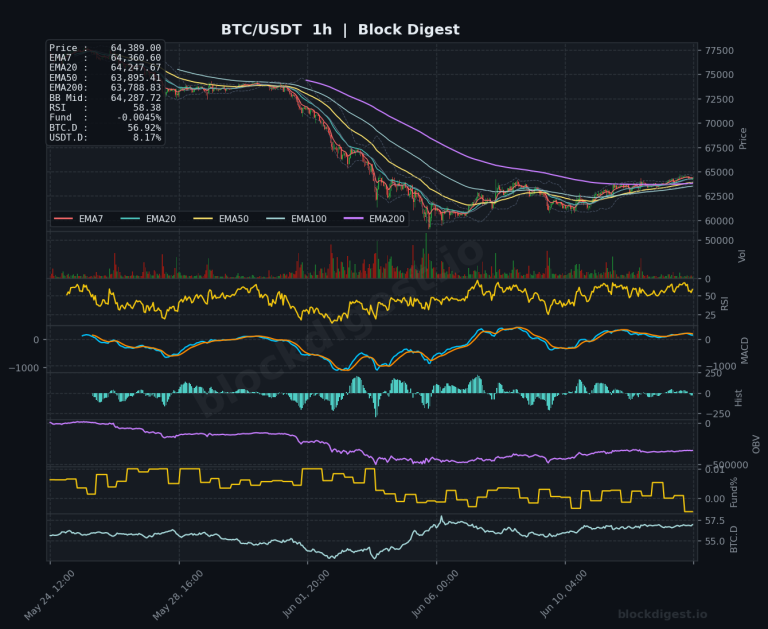
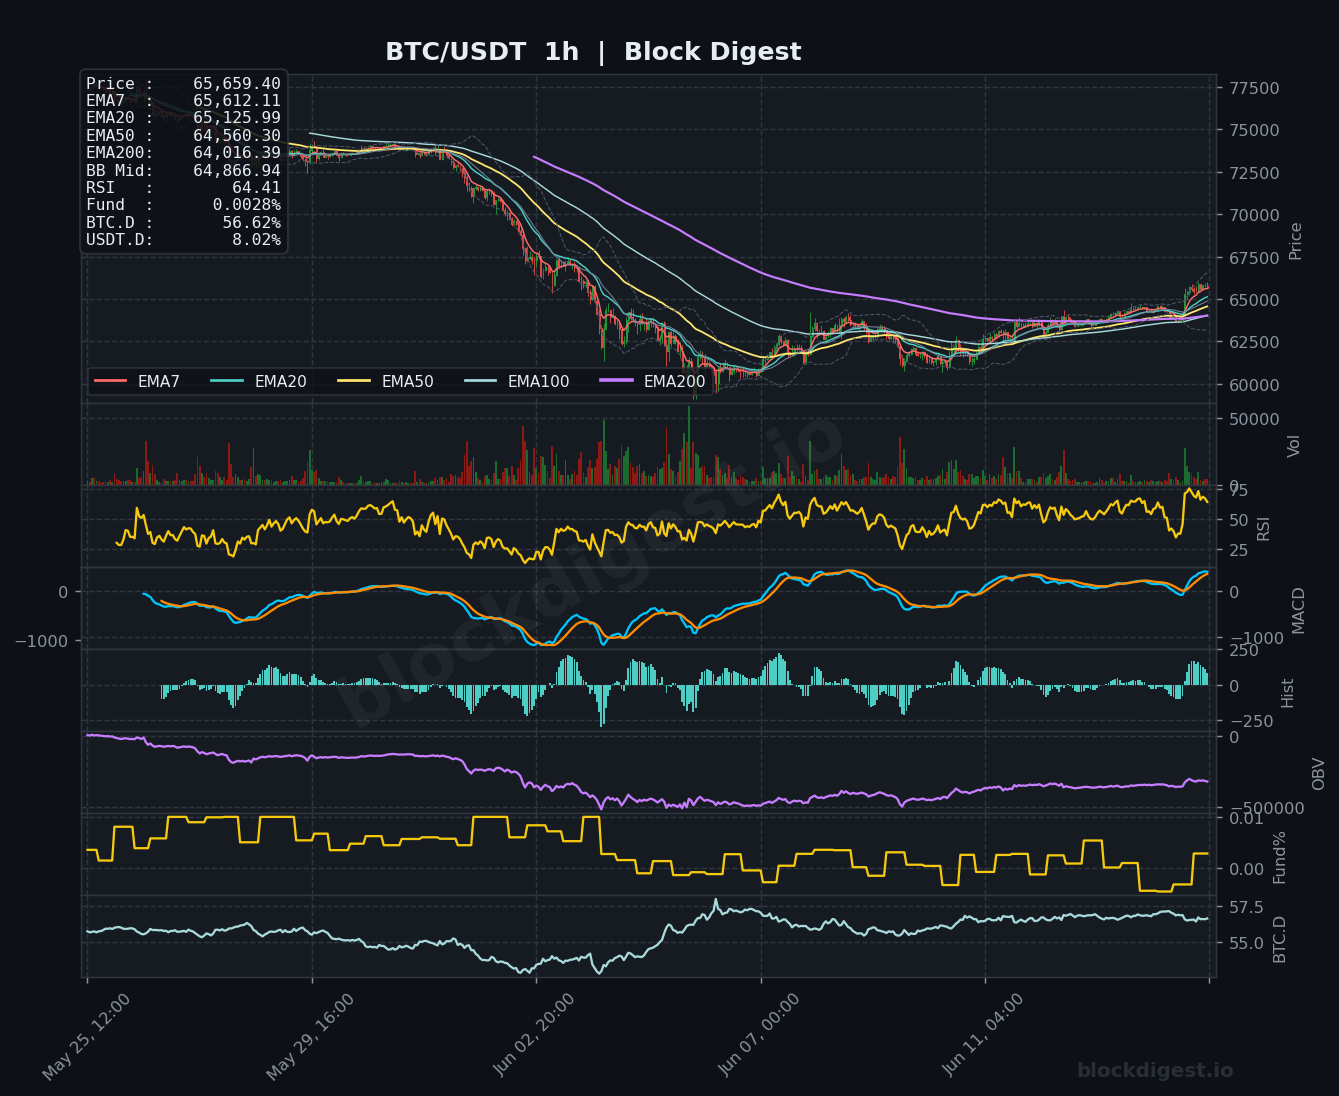
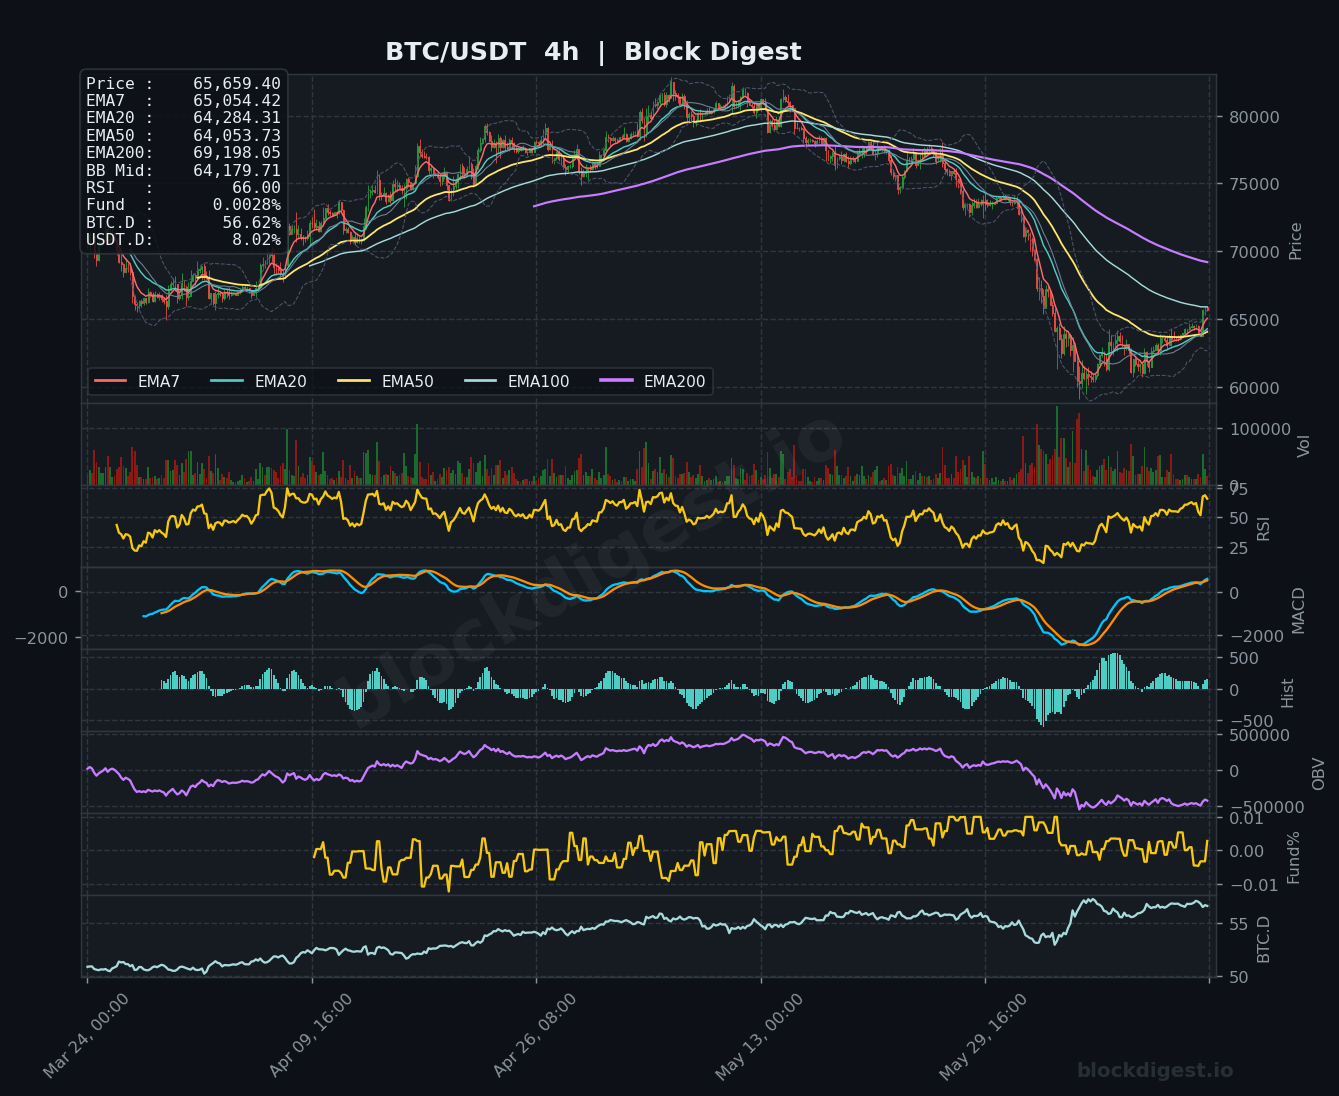
On the 1-hour chart, price is trading above all short-term EMAs (EMA7: $65,612.11, EMA20: $65,125.99, EMA50: $64,560.30, EMA200: $64,016.39), reflecting a constructive short-term structure. The 4-hour chart reinforces this near-term recovery narrative, with price above the EMA7 ($65,054.42), EMA20 ($64,284.31), and EMA50 ($64,053.73), though it remains well below the 4h EMA200 at $69,198.05. The critical divergence across timeframes is stark — while the 1h and 4h show bullish EMA stacking, the daily chart’s deeply negative EMA alignment suggests any near-term strength is operating against the dominant trend. Confluent resistance clusters around the $66,400–$66,700 zone where the daily BB midline and EMA20 converge.
Key Levels to Watch
- Resistance: $66,468 — Daily Bollinger Band midline and a key dynamic resistance level that must be reclaimed for trend reversal to gain credibility
- Resistance: $66,656 — Daily EMA20, the first major moving average overhead and a decisive bull/bear line on the higher timeframe
- Resistance: $69,198 — 4-hour EMA200, a structurally significant level that would signal a meaningful regime shift if recovered
- Support: $64,560 — 1-hour EMA50, near-term intraday support that has been holding the recent consolidation base
- Support: $64,016 — 1-hour EMA200, a key short-term floor; a break below here would invalidate the current recovery impulse
- Support: $62,000–$62,500 — Recent swing low zone visible across the 1h and 4h charts, representing the last significant demand area before deeper corrective targets
Momentum & On-Chain Signals
The RSI readings paint a nuanced picture across timeframes: the 1h RSI at 64.41 and the 4h RSI at 66.00 indicate short-term bullish momentum approaching mildly overbought territory, while the daily RSI at just 41.49 confirms that the macro momentum structure remains weak and has not yet fully recovered from oversold conditions. The 4h MACD shows an improving histogram, with the signal lines beginning to converge from deeply negative territory — a tentative bullish crossover appears to be forming. However, the daily MACD remains in bearish territory with the fast line still below the signal line, and no confirmed crossover yet. The OBV on the daily timeframe continues to trend lower, indicating ongoing net distribution pressure at the macro level, which is a notable bearish divergence against the short-term price bounce.
BTC Dominance & Market Sentiment
BTC Dominance is currently at 56.62%, a relatively elevated level that signals capital remains concentrated in Bitcoin rather than rotating broadly into altcoins — a typical pattern during risk-off or recovery phases where market participants prefer Bitcoin’s relative safety. USDT Dominance at 8.02% reflects a still-cautious market posture, with a meaningful proportion of capital sitting on the sidelines in stablecoins. Together, these readings suggest the broader market has not yet entered a risk-on rotation, which limits the likelihood of an explosive altcoin-led rally and keeps near-term focus squarely on BTC’s ability to reclaim key structural levels.
Risk Scenarios
- Bullish case: A sustained close above the daily BB midline at $66,468 and the daily EMA20 at $66,656 on meaningful volume would confirm a structural shift, opening a path toward the $69,198 4h EMA200 and potentially the $70,666 daily EMA50 in the following sessions.
- Bearish case: Failure to hold the 1h EMA200 at $64,016 on a closing basis would signal the bounce is exhausted, risking a retest of the $62,000–$62,500 swing low zone and potentially triggering a deeper leg down toward the $59,000–$60,000 macro support region.
Outlook
The current setup presents a cautious short-term recovery within a structurally bearish macro trend — bulls have made meaningful progress on the 1h and 4h timeframes, but the daily chart demands respect given price’s position well below all major moving averages. The next 24–48 hours are pivotal, with the $66,468–$66,656 resistance cluster serving as the definitive bull/bear decision zone. A positive funding rate of 0.0028% on the 1h suggests modest long-side bias without excessive leverage buildup, which is a marginally constructive sign. Unless bulls can reclaim the daily EMA20 and hold it on a closing basis, the path of least resistance on the macro timeframe remains to the downside, and any rallies should be approached with disciplined risk management.
Disclaimer: This analysis is for informational purposes only and does not constitute financial advice. Cryptocurrency markets are highly volatile and unpredictable. All trading decisions should be made based on your own research and risk tolerance. Block Digest is not responsible for any financial losses incurred as a result of acting on this content.