Bitcoin Daily Analysis: Bitcoin at $64,389 Below Key EMAs
Market Overview
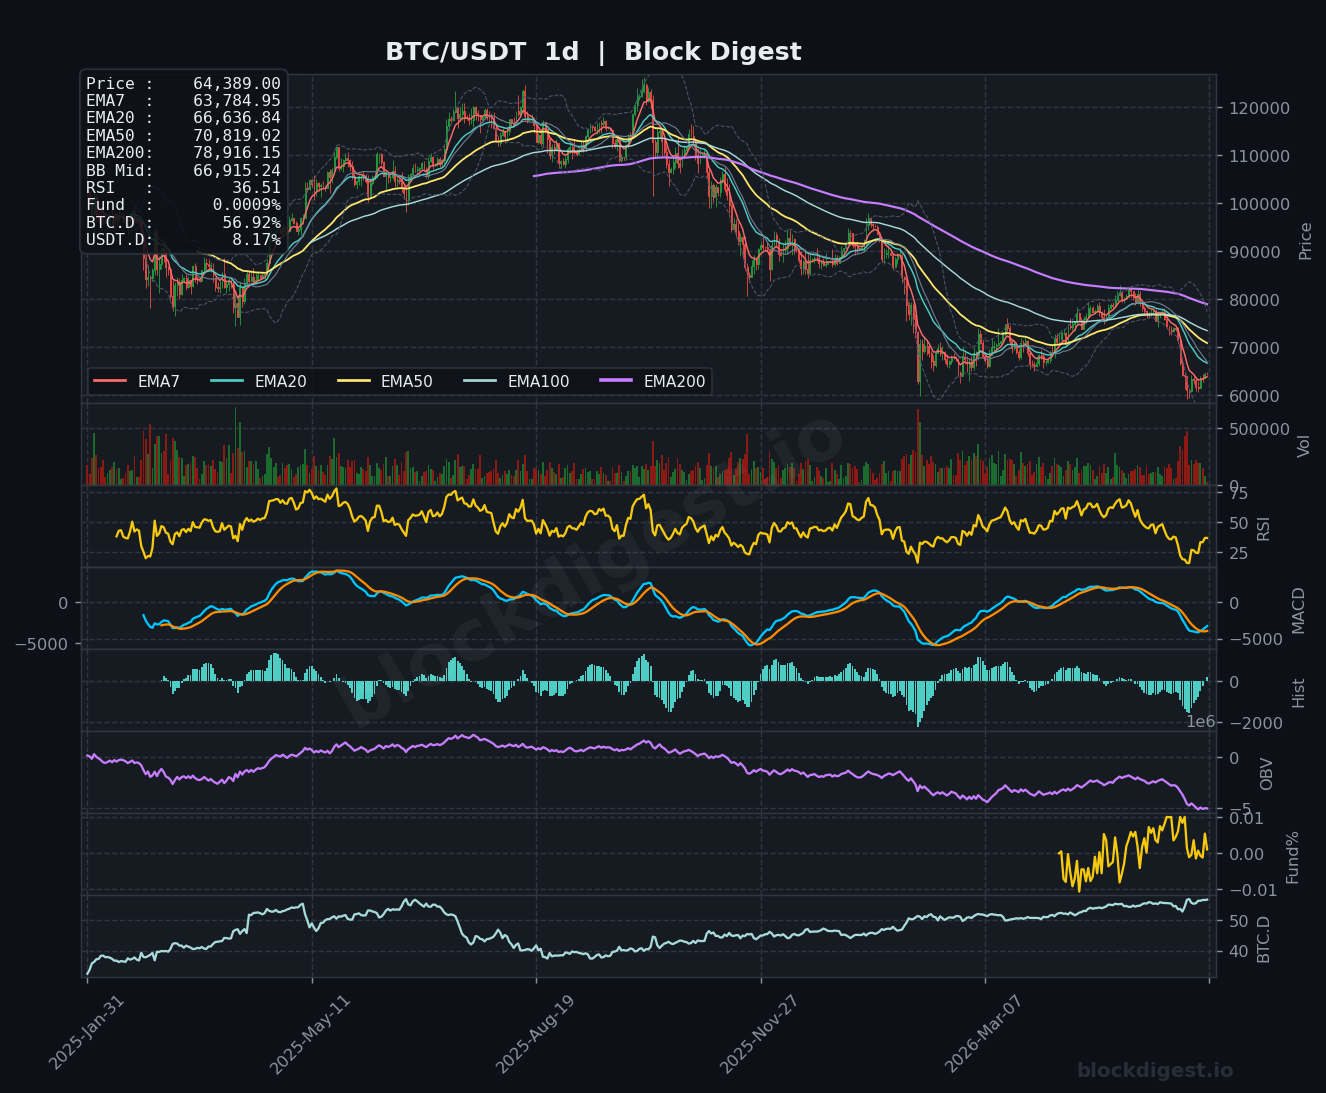
Bitcoin is currently trading at $64,389, attempting a modest recovery after a prolonged multi-week correction that dragged price from highs near $80,000 down to lows around $60,000. On the daily timeframe, BTC remains firmly below all major EMAs — the EMA7 at $63,784, EMA20 at $66,636, EMA50 at $70,819, and the EMA200 at $78,916 — painting a clearly bearish macro structure. Price is currently hugging the lower half of the daily Bollinger Band, with the BB midline sitting at $66,915, acting as a near-term ceiling. The dominant daily trend remains bearish, with the EMA stack in full bearish alignment and no confirmed structural reversal yet in place.
Multi-Timeframe Confluence
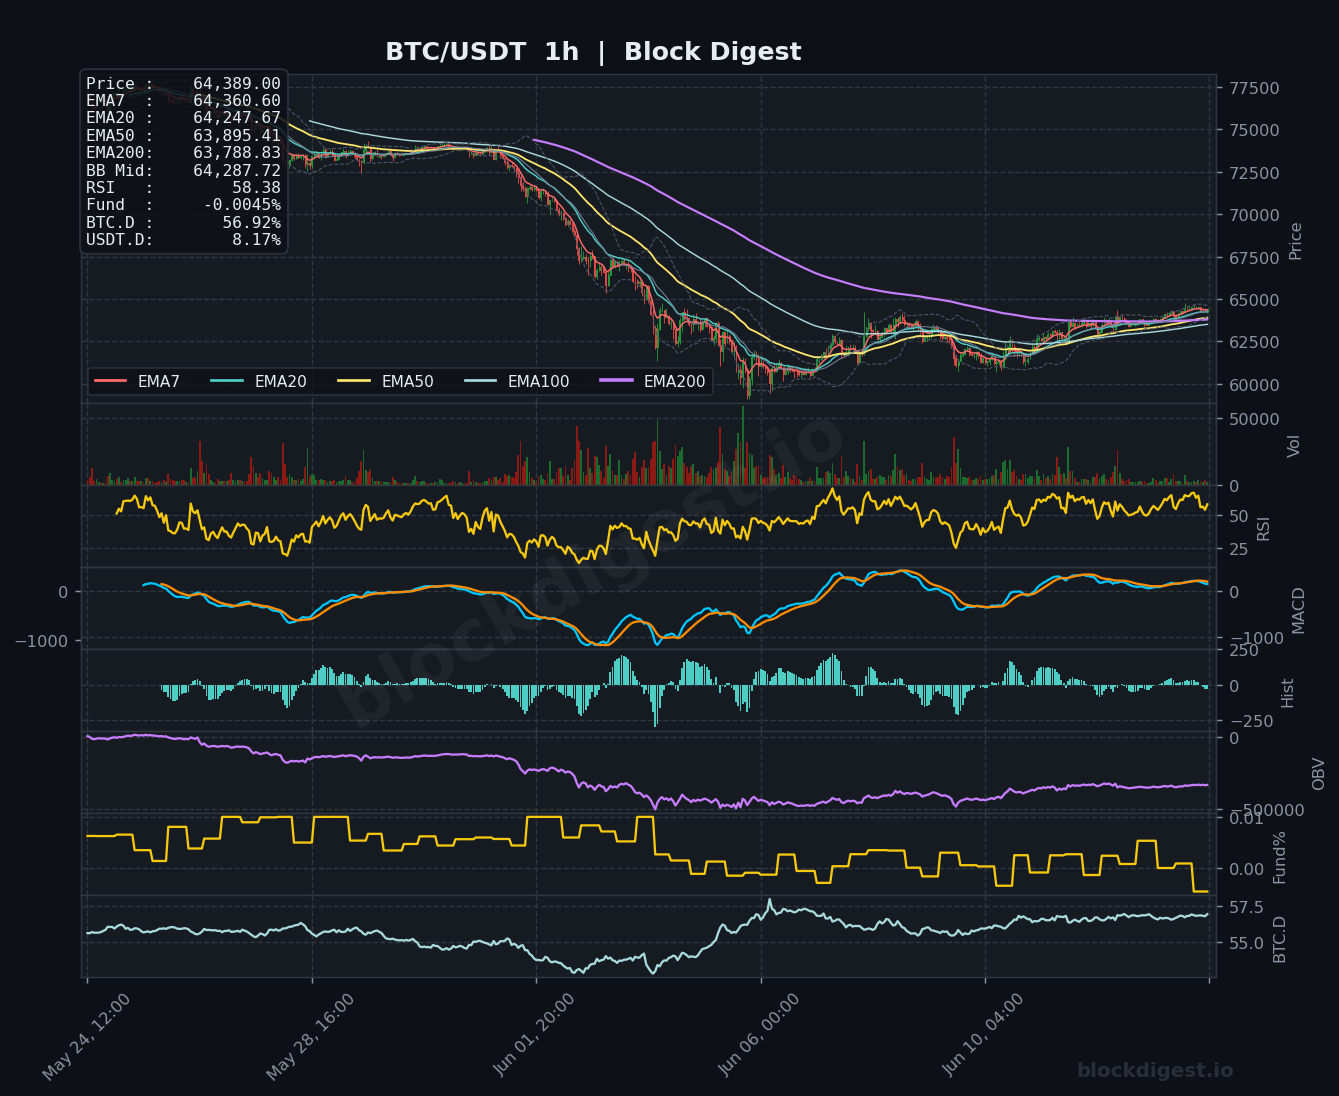
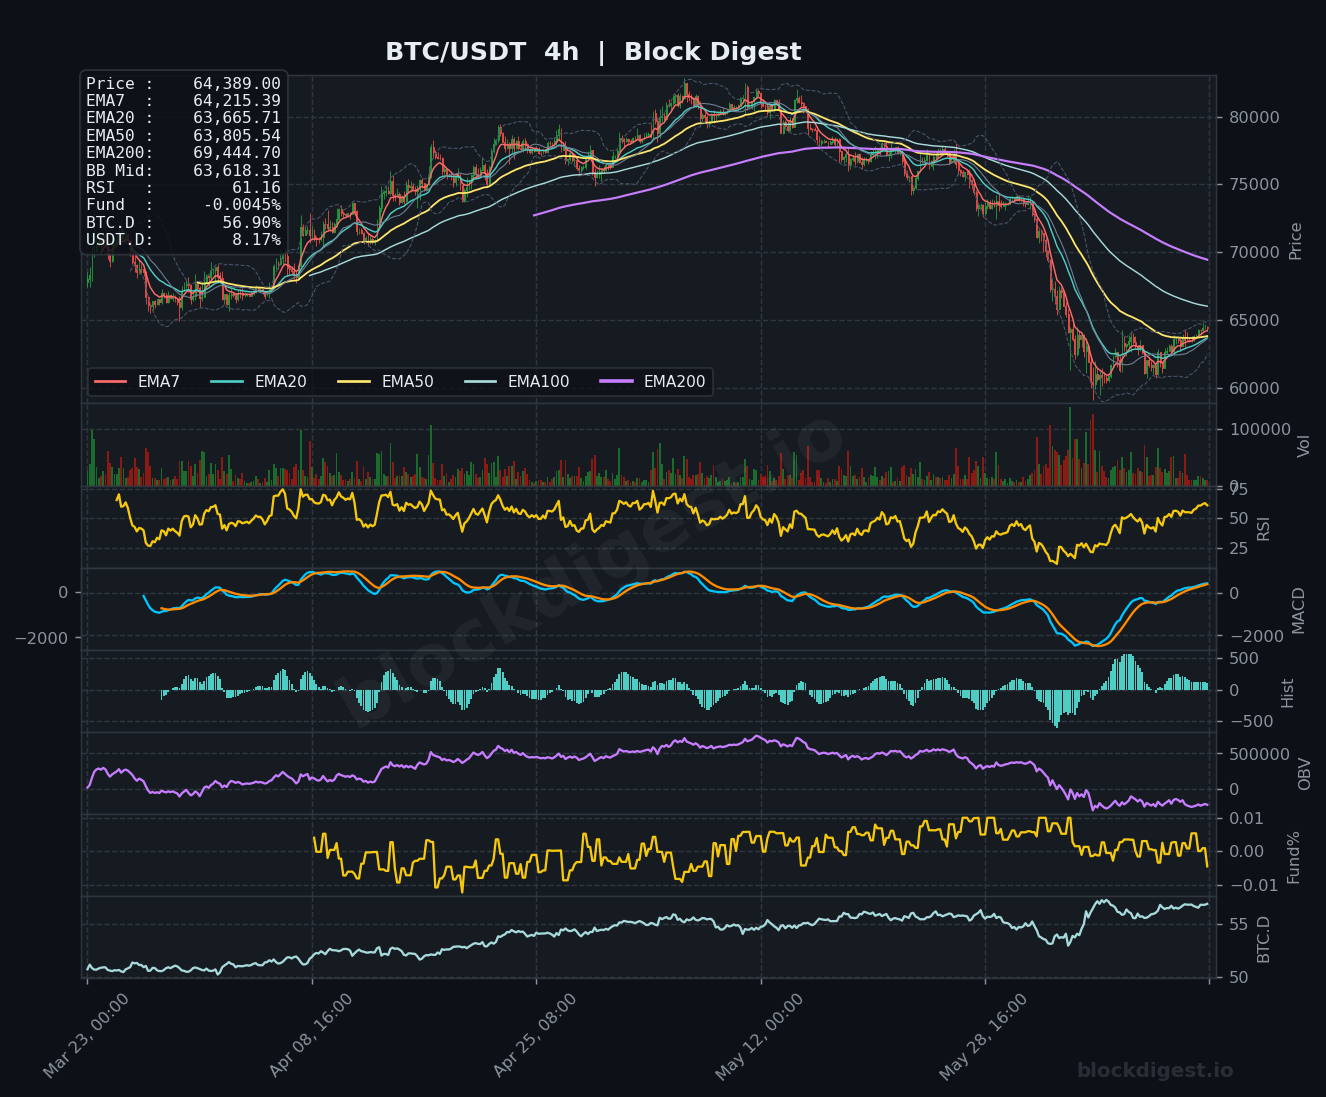
On the 1-hour chart, BTC has reclaimed all short-term EMAs (EMA7 at $64,360, EMA20 at $64,247, EMA50 at $63,895, EMA200 at $63,788), suggesting near-term bullish momentum is intact and the EMAs are beginning to compress and flatten. The 4-hour chart shows a similar picture, with price reclaiming the EMA7 ($64,215) and EMA20 ($63,665), though the EMA200 ($69,444) remains a significant overhead hurdle. Critically, all three timeframes converge on the $63,600–$64,000 zone as a pivotal short-term support cluster, making it a high-confluence area to monitor closely. However, the short-term recovery on the 1h and 4h frames has yet to show enough strength to challenge the bearish bias established on the daily chart.
Key Levels to Watch
- Resistance: $65,500 — recent consolidation ceiling and initial barrier where selling pressure has reemerged
- Resistance: $66,636 — daily EMA20 and BB midline confluence, a key level that would need reclaiming to shift daily bias
- Resistance: $69,444 — 4h EMA200, a major structural resistance representing the upper boundary of the current recovery range
- Support: $63,600–$63,800 — confluence of the 1h and 4h short-term EMA cluster; loss of this zone would signal near-term recovery failure
- Support: $61,500–$62,000 — recent swing lows that briefly held during the deepest part of the correction; a critical demand zone
- Support: $59,500–$60,000 — psychological round number and the approximate lower Bollinger Band on the daily; last major defense before deeper drawdown
Momentum & On-Chain Signals
The RSI readings present an interesting divergence across timeframes: the 1h RSI sits at 58.38 and the 4h RSI at 61.16, both in neutral-to-slightly-bullish territory, suggesting short-term momentum is recovering. However, the daily RSI at 36.51 remains in bearish territory, approaching but not yet at oversold levels, and has not confirmed a bullish reversal. The 4h MACD shows the signal and MACD lines beginning to converge near zero, with the histogram flipping toward positive — a tentative early bullish crossover signal, though confirmation is still needed. OBV on both the 4h and daily charts trends downward, indicative of ongoing distribution pressure, which undermines the credibility of the short-term price bounce. The funding rate is slightly negative at -0.0045%, suggesting a mildly net-short perpetuals market — this could act as fuel for a short squeeze if buying pressure increases.
BTC Dominance & Market Sentiment
BTC Dominance stands at 56.92%, a notably elevated reading that reflects ongoing capital consolidation into Bitcoin relative to altcoins, suggesting risk appetite across the broader crypto market remains cautious. USDT Dominance at 8.17% indicates a meaningful portion of market participants remain in stablecoins, not yet ready to redeploy into risk assets. Together, these readings paint a picture of defensive positioning — while BTC benefits from relative strength, the overall sentiment does not yet support a broad risk-on environment.
Risk Scenarios
- Bullish case: A clean reclaim and daily close above $66,636 (daily EMA20/BB midline) with expanding volume and a daily RSI push above 45 would signal a meaningful recovery attempt, with the next target near $69,444 and potentially $71,000–$72,000 thereafter.
- Bearish case: Failure to hold the $63,600 EMA cluster on the 4h timeframe, particularly on rising volume, would indicate the bounce is exhausted; a break below $61,500 would expose the $59,500–$60,000 zone and risk a retest of lower structural supports.
Outlook
The near-term setup leans cautiously toward a continued consolidation or modest recovery attempt, with BTC needing to prove itself above $65,500–$66,600 to shift market structure in any meaningful way. The next 24–48 hours are critical: watch for whether price can sustain above the 1h and 4h EMA cluster around $63,800–$64,200 on any pullbacks, and whether volume accompanies any breakout attempt toward $66,000+. A daily close above $66,636 would be the clearest signal to shift short-term bias to neutral-bullish, while a breakdown below $63,600 would reinforce the dominant bearish trend. Until the daily timeframe shows a confirmed structural shift, the path of least resistance structurally remains to the downside, and traders should approach recoveries with disciplined risk management.
Disclaimer: This analysis is for informational purposes only and does not constitute financial advice. Cryptocurrency markets are highly volatile and unpredictable. All trading decisions should be made based on your own research and risk tolerance. Block Digest is not responsible for any financial losses incurred as a result of acting on this content.