Bitcoin Daily Analysis: Bitcoin Below EMA20 in Bearish Structure
Market Overview
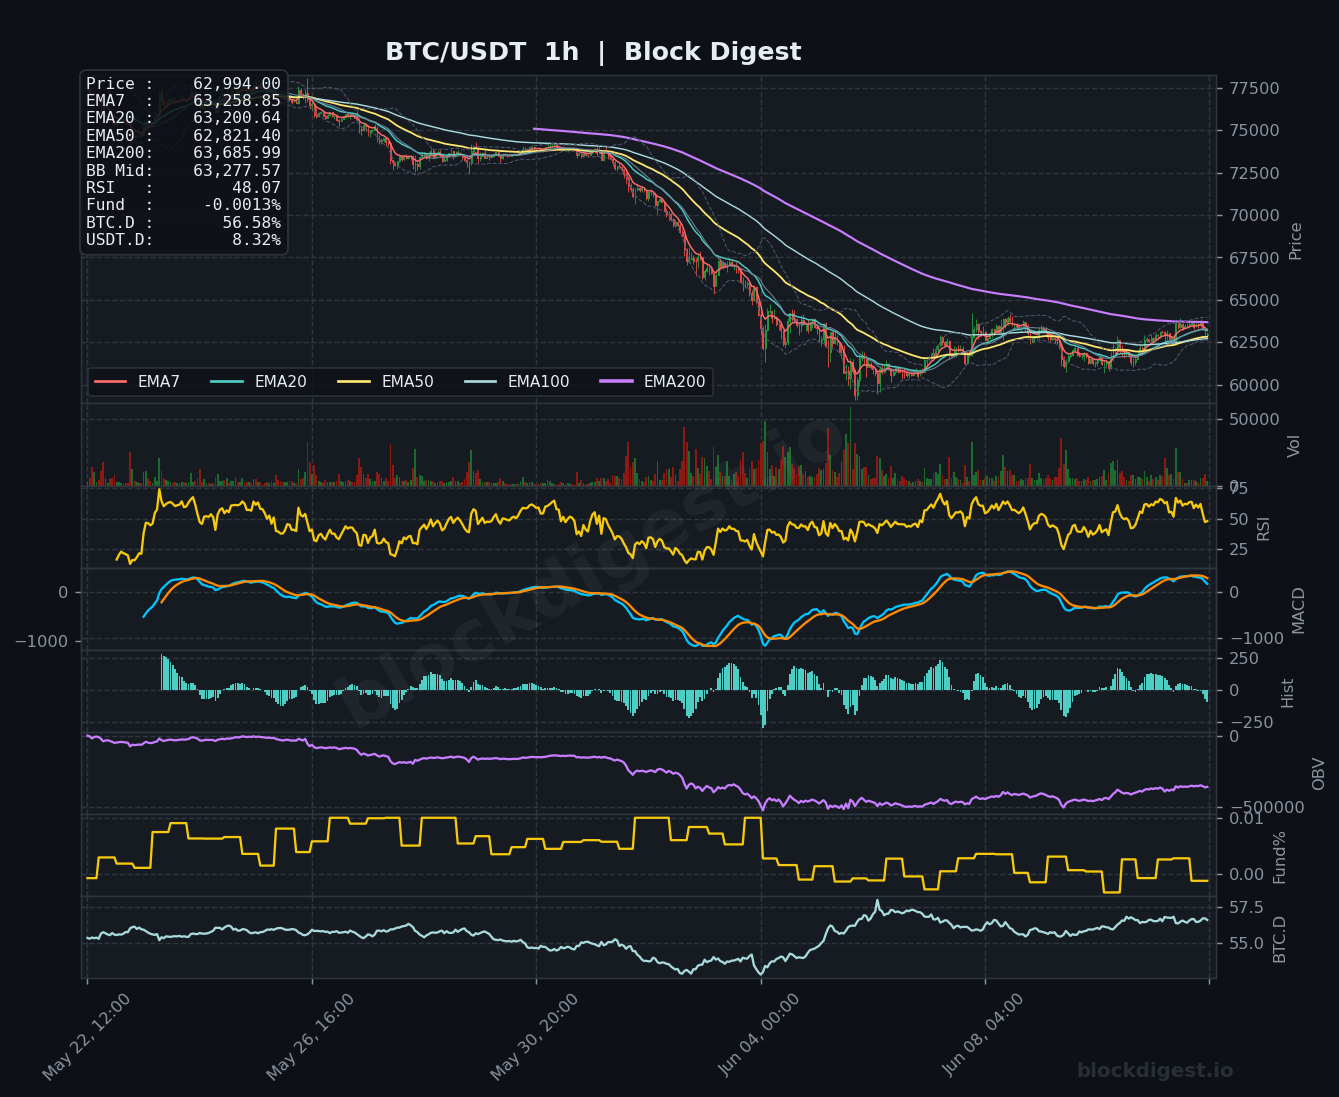
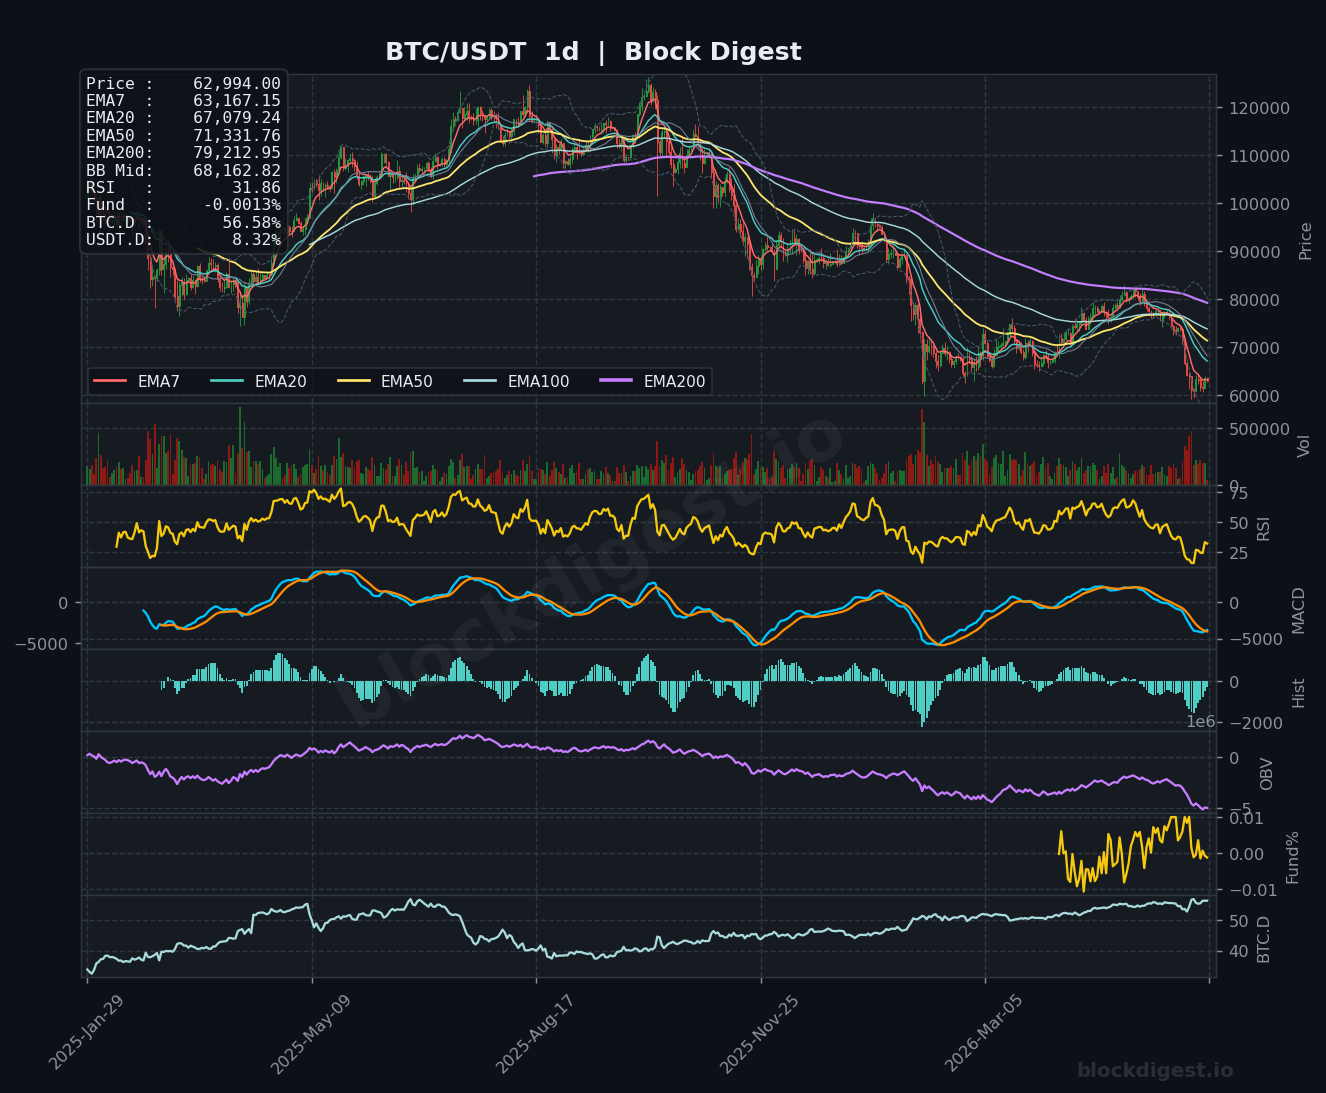
Bitcoin is currently trading at $62,994, situated in a technically precarious position as it attempts to stabilize following a prolonged multi-week decline from highs above $80,000. On the daily timeframe, price remains in a firmly bearish structure, trading well below the EMA20 ($67,079), EMA50 ($71,331), and the EMA200 ($79,212) — a complete bearish EMA stack that underscores the dominant downtrend. Price is also trading significantly below the daily Bollinger Band midline at $68,162, indicating the broader trend remains decisively bearish. The recent short-term bounce appears to be a consolidation attempt rather than a confirmed reversal, as price struggles to reclaim even the nearest dynamic resistance.
Multi-Timeframe Confluence
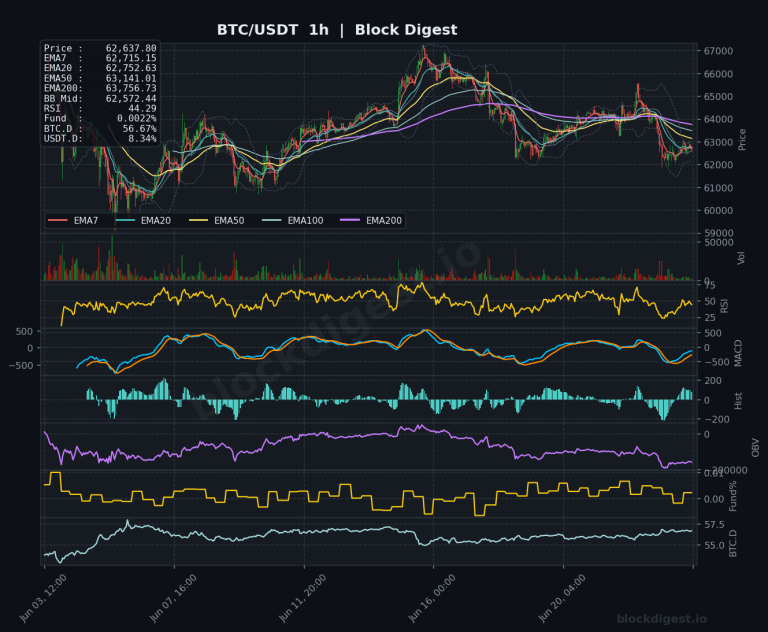
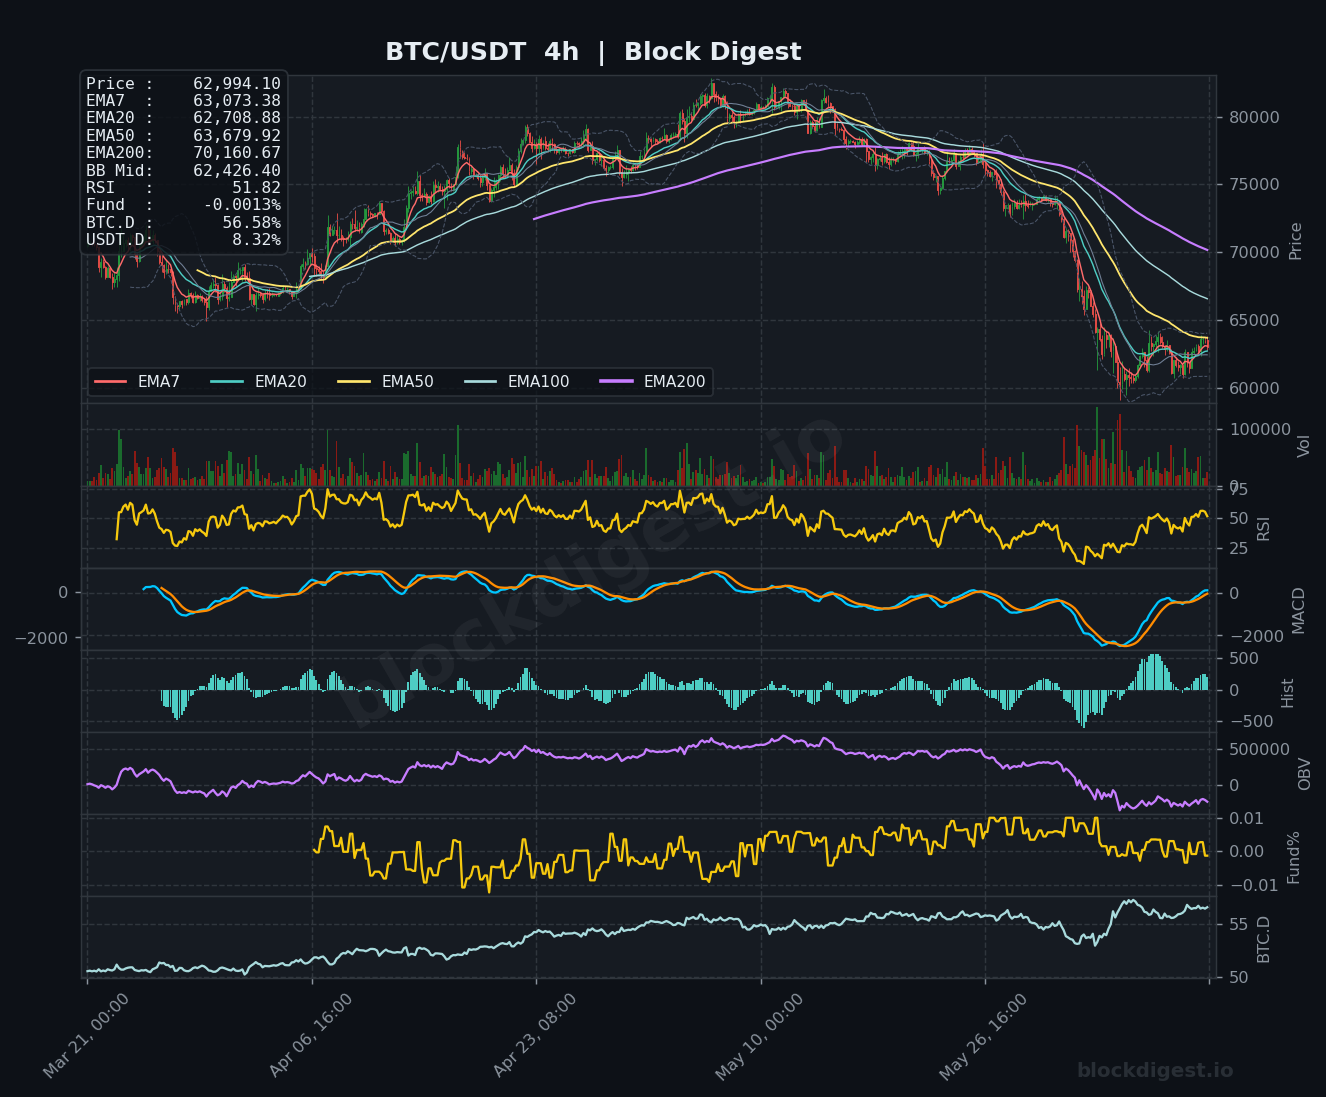
On the 1-hour chart, price is compressing tightly around the $62,800–$63,200 zone, with the short-term EMAs (EMA7 at $63,258, EMA20 at $63,200, EMA50 at $62,821) all converging — a sign of indecision following the recent sharp recovery from lows near $60,000. The 4-hour timeframe shows a nascent MACD bullish crossover attempt, with the histogram turning positive, suggesting some short-term momentum building, though price remains below the 4h EMA50 ($63,679) and the 4h EMA200 ($70,160), limiting the significance of any near-term recovery. All three timeframes share the same fundamental bearish macro narrative: price is below every major long-term EMA, and the current bounce lacks sufficient volume conviction to suggest a structural trend reversal.
Key Levels to Watch
- Resistance: $63,679 — 4h EMA50, currently acting as immediate dynamic resistance and the first real test of bullish follow-through; $65,000–$65,500 — a prior consolidation zone and psychological round number that capped price action during recent recovery attempts; $67,079 — daily EMA20, the minimum level bulls would need to reclaim to shift short-term daily structure.
- Support: $62,426 — 4h Bollinger Band midline, serving as the immediate intrabar support floor; $61,500 — recent structural low and demand zone that provided the bounce, a breach here would be technically significant; $60,000 — major psychological support and a level that, if lost, could accelerate selling pressure toward the $57,000–$58,000 range.
Momentum & On-Chain Signals
The daily RSI at 31.86 is approaching but has not yet confirmed an oversold bounce, hovering just above the critical 30 threshold — a reading that historically precedes either a relief rally or further capitulation depending on volume confirmation. On the 4-hour timeframe, the RSI has recovered to 51.82, reflecting the short-term bounce, while the 1-hour RSI sits at 48.07, suggesting neutral-to-slightly-bearish momentum near-term. The daily MACD remains deeply negative with both signal and MACD lines well below zero, and the histogram, while beginning to flatten, has not yet shown a clear bullish crossover. OBV on the daily chart is in a sustained downtrend — a significant red flag indicating persistent distribution — while the 1-hour OBV has flattened and begun a modest uptick, hinting at tentative short-term accumulation. The funding rate at -0.0013% is slightly negative, suggesting shorts are marginally dominant in perpetuals, but the level is not extreme enough to trigger a significant short squeeze.
BTC Dominance & Market Sentiment
BTC dominance sits at 56.58%, a notably elevated reading that reflects a continued flight to relative safety within the crypto ecosystem — altcoins are underperforming significantly as capital consolidates into Bitcoin. USDT dominance at 8.32% indicates a meaningful proportion of market participants remain in stablecoins, consistent with the Binance USDT Reserve signal flagging consolidation rather than active recovery deployment. Together, these readings paint a picture of a risk-off environment where broader altcoin exposure is being avoided and dry powder has not yet rotated aggressively back into BTC.
Risk Scenarios
- Bullish case: A decisive 4-hour close above $63,679 (4h EMA50) followed by volume expansion could target the $65,000–$65,500 resistance zone, with a sustained hold above $65,500 opening a path toward the daily EMA20 at $67,079. Confirmation would require daily RSI reclaiming 40+ and OBV beginning an upward inflection on the daily chart.
- Bearish case: Failure to hold the $62,426 BB midline on the 4-hour and a break below the $61,500 structural low would signal the bounce is exhausted, targeting a retest of $60,000 and potentially $57,500–$58,000 below that. A daily close below $61,500 with negative OBV continuation would strongly reinforce the bearish thesis.
Outlook
The near-term bias is cautiously neutral with a bearish tilt, as the short-term bounce from $60,000 lows remains unconfirmed by volume or higher-timeframe momentum shifts, and the dominant daily structure continues to favour sellers. The critical trigger to watch over the next 24–48 hours is whether BTC can claim and hold the $63,679 level on a 4-hour closing basis — failure here would likely result in another retest of the $61,500–$62,000 support band. Macro sentiment, including any Federal Reserve commentary or CPI-related headlines, could act as a sharp catalyst in either direction given the compressed price action. Until the daily EMA20 ($67,079) is reclaimed with conviction, any rallies should be approached with caution and treated as potential relief bounces within a broader corrective structure.
Disclaimer: This analysis is for informational purposes only and does not constitute financial advice. Cryptocurrency markets are highly volatile and unpredictable. All trading decisions should be made based on your own research and risk tolerance. Block Digest is not responsible for any financial losses incurred as a result of acting on this content.