Altcoin Daily Analysis: Bitcoin dominance 56.37%, altcoins face sustained drawdowns
Market Context
The broader altcoin market is navigating a challenging environment as Bitcoin dominance sits at 56.37%, reflecting continued capital concentration in BTC at the expense of altcoin performance. USDT dominance at 8.28% signals that a meaningful portion of sidelined capital remains in stablecoins, indicating cautious risk appetite rather than aggressive rotation into alts. The majority of the assets reviewed have experienced sustained drawdowns from recent highs, suggesting the altcoin market is in a corrective phase with no clear broad-based recovery signal yet in play.
Solana (SOL)
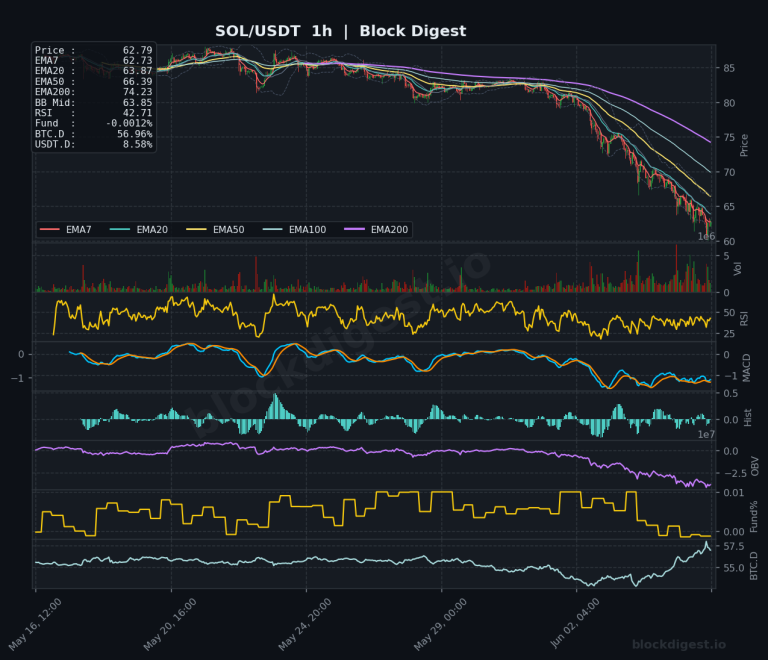
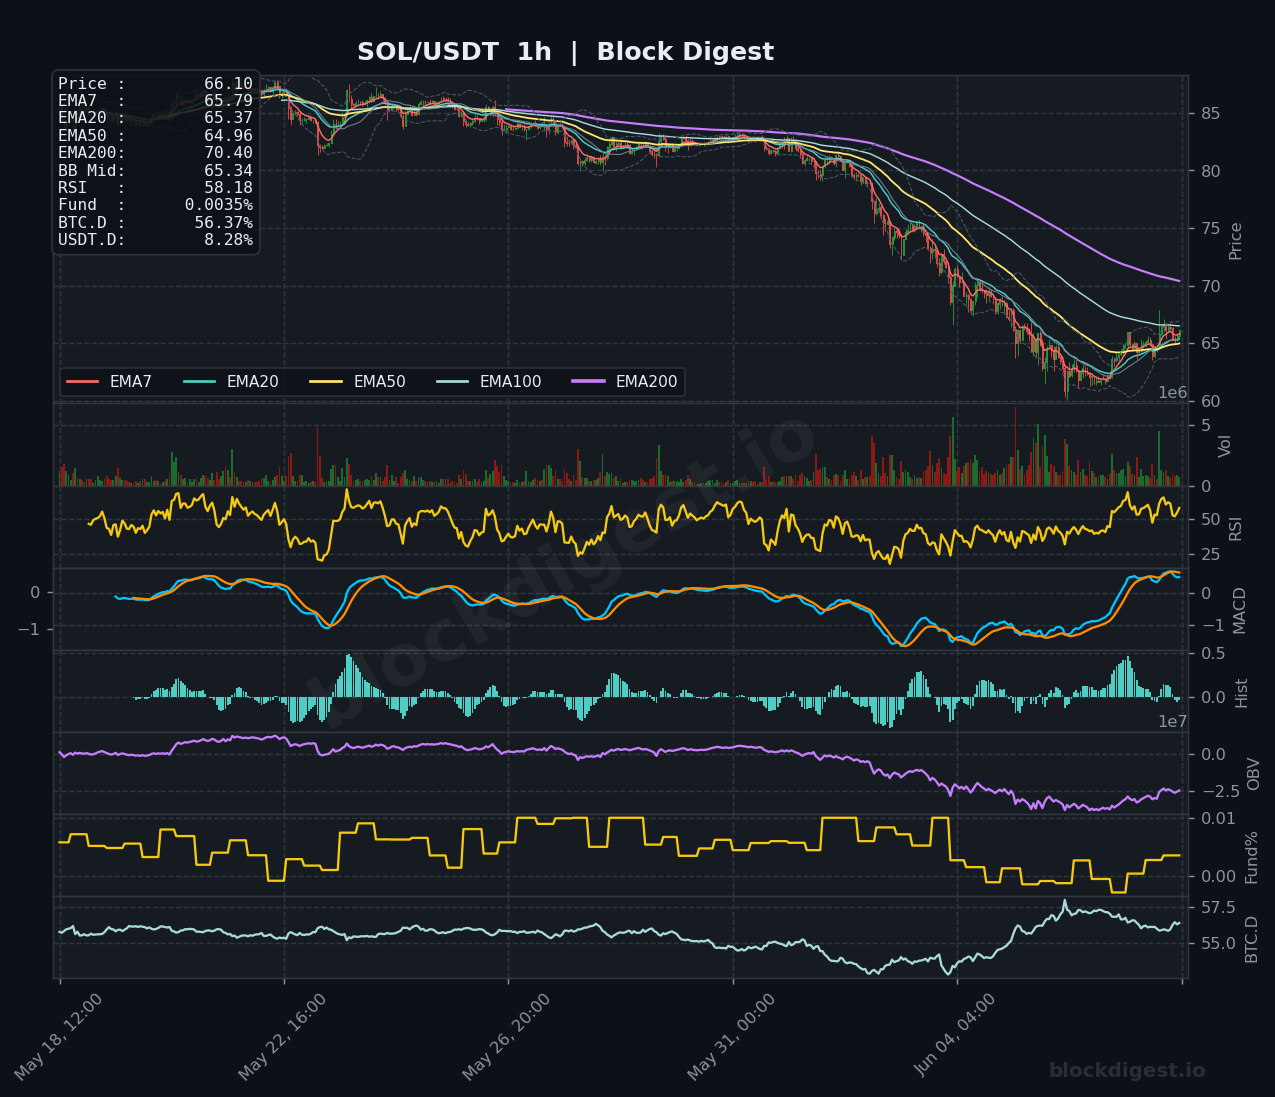
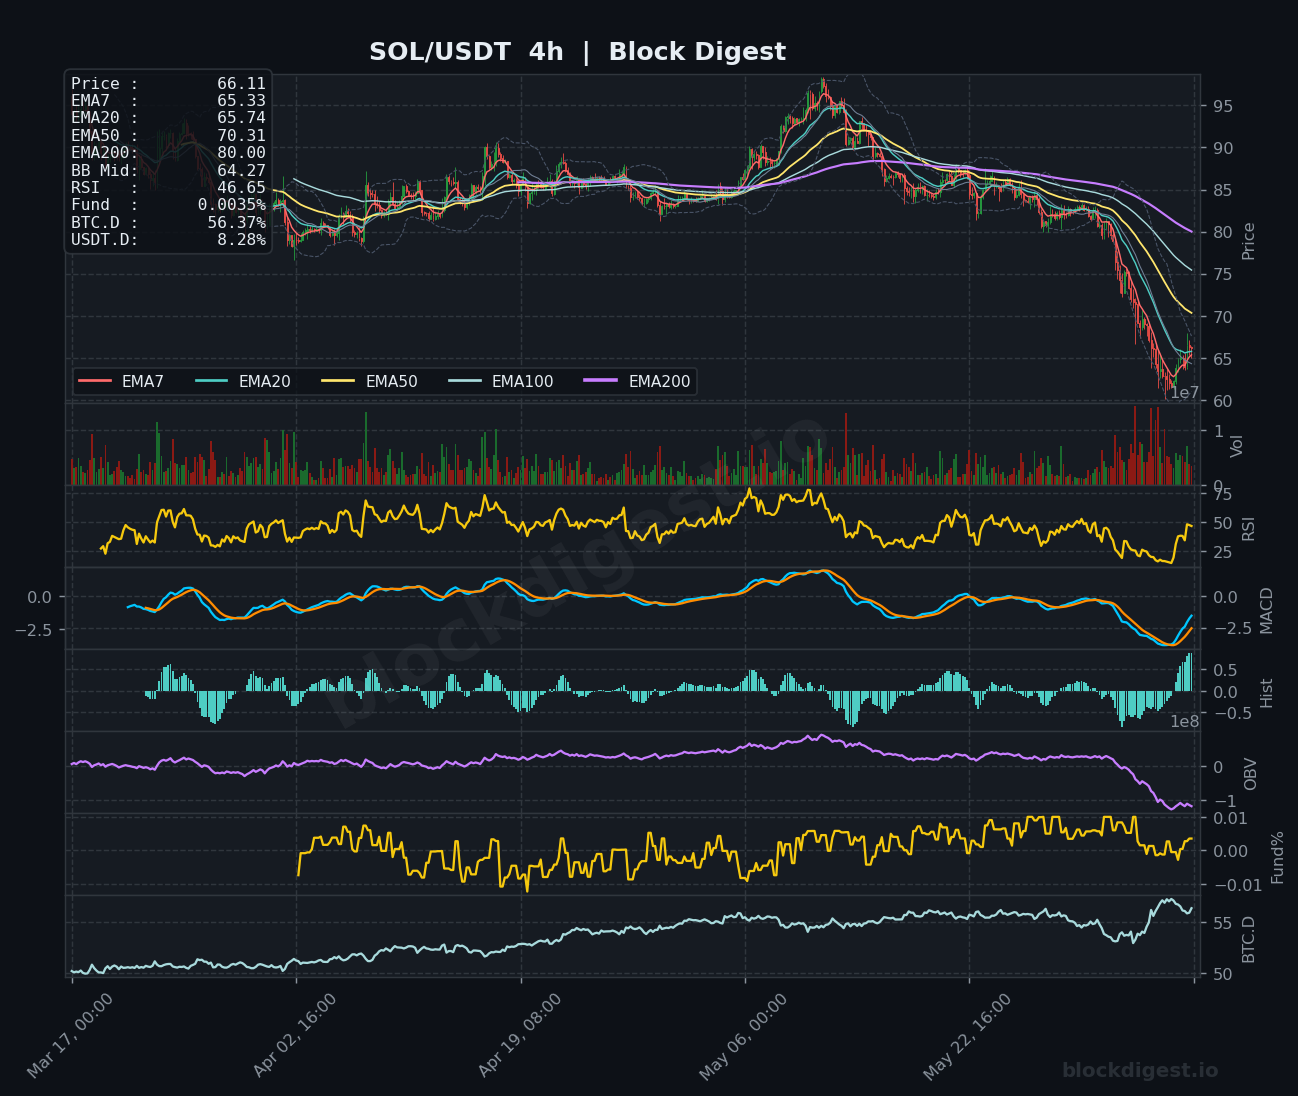
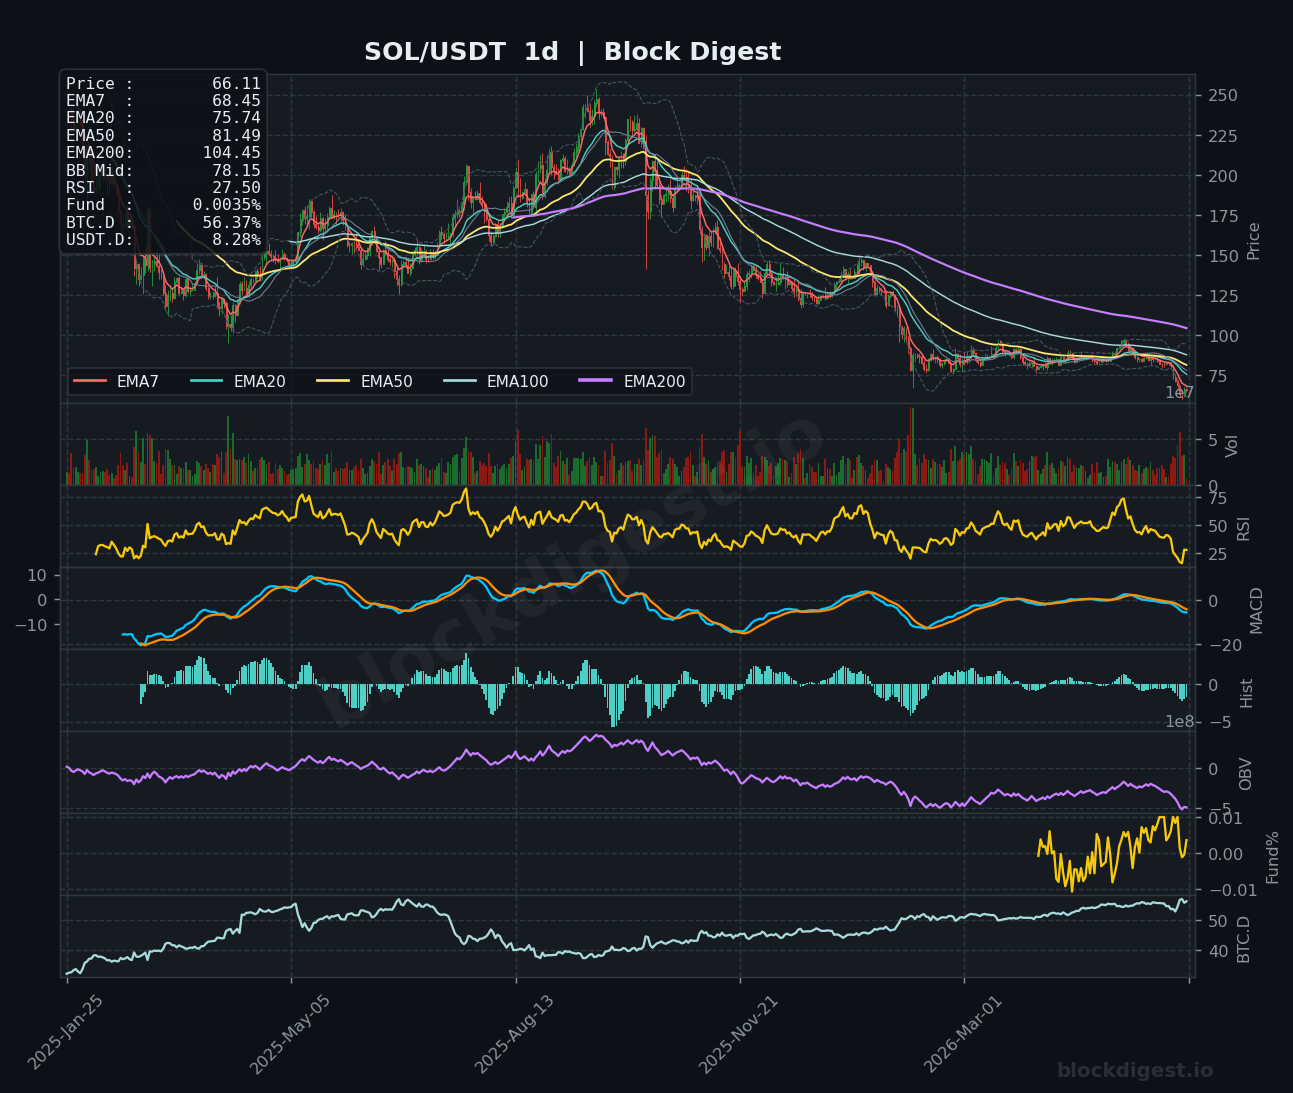
SOL is trading at $66.11, having staged a tentative bounce from lows near $62–63 after a prolonged downtrend that saw price fall from above $95. On the 1h chart, the short-term EMAs (EMA7 at $65.79, EMA20 at $65.37) are beginning to realign, with RSI at 58.18 showing recovering momentum, while the 1h MACD is curling bullishly. However, the 4h RSI at 46.65 and a deeply negative MACD signal that intermediate-term pressure remains, with all EMAs stacked bearishly and price sitting well below the 4h EMA200 at $80.00. The daily RSI at 27.50 places SOL in oversold territory, offering a potential mean-reversion setup, but the daily EMA structure — with price far beneath the EMA7 ($68.45), EMA20 ($75.74), and EMA50 ($81.49) — confirms the dominant trend is still bearish; bulls need a reclaim of $68–$70 to build conviction.
XRP (XRP)
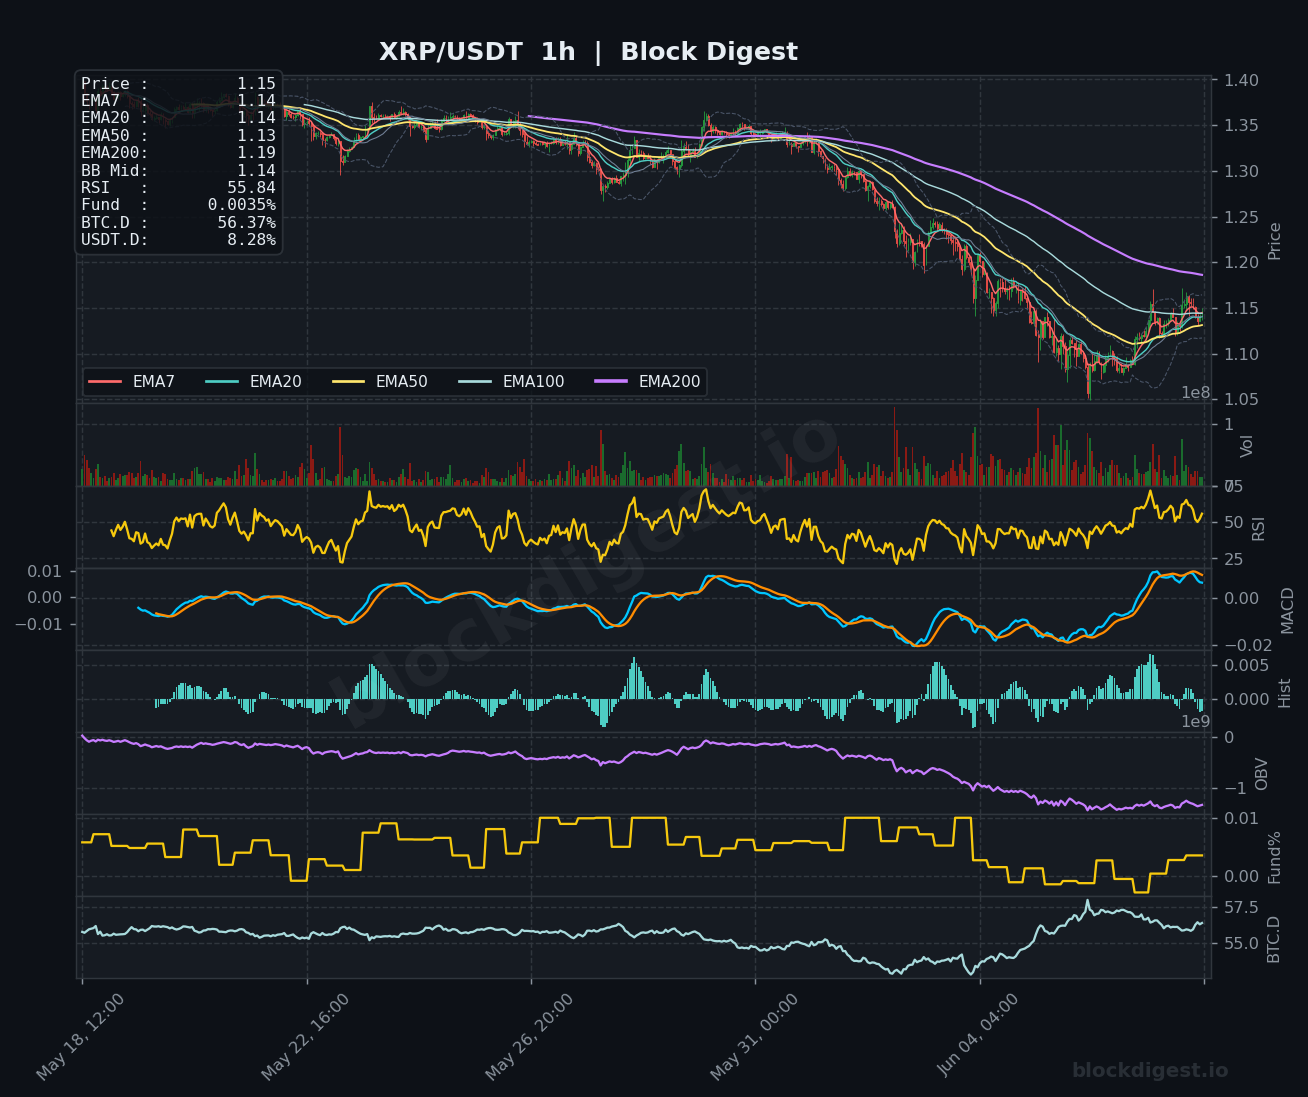
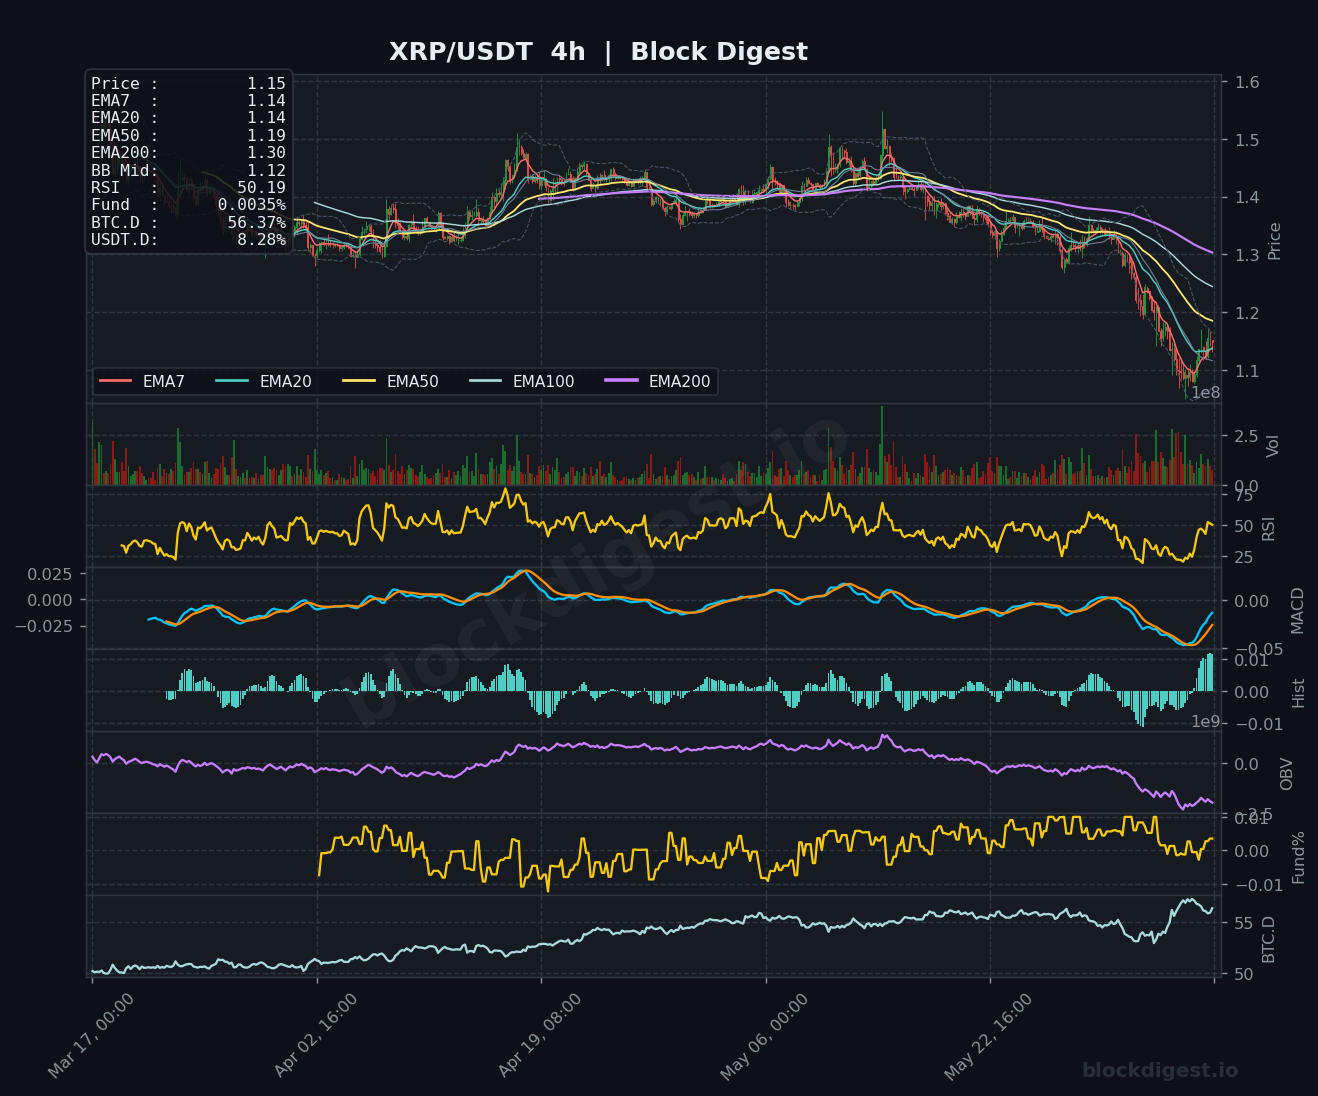
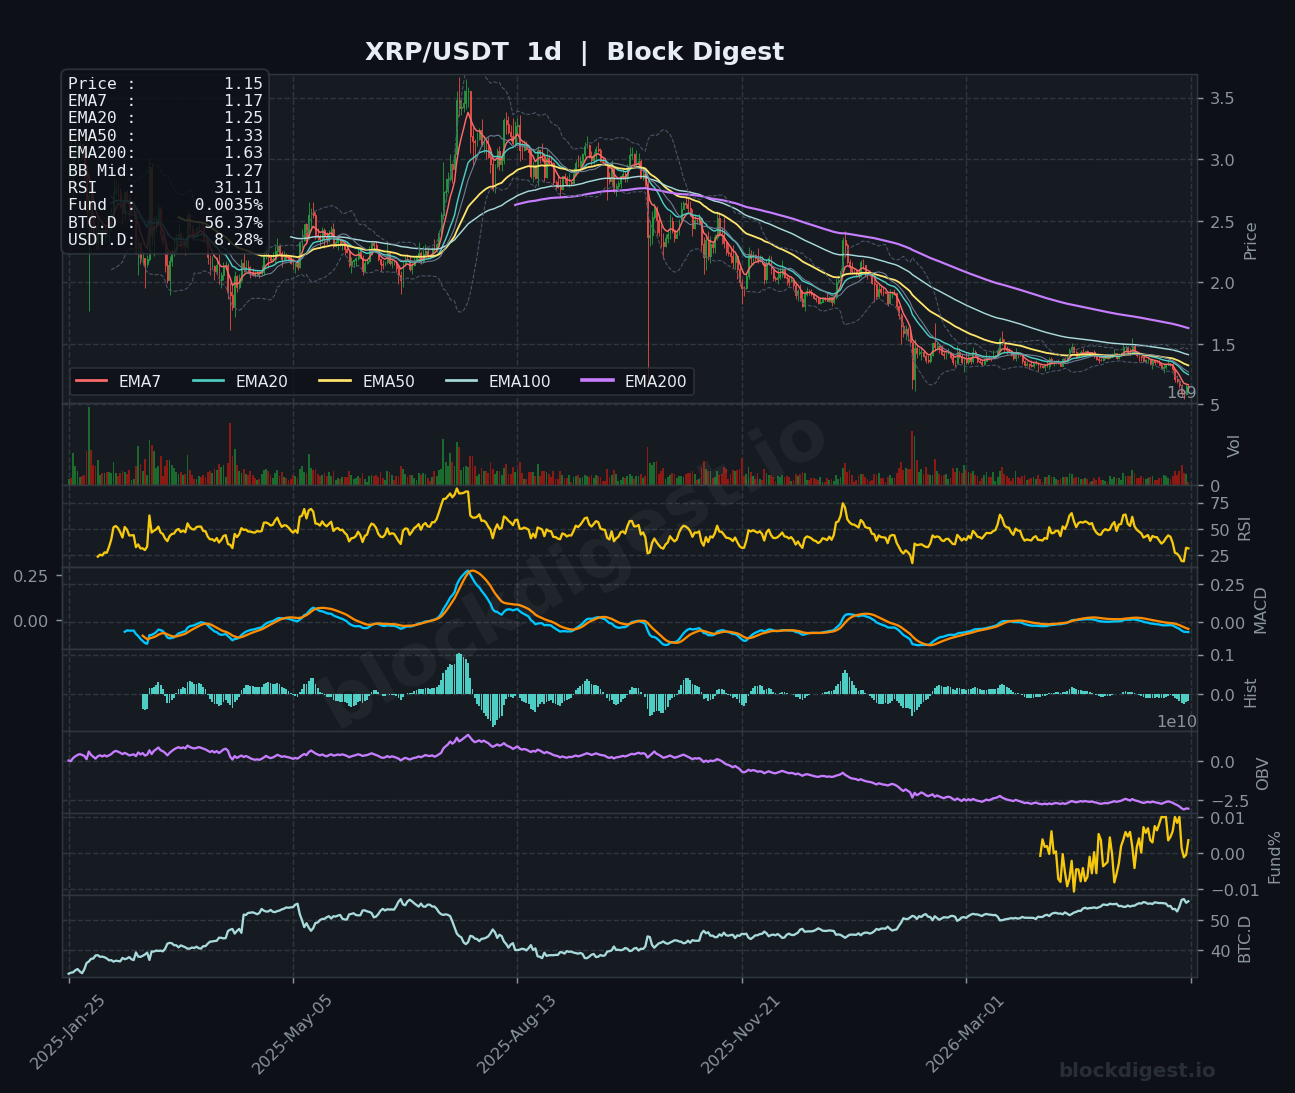
XRP is trading at $1.15, consolidating near multi-month lows after a significant decline from highs above $3.00. The 1h chart shows some stabilization with RSI at 55.84 and a MACD that has turned positive, suggesting short-term buying interest, and price is holding fractionally above the EMA cluster (EMA7 $1.14, EMA20 $1.14, EMA50 $1.13). On the 4h timeframe, RSI sits at 50.19 — neutral — while MACD remains in negative territory with OBV trending lower, confirming that any near-term relief rally lacks strong conviction. The daily chart is the most concerning, with RSI at 31.11 approaching oversold and price trading beneath all major EMAs including the EMA200 at $1.63; immediate resistance sits at $1.20–$1.25 (daily EMA20), and a failure to recover this zone keeps the short-term bias bearish to neutral.
BNB (BNB)
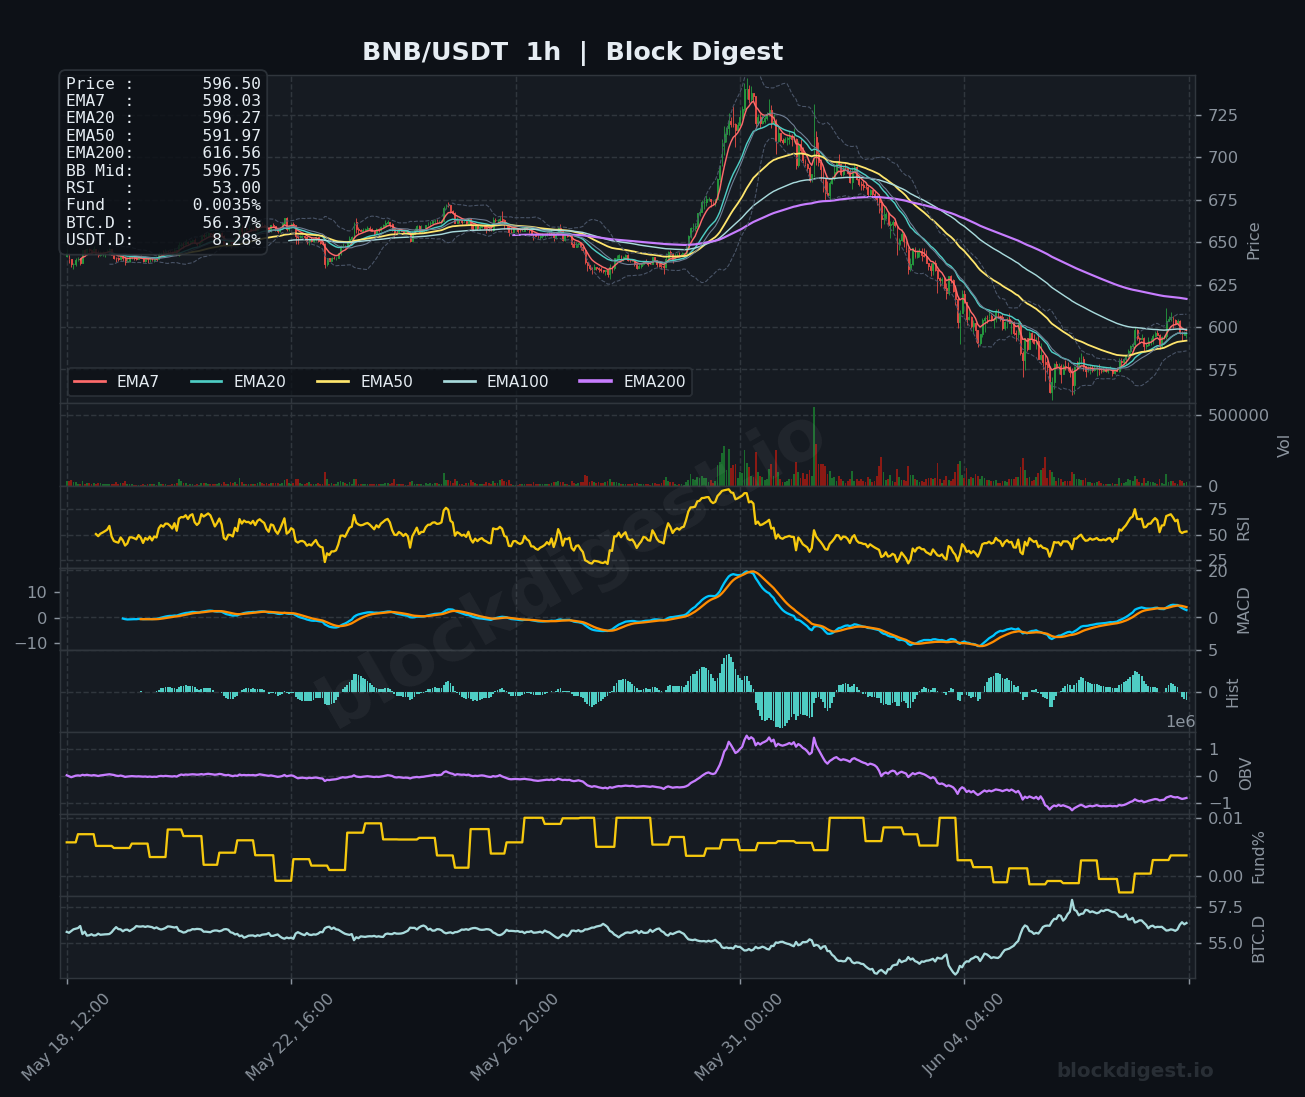
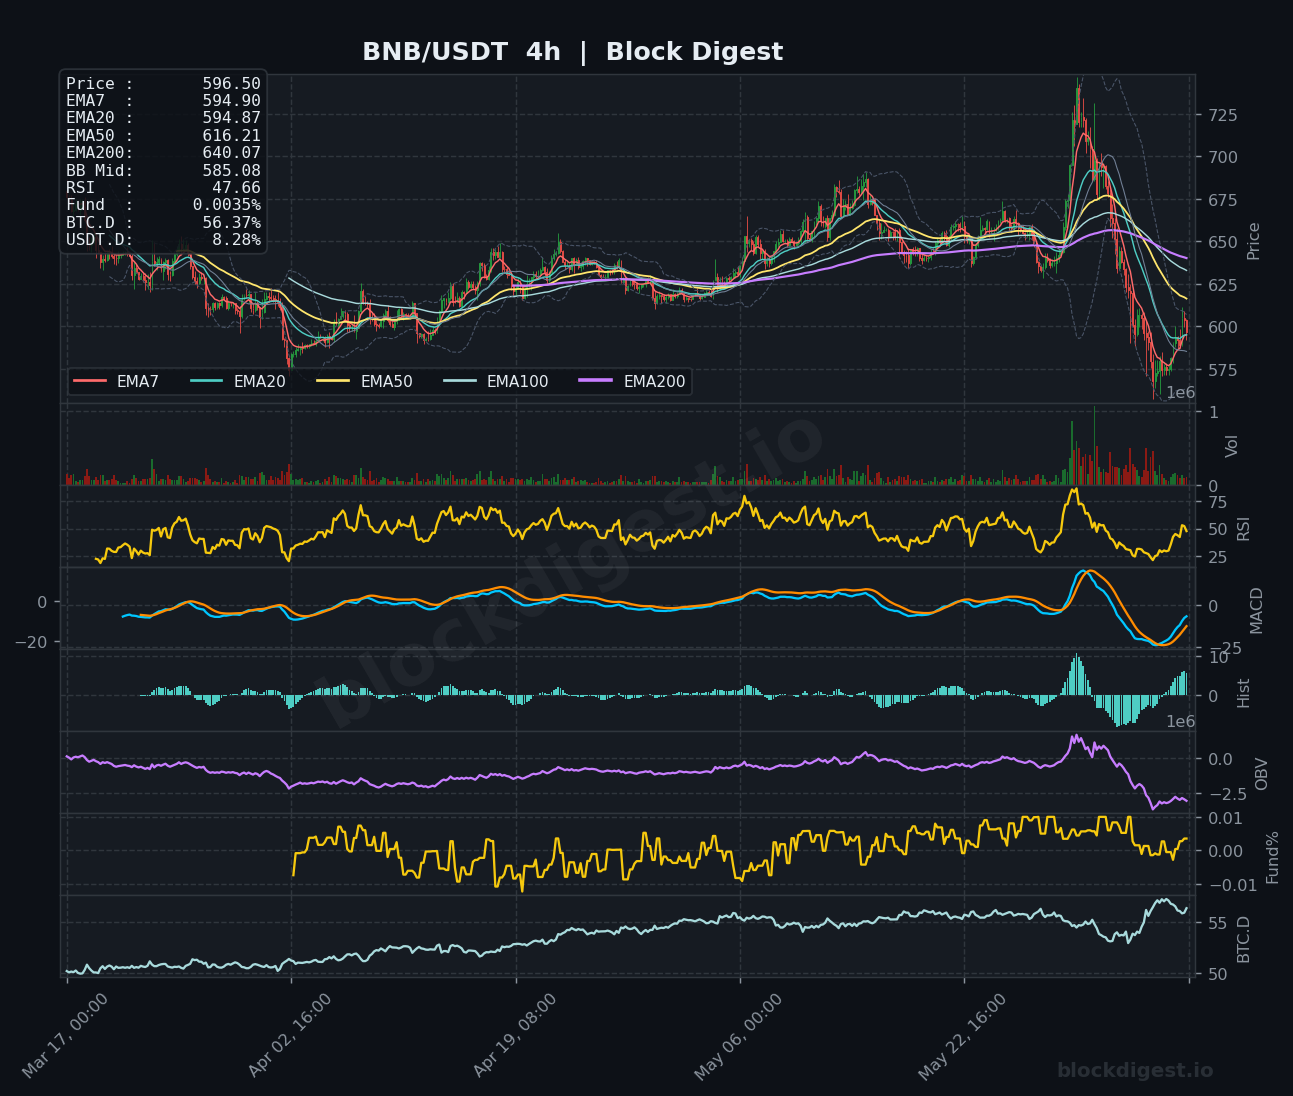
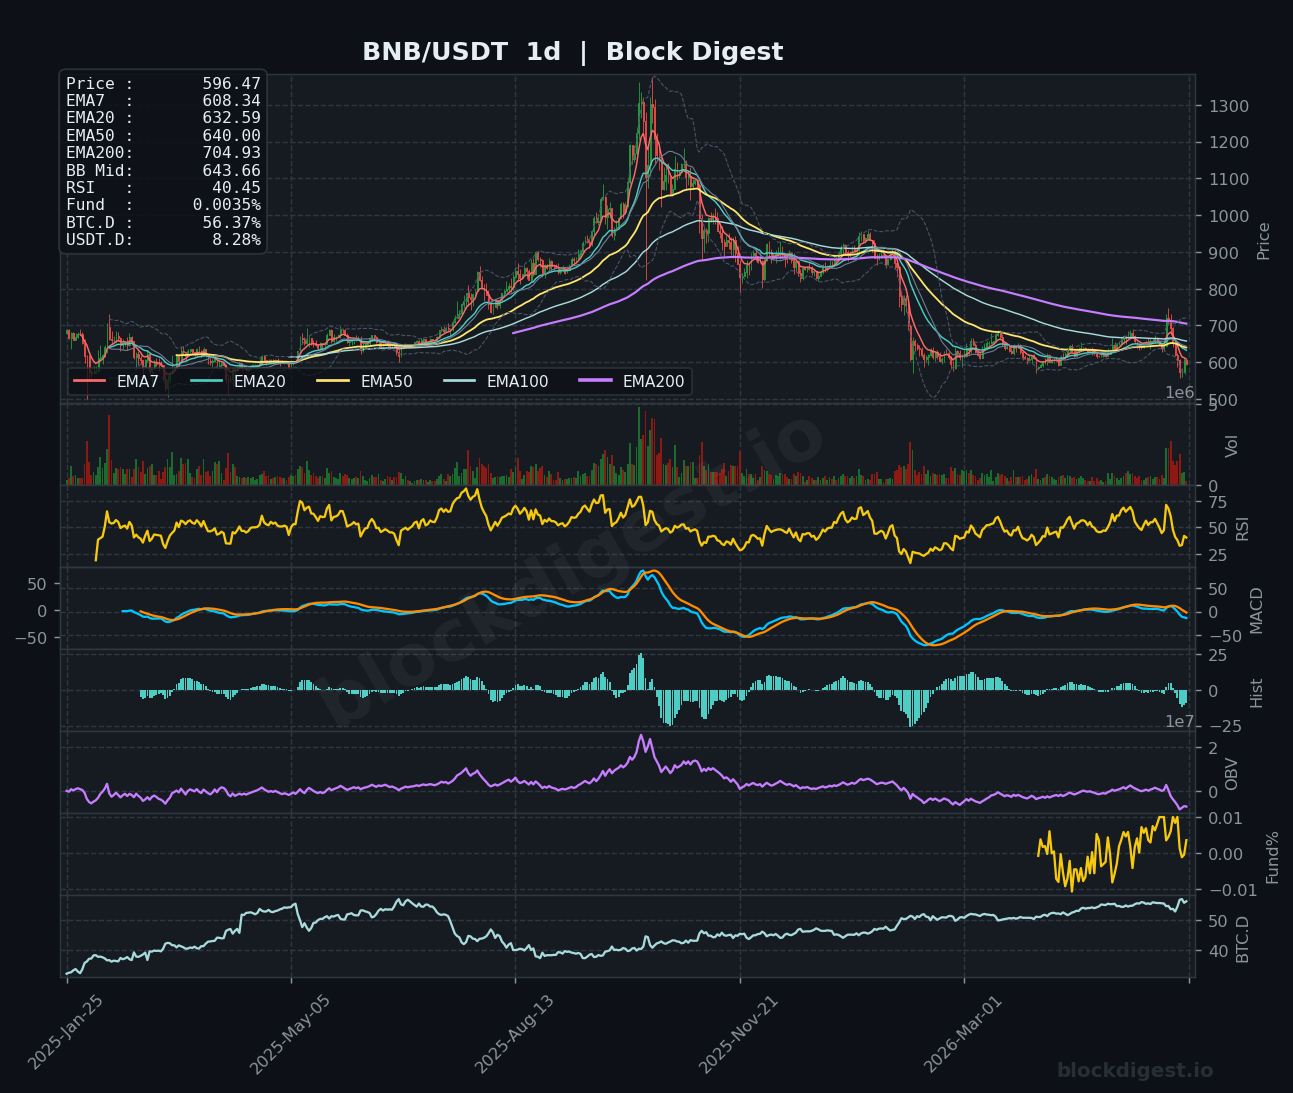
BNB is trading at $596.50, attempting to stabilize after dropping from highs near $725 and finding tentative footing in the $575–$600 range. The 1h chart is the most constructive of the group, with RSI at 53.00 and price sitting just above the 1h EMA cluster (EMA7 $598, EMA20 $596, EMA50 $592), while the MACD is showing a mild positive cross. The 4h RSI at 47.66 and a still-negative MACD indicate intermediate-term selling pressure persists, with the 4h EMA50 at $616.21 and EMA200 at $640.07 acting as significant overhead resistance. On the daily chart, RSI at 40.45 and a bearish MACD with declining OBV confirm BNB’s macro downtrend remains intact; the $580 level is immediate support, and bulls need a sustained close above $615 to shift the near-term bias.
Dogecoin (DOGE)
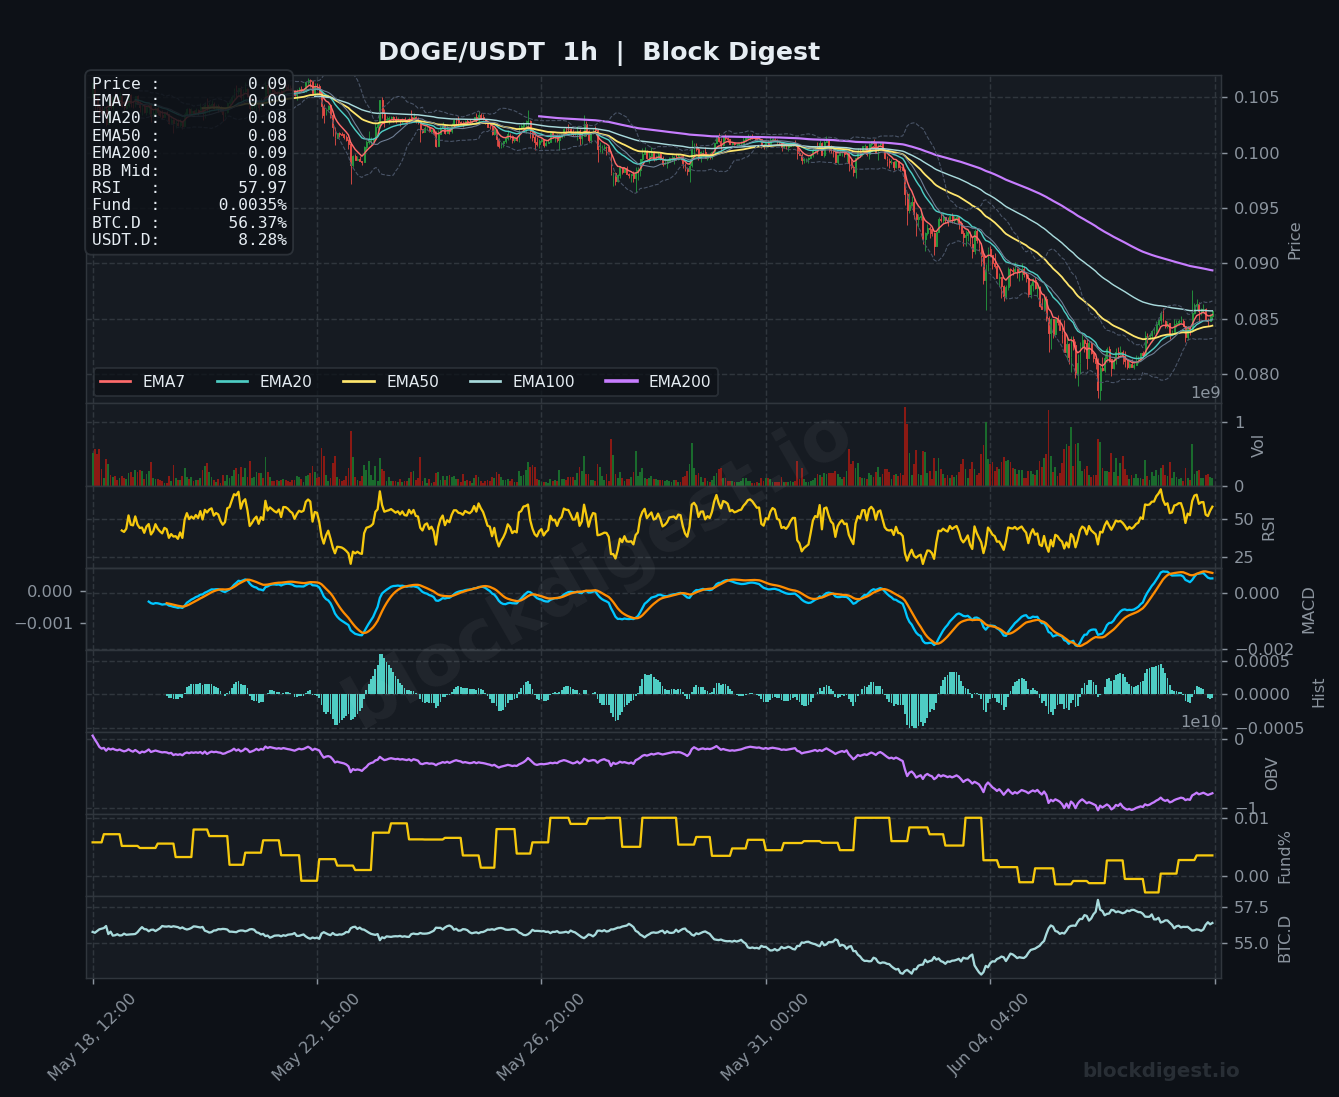
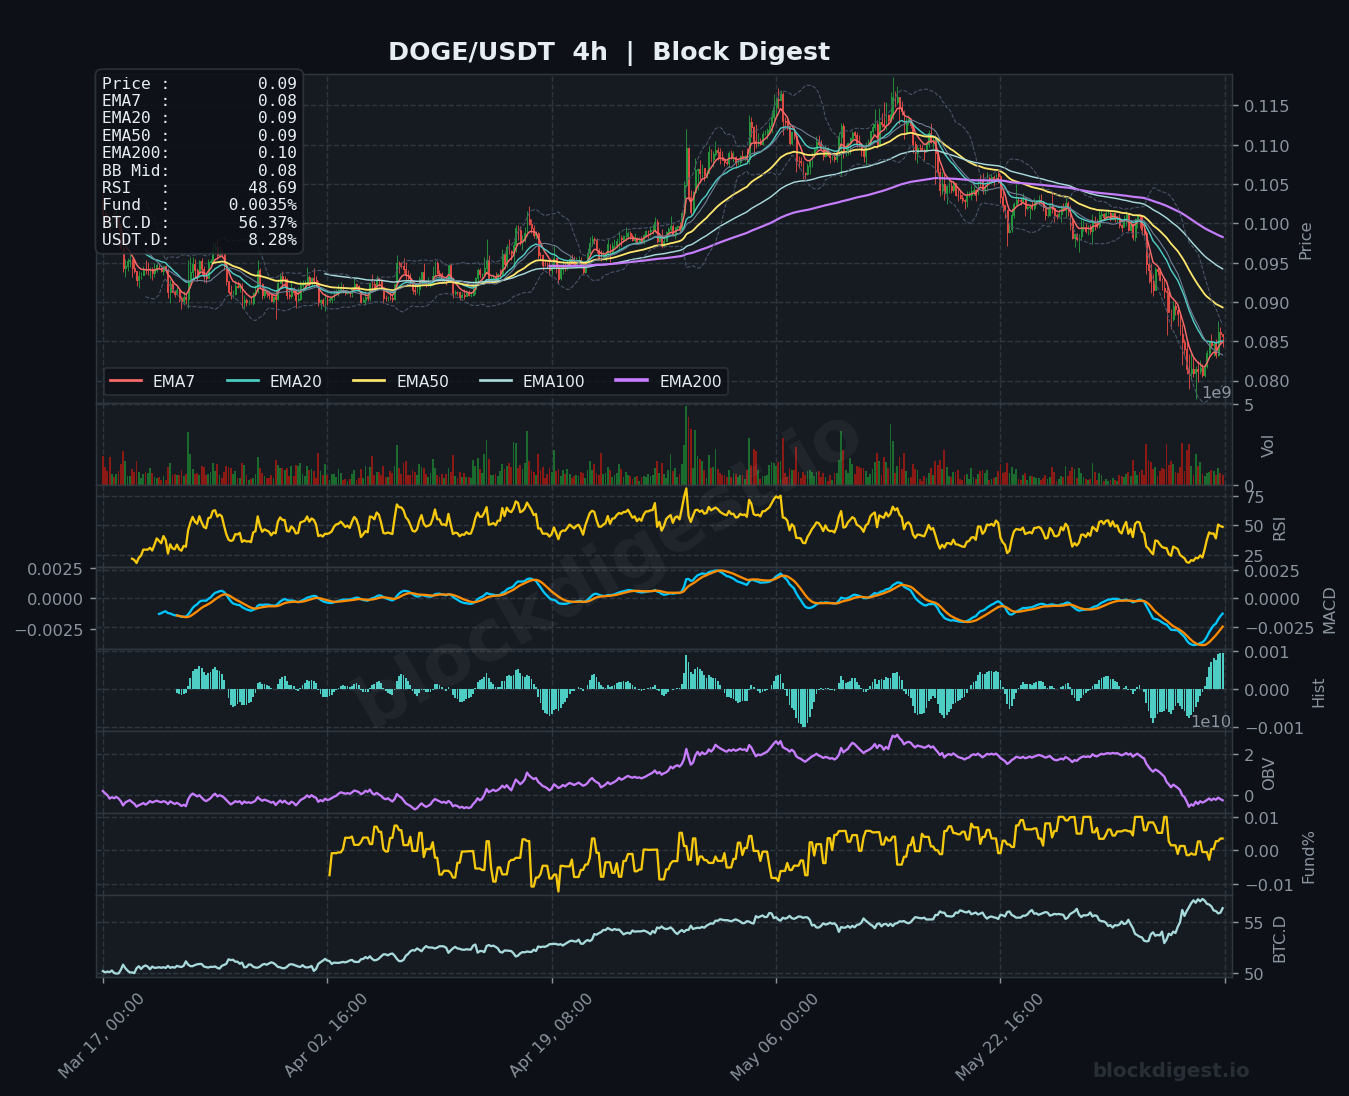
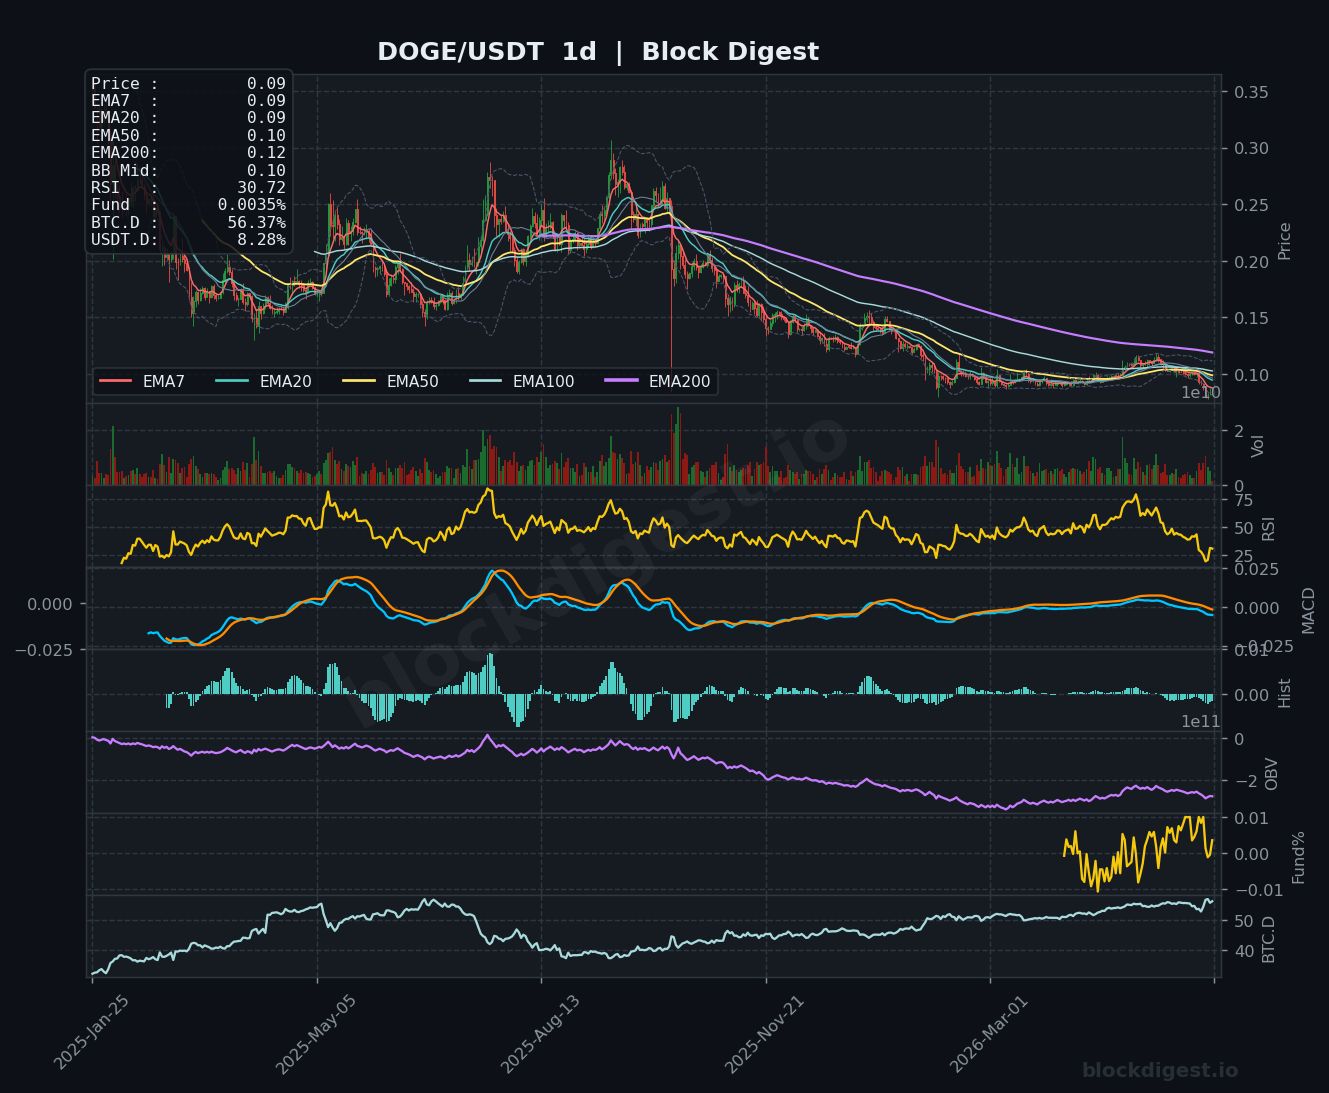
DOGE is trading at $0.09, pressing against a key psychological level after a steep decline from highs above $0.115. The 1h chart shows RSI recovering to 57.97 with a MACD that has crossed into positive territory, suggesting short-term momentum is shifting; price has bounced from lows near $0.080 and is testing the EMA cluster. However, on the 4h timeframe, RSI at 48.69 and a negative MACD with the MACD line still below the signal line indicate that intermediate recovery remains unconvincing. The daily chart paints a clearly bearish picture with RSI at 30.72 approaching oversold, price below all EMAs (EMA50 at $0.10, EMA200 at $0.12), and OBV in a sustained decline; the $0.085–$0.090 zone is critical near-term support, and a breakdown below $0.080 would open the door to deeper losses.
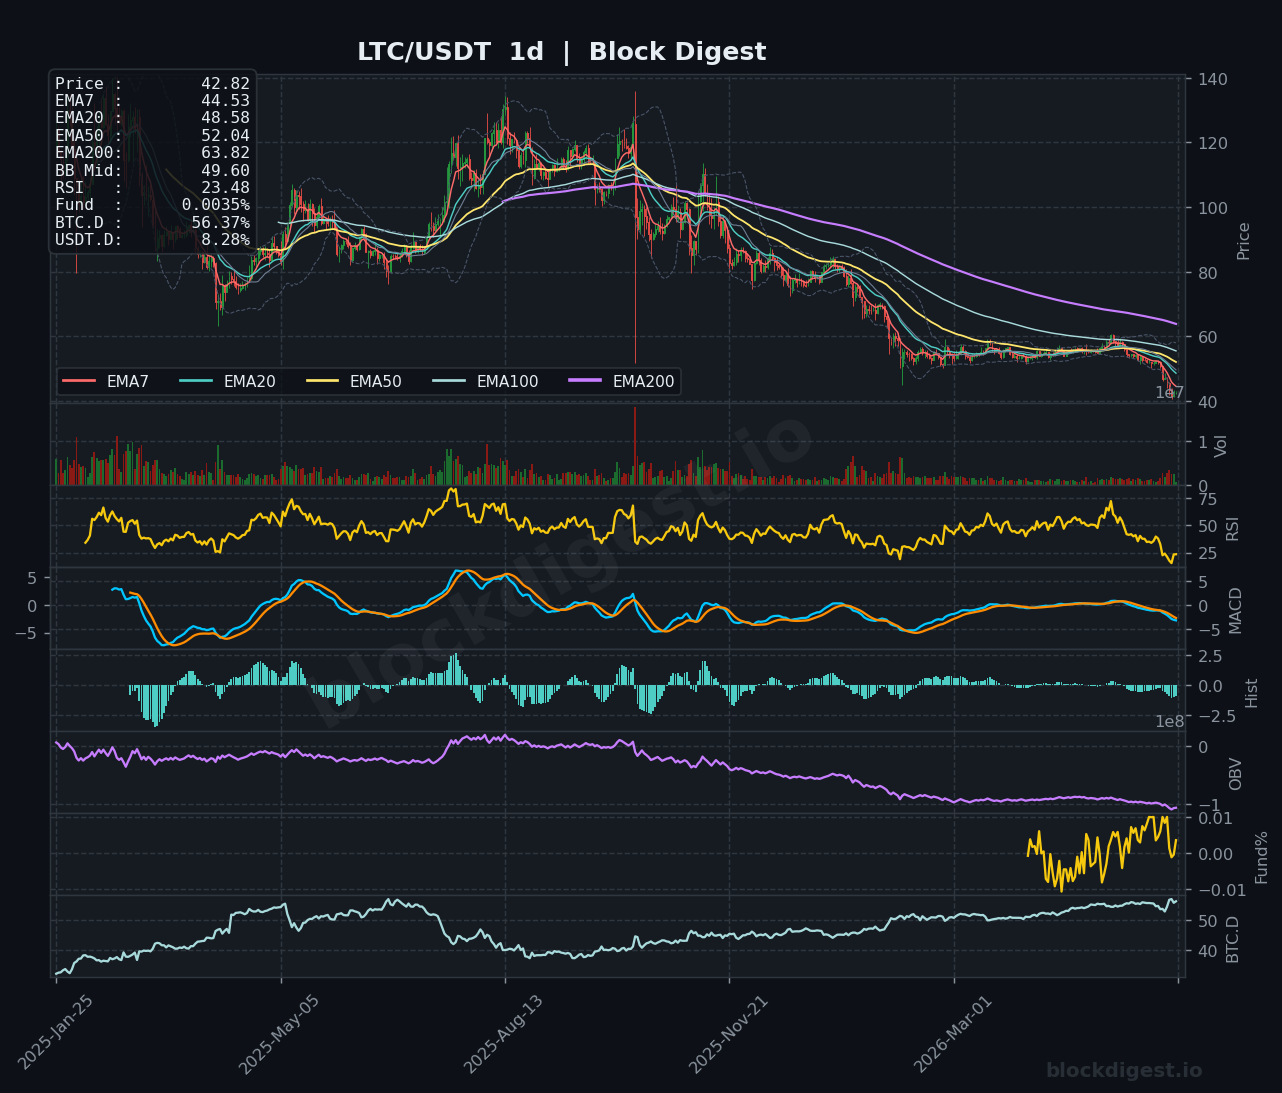
Litecoin (LTC)
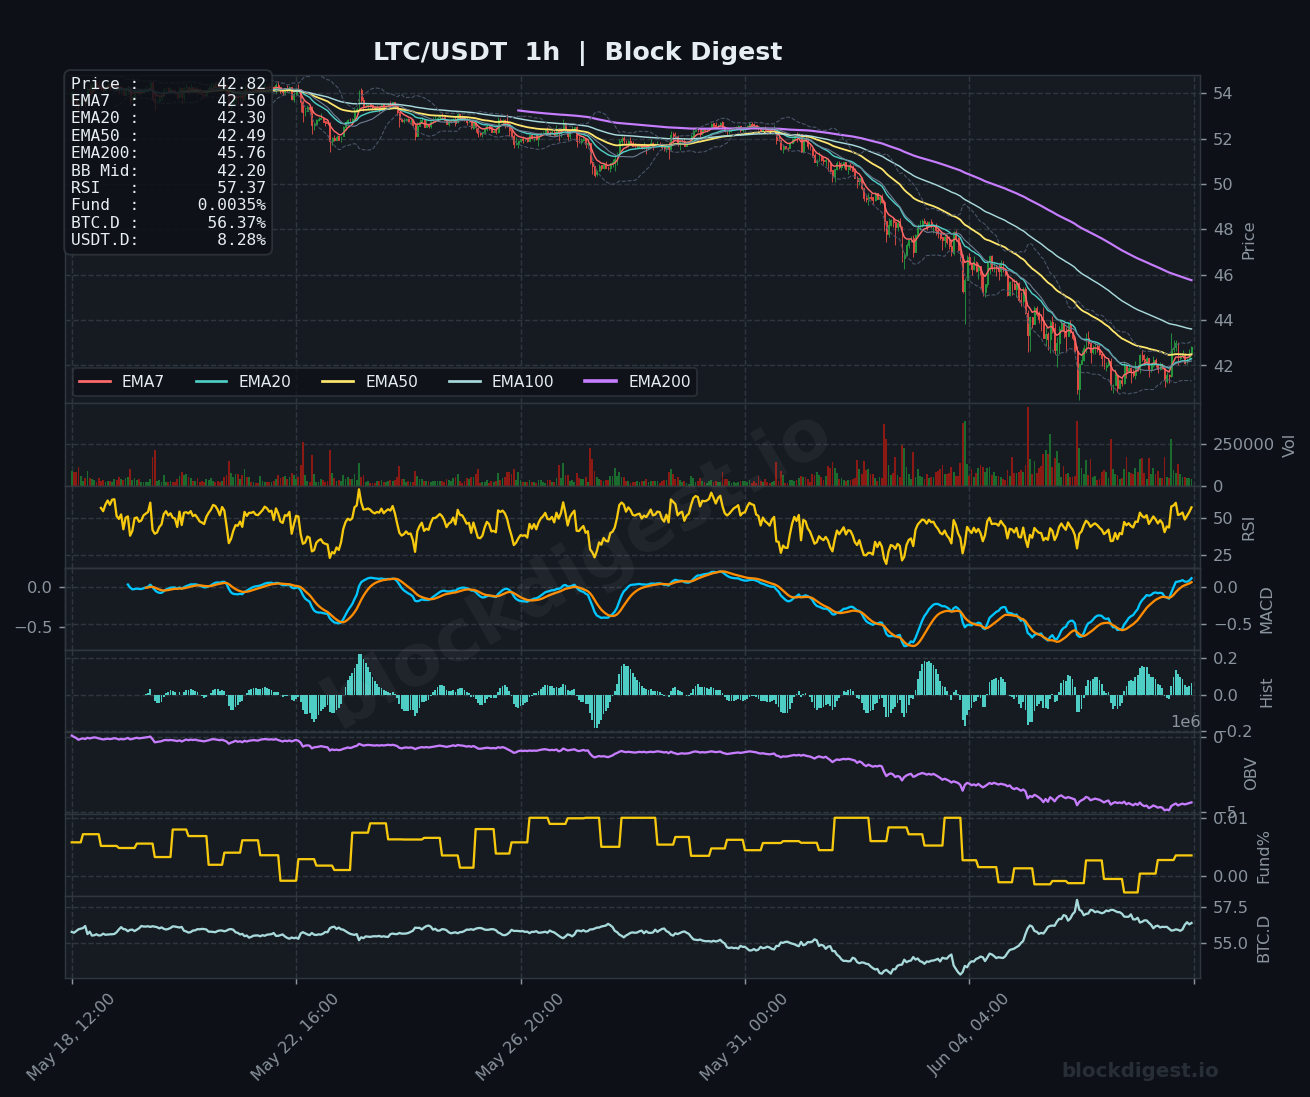
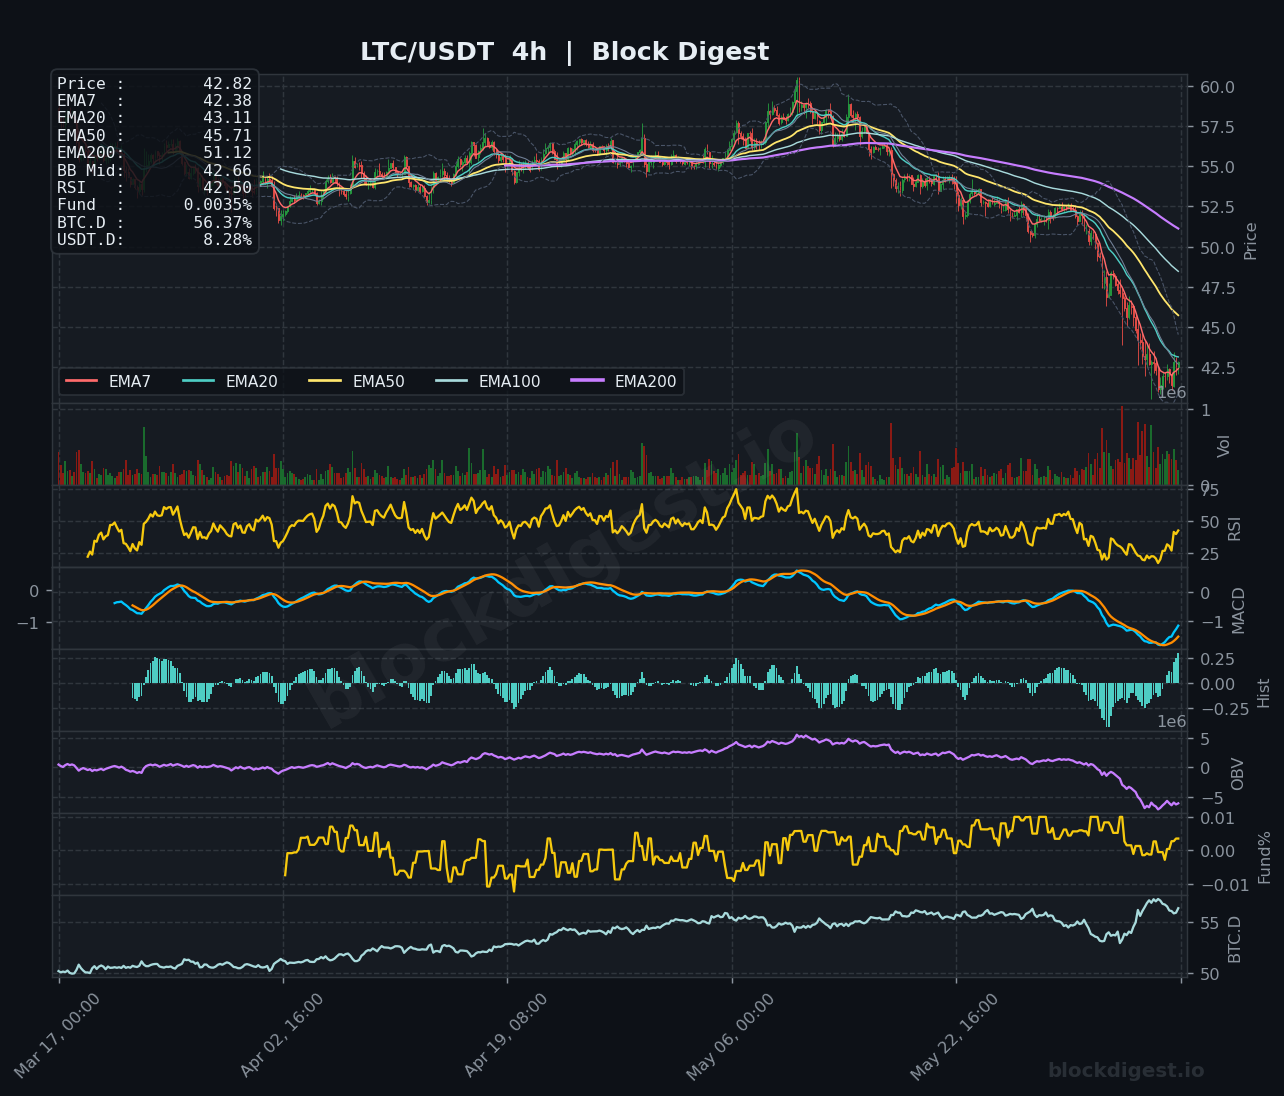
LTC is trading at $42.82, one of the weakest setups in this review, hitting multi-year lows after a collapse from highs above $60. The 1h chart shows RSI at 57.37 with a recovering MACD, and price is attempting to stabilize near the short-term EMA cluster (EMA7 $42.50, EMA20 $42.30), but all EMAs remain in a steep bearish cascade. The 4h RSI at 42.50 and a heavily negative MACD (signal line diverging lower) confirm that selling pressure is dominant on the intermediate timeframe, with OBV declining sharply. The daily chart is the most alarming, with RSI at 23.48 — deeply oversold — and price printing well below all major EMAs (EMA20 $48.58, EMA50 $52.04, EMA200 $63.82), suggesting structural weakness; while extreme oversold readings could invite a technical bounce, the trend bias remains firmly bearish until at least the $45–$47 zone is recaptured.
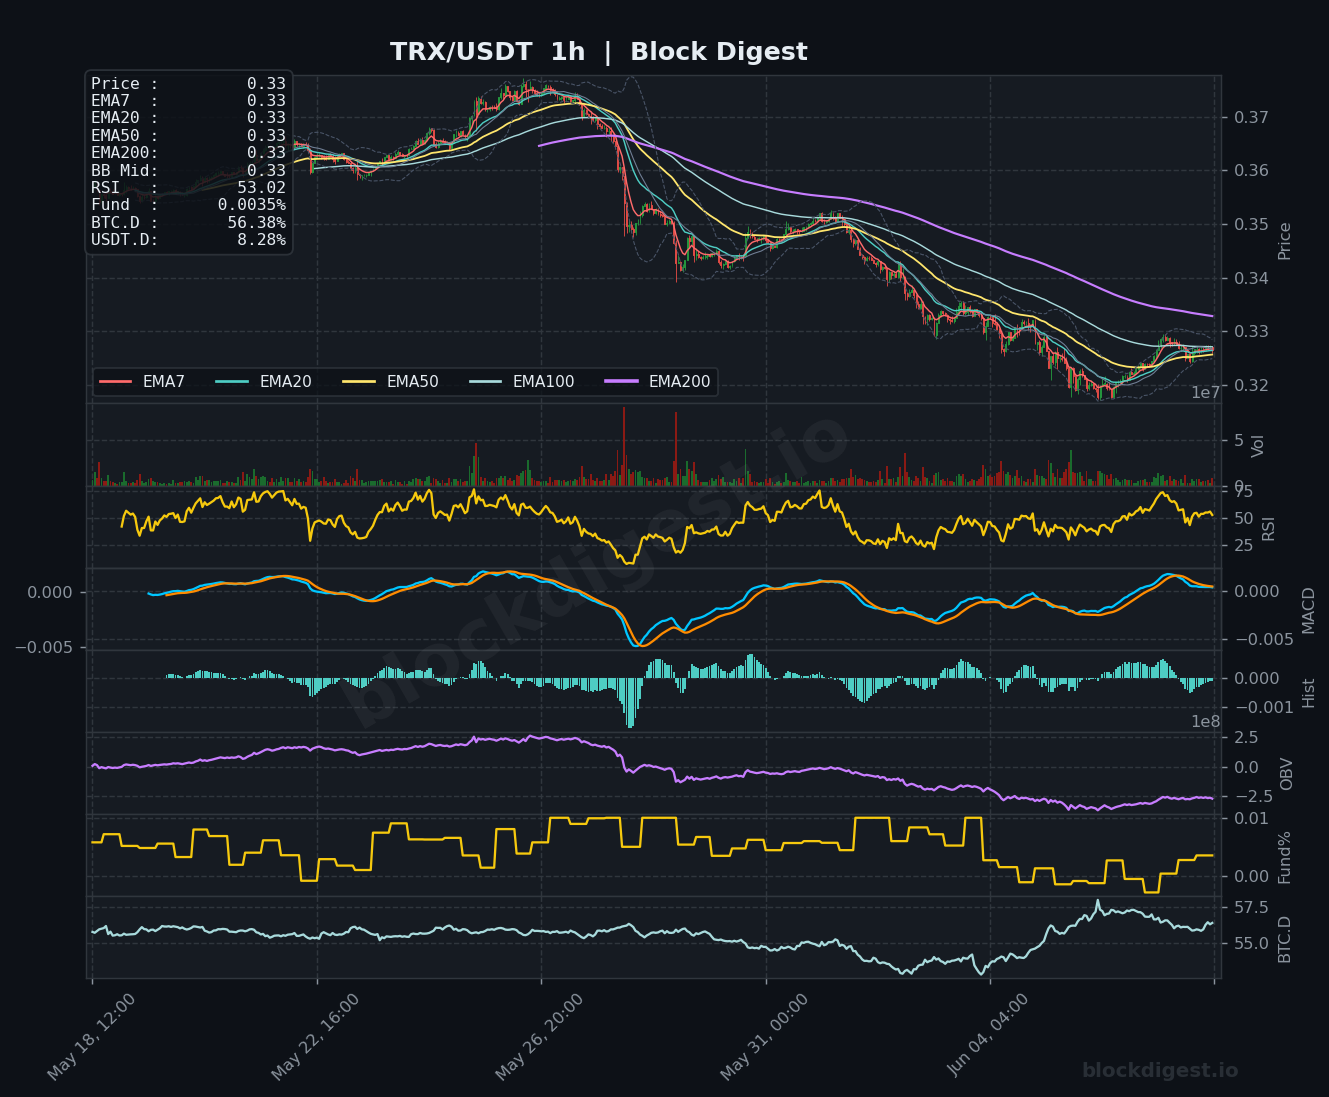
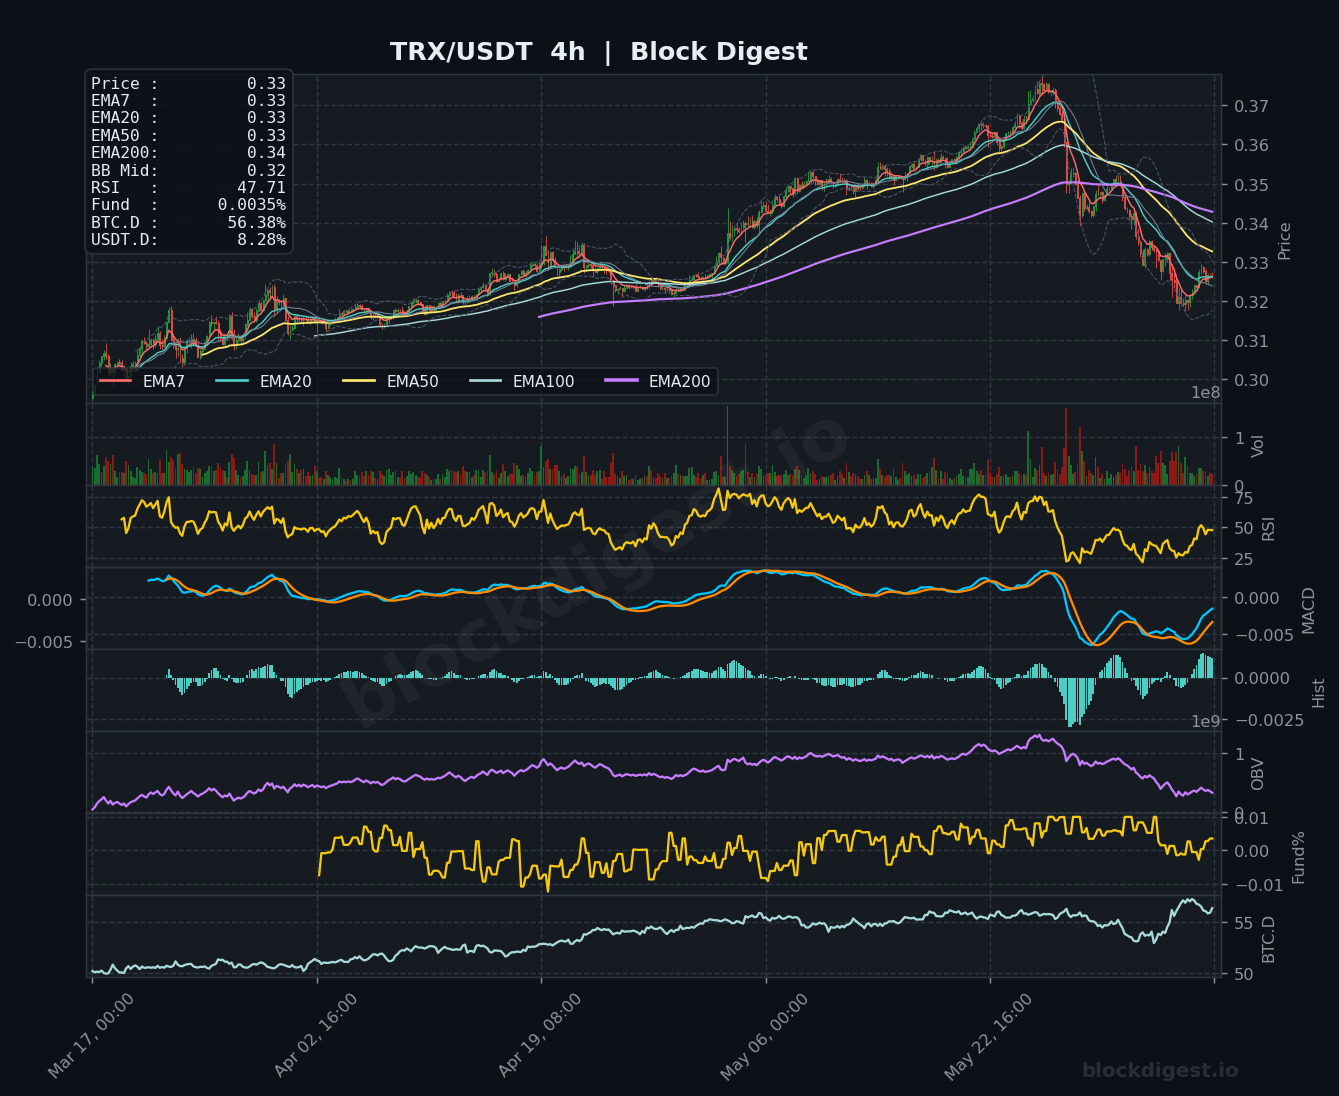
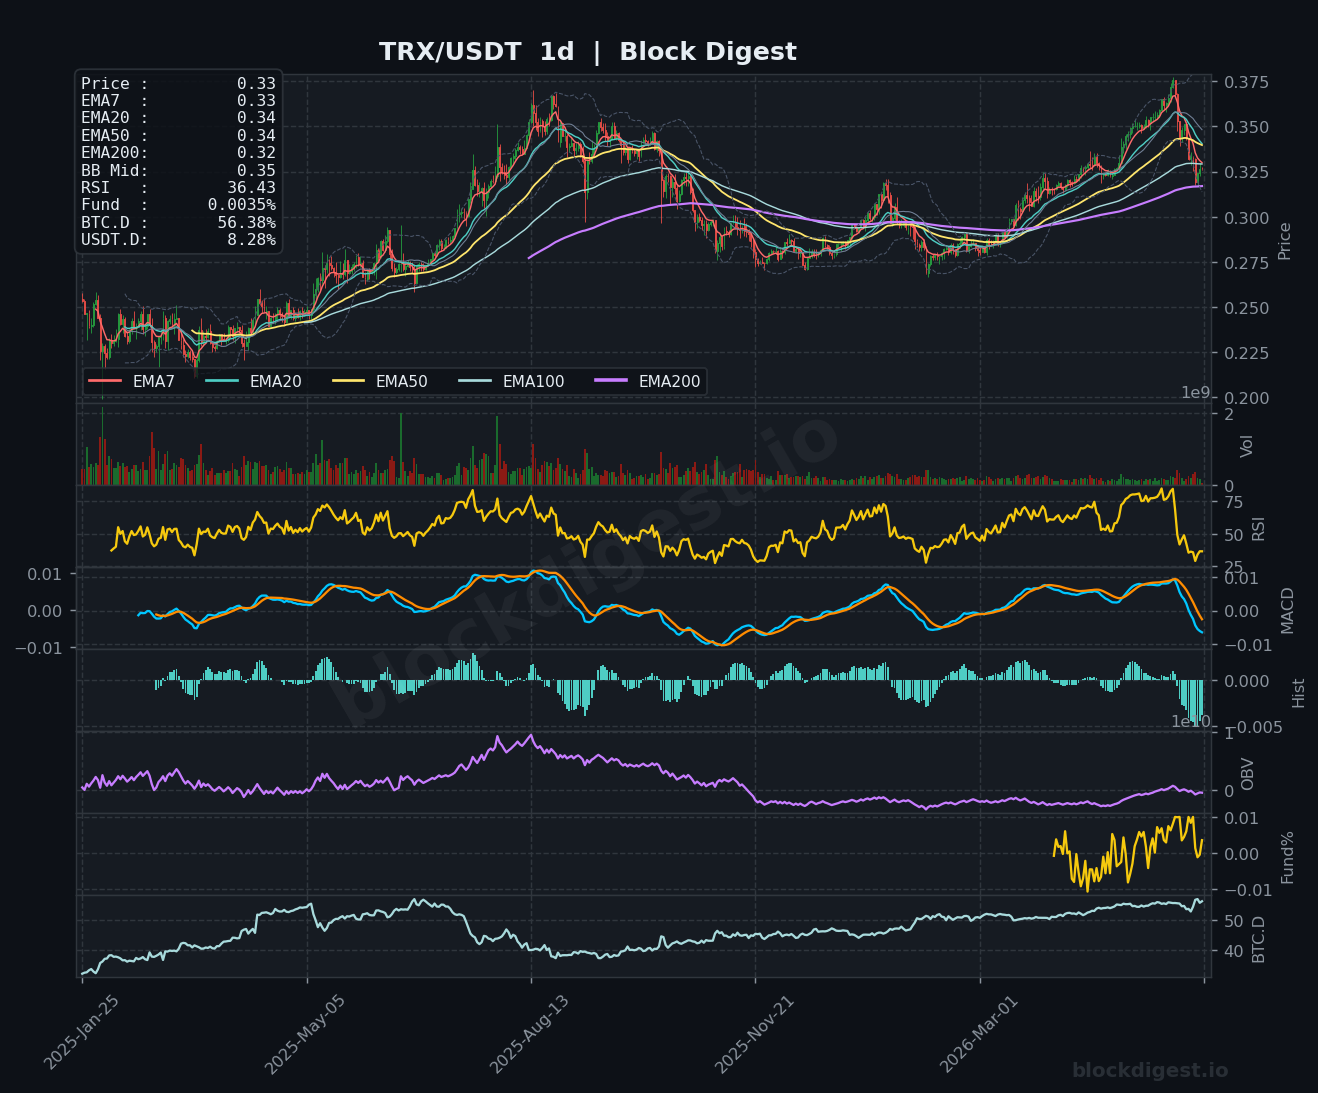
TRON (TRX)
TRX is trading at $0.33, holding up relatively better than its peers on a structural basis, though it has pulled back sharply from recent highs near $0.375. The 1h chart shows RSI at 53.02 with MACD near zero and price consolidating tightly around the $0.33 EMA cluster, indicating a potential base-building phase. On the 4h timeframe, RSI at 47.71 and a MACD that is beginning to turn up from negative territory suggest the worst of the intermediate selling may be easing, though OBV has declined meaningfully from its peak. The daily chart is notably more constructive than peers — the EMA200 sits at $0.32, providing dynamic support just below current price, and while RSI at 36.43 is weak, TRON has not broken its long-term uptrend structure; a hold above $0.32 is critical, with a recovery toward $0.34–$0.35 (daily EMA20/EMA50) the key bull case.
Altcoin Outlook
As of June 8, 2026, the altcoin market is broadly oversold on daily timeframes, with RSI readings across SOL, DOGE, LTC, and XRP hovering near or below 30 — a condition that historically precedes technical bounces but does not guarantee trend reversals. TRX stands out as the relative outperformer, maintaining support above its daily EMA200 and exhibiting a less deteriorated trend structure, while LTC appears the weakest, trading at multi-year lows with no immediate technical support of substance. BNB and XRP are in intermediate positions, showing early stabilization signals on lower timeframes but facing substantial resistance from declining EMAs above current prices. The key conditions to watch across the altcoin space include a potential BTC dominance rollover from 56.37%, a meaningful decline in USDT.D from 8.28% signaling capital re-entry into risk assets, and individual coin confirmations above their respective 1h/4h EMA200 levels before any long-bias setups can be considered high-probability.
Disclaimer: This analysis is for informational purposes only and does not constitute financial advice. Cryptocurrency markets are highly volatile and unpredictable. All trading decisions should be made based on your own research and risk tolerance. Block Digest is not responsible for any financial losses incurred as a result of acting on this content.