Ethereum Daily Analysis: ETH at $1,672 Below All Major EMAs
Market Overview
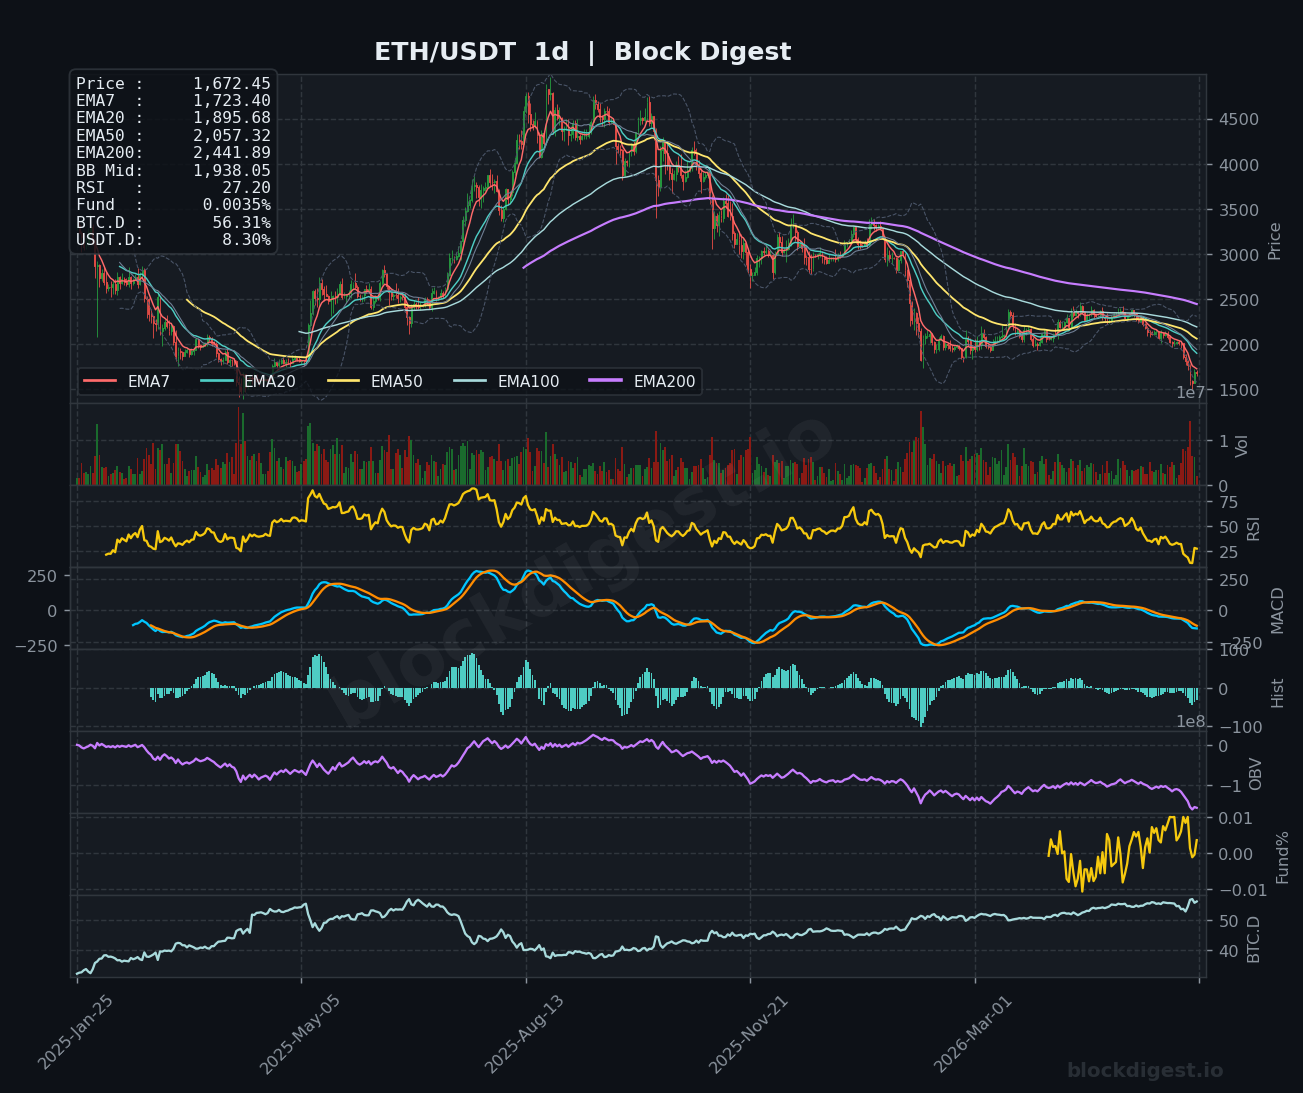
ETH/USDT is currently trading at $1,672.46, caught in a protracted downtrend that has seen price shed significant value from highs above $4,000 on the daily timeframe. Price remains decisively below all major EMAs on the daily chart — EMA7 at $1,723.40, EMA20 at $1,895.68, EMA50 at $2,057.32, and EMA200 at $2,441.89 — confirming a fully bearish EMA stack with no structural recovery in sight at the macro level. The daily Bollinger Band midline sits at $1,938.05, well above current price, indicating that ETH continues to trade in the lower half of its volatility envelope. The dominant daily trend remains firmly bearish, with each EMA acting as a ceiling rather than support on attempted bounces.
Multi-Timeframe Confluence
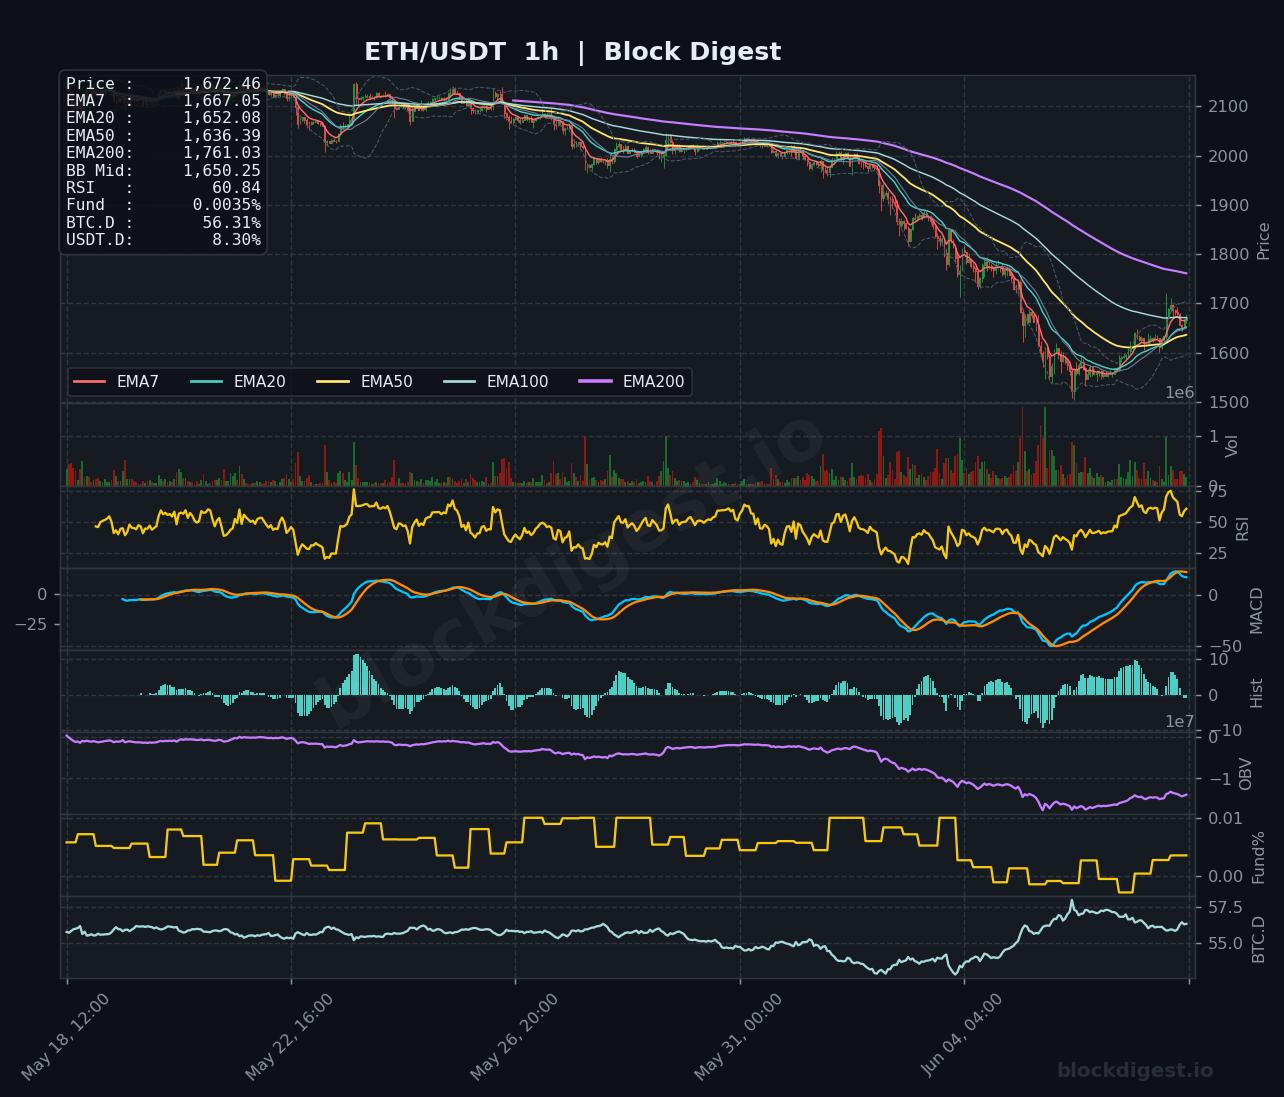
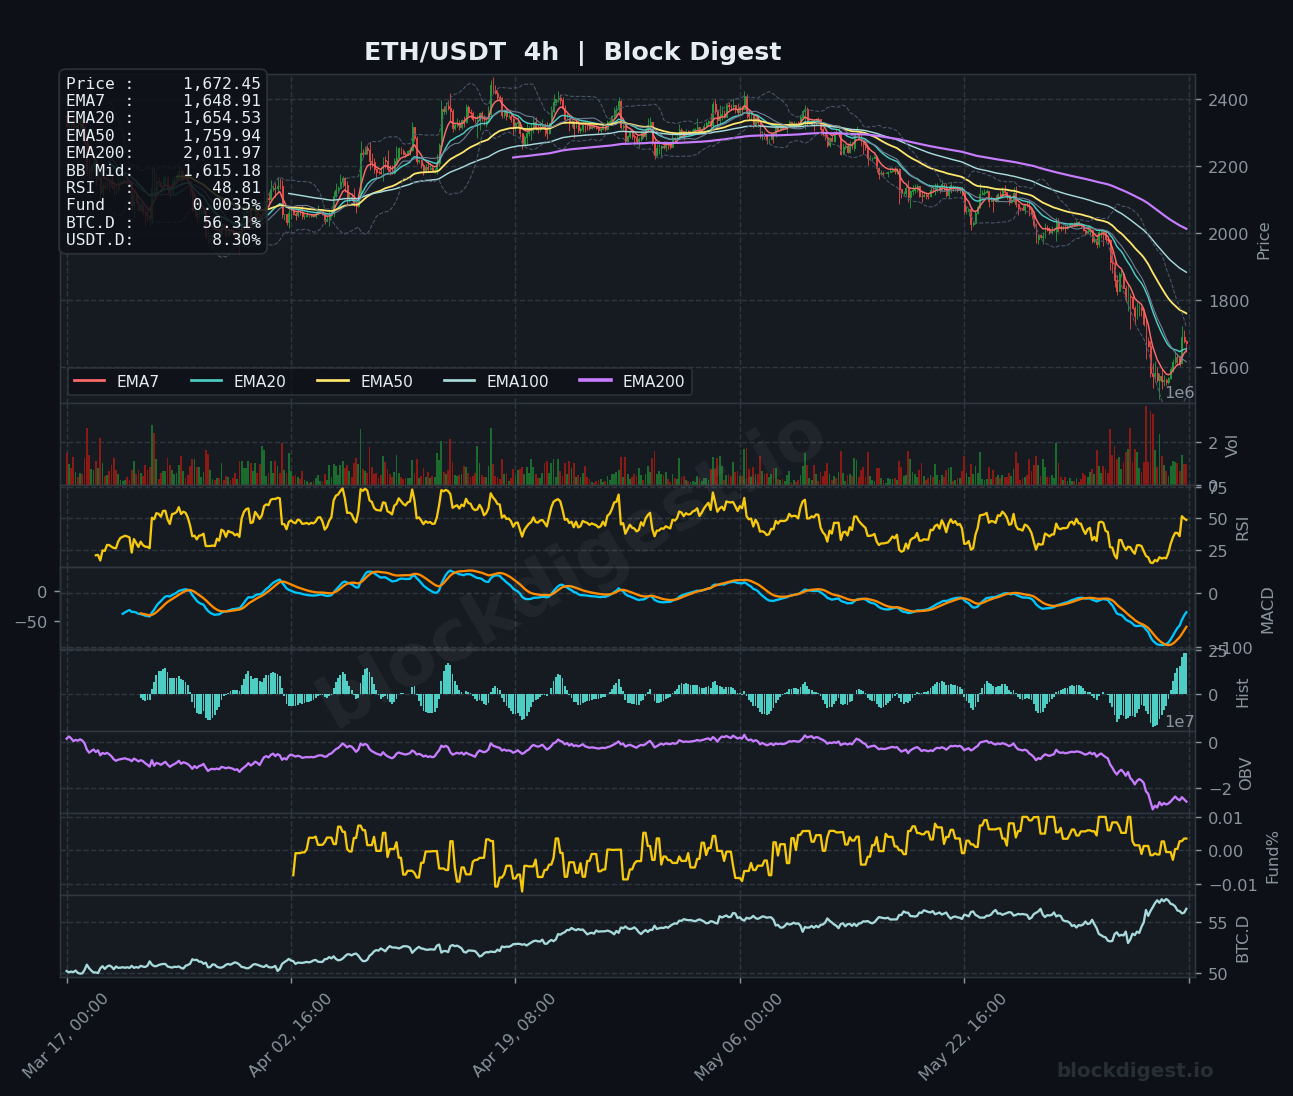
On the 1-hour chart, price has staged a short-term recovery attempt, with the 1h RSI pushing to 60.84 and price reclaiming the EMA7 ($1,667.05) and EMA20 ($1,652.08), suggesting near-term bullish momentum building off recent lows near $1,500. The 4-hour chart presents a more cautious picture, with RSI at a neutral 48.81 and price still battling the EMA7 ($1,648.91) and EMA20 ($1,654.53) — both compressed tightly, signaling indecision rather than confirmed reversal. Crucially, the 4h EMA50 at $1,759.94 and EMA200 at $2,011.97 loom as formidable overhead resistance, aligning with the daily timeframe’s bearish EMA structure. The short-term 1h momentum is the lone constructive signal; it contradicts the deeply bearish higher-timeframe trend and should be treated cautiously as a potential relief bounce rather than a structural reversal.
Key Levels to Watch
- Resistance: $1,723–$1,725 — Daily EMA7, the first meaningful overhead barrier where sellers previously re-engaged
- Resistance: $1,759–$1,760 — 4h EMA50, a critical level that capped prior recovery attempts during the broader downtrend
- Resistance: $1,895–$1,900 — Daily EMA20, a major structural ceiling that would need to be reclaimed to suggest any medium-term trend shift
- Support: $1,650–$1,652 — Confluence of 1h EMA20 and 4h EMA20, acting as immediate near-term floor
- Support: $1,615 — 4h Bollinger Band midline, a secondary technical floor on intraday pullbacks
- Support: $1,500–$1,520 — Recent multi-month lows; a breakdown here would open the door to deeper structural losses
Momentum & On-Chain Signals
The RSI divergence across timeframes is telling: the 1h RSI at 60.84 reflects short-term momentum recovery, while the 4h RSI holds at a neutral 48.81, and the daily RSI has collapsed to a deeply oversold 27.20 — a level historically associated with capitulation. On the MACD, the 4h histogram is printing the largest positive bars seen in the recent correction, suggesting a potential bullish crossover attempt, though the signal lines remain deep in negative territory. OBV across both the 1h and 4h charts has trended sharply lower, confirming ongoing distribution and indicating that volume is not yet supporting a sustained recovery. The funding rate of +0.0035% is marginally positive, suggesting slight long bias in perpetual markets without excessive leverage buildup.
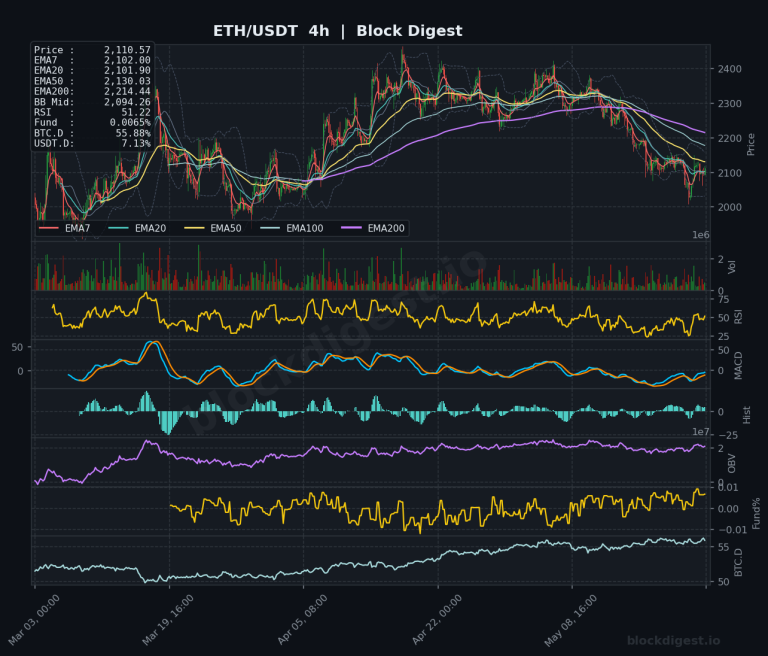
BTC Dominance & Market Sentiment
BTC dominance currently stands at 56.31%, remaining elevated and trending upward over the observed period, which indicates capital continues to rotate toward Bitcoin relative to altcoins including ETH. USDT dominance at 8.30% reflects a still-elevated stablecoin allocation, suggesting that a meaningful portion of market participants remain on the sidelines or in risk-off positioning. These readings are broadly unfavorable for ETH, implying that any broader market recovery is likely to benefit BTC disproportionately before altcoin capital rotation resumes.
Risk Scenarios
- Bullish case: A sustained hourly close above $1,723 (daily EMA7) with rising 4h RSI breaking above 55 would suggest a credible short-term recovery targeting the $1,759–$1,760 zone and potentially $1,800 on a momentum extension.
- Bearish case: Failure to hold the $1,650 confluence support and a 4h close back below $1,615 would signal the bounce is exhausted, opening a path toward retesting the $1,500–$1,520 lows and risking further downside extension.
Outlook
The immediate directional bias leans cautiously neutral-to-slightly-bullish on a short-term basis only, driven by the 1h momentum recovery and oversold daily RSI conditions that may support a technical bounce. However, the macro structure remains unambiguously bearish — every major EMA on the daily chart is sloping downward and sitting far above current price, while OBV confirms sustained distribution. Key triggers to watch over the next 24–48 hours include whether ETH can decisively reclaim and hold the $1,723 daily EMA7, and whether BTC dominance shows any signs of plateauing to allow altcoin relief. Until price reclaims at minimum the 4h EMA50 at $1,759 on a closing basis, any bounce should be treated as a counter-trend move within a larger bearish structure.
Disclaimer: This analysis is for informational purposes only and does not constitute financial advice. Cryptocurrency markets are highly volatile and unpredictable. All trading decisions should be made based on your own research and risk tolerance. Block Digest is not responsible for any financial losses incurred as a result of acting on this content.