Ethereum Weekly Analysis: Ethereum Falls to Early 2023 Lows Amid Distribution
Weekly Market Overview
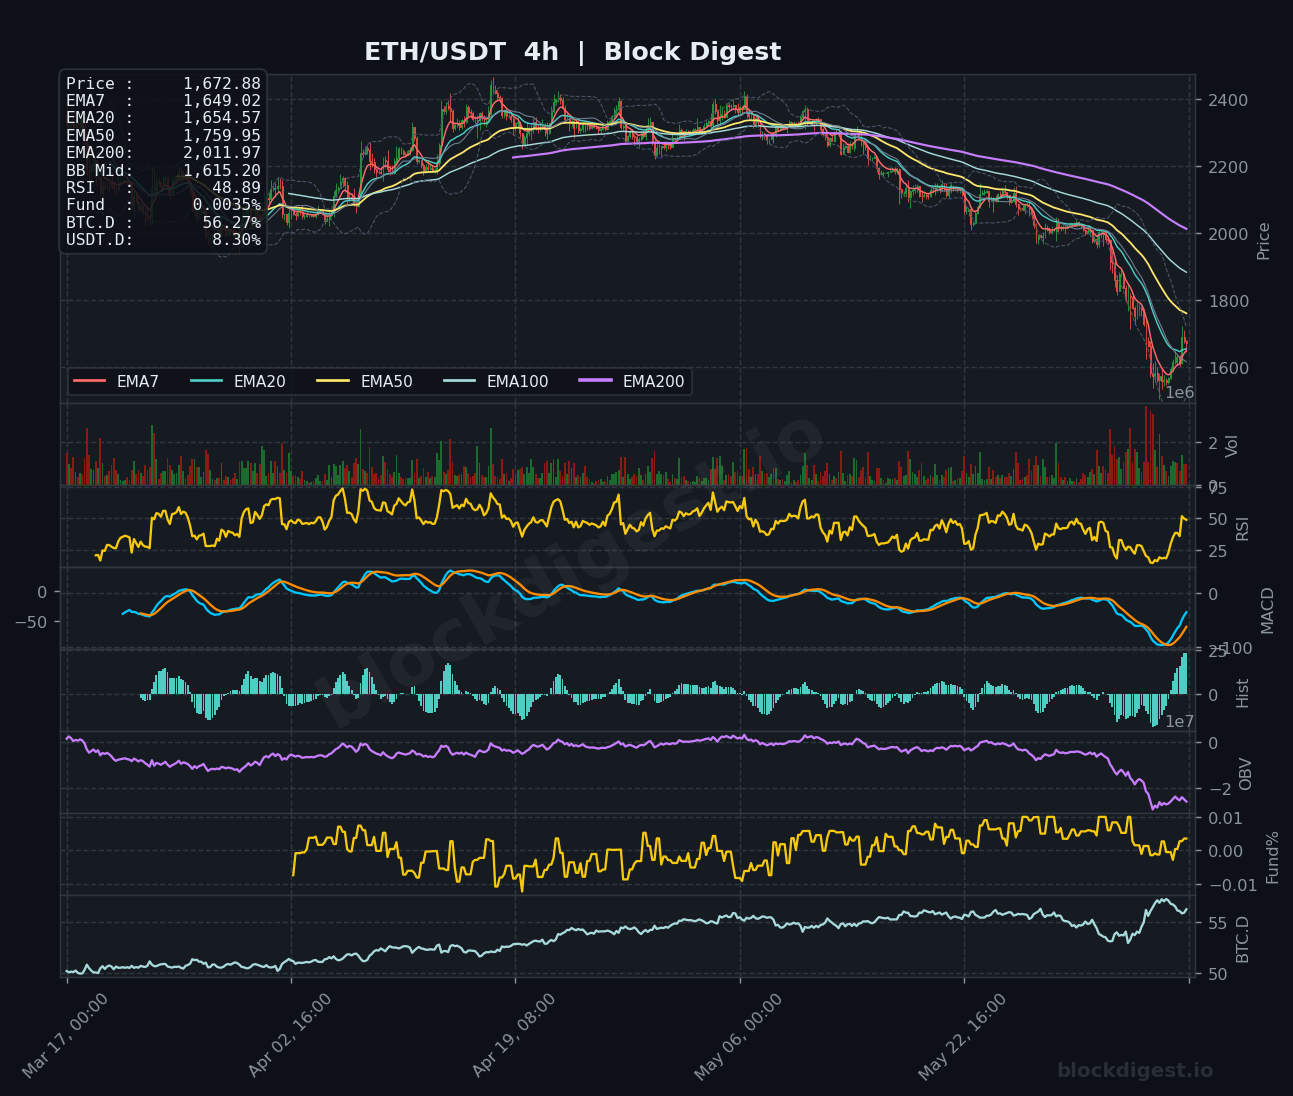
Ethereum has endured a brutal multi-week sell-off, with ETH/USDT currently trading around $1,672 — levels not seen since early 2023. The weekly candle structure reflects sustained distribution, with price printing consecutive bearish closes well below all major exponential moving averages across every timeframe. This week’s price action was further pressured by macro headwinds, including Middle East tensions dampening risk appetite, a historically severe 13-session Bitcoin ETF outflow streak, and capital rotation into AI and semiconductor sectors pulling liquidity away from crypto markets. The broader market has shed approximately 48% from its cycle peak, and ETH is bearing the brunt of altcoin underperformance relative to Bitcoin.
Higher Timeframe Structure
On the weekly chart, the EMA stack is in full bearish cascade: EMA7 at $1,946, EMA20 at $2,218, EMA50 at $2,596, and EMA200 at $2,530 — all positioned dramatically above current price, which means ETH would need to recover 15–55% just to reach its shorter-term dynamic resistances. Price has broken decisively below the weekly Bollinger Band midline at $2,079, and is currently pressing against the lower band, suggesting extreme extension to the downside but without a confirmed reversal signal. Weekly RSI sits at 31.47 — approaching historically oversold territory comparable to the capitulation lows of mid-2022 and early 2023, though it has not yet reached the sub-25 readings that marked definitive bear market bottoms. The macro trend remains unambiguously bearish, with no structural higher-low formation in place to suggest a meaningful trend reversal.
Multi-Timeframe Confluence
All three timeframes are aligned bearishly, with no divergence offering near-term relief — a rare and significant signal of trend conviction to the downside. On the daily chart, EMA7 ($1,724) and EMA20 ($1,896) are steeply declining and well above spot, while the daily RSI has collapsed to 27.22, deep in oversold territory. The 4-hour timeframe shows price hovering just above the BB midline at $1,615, with EMAs 7 and 20 tightly compressed around $1,649–$1,655, indicating short-term indecision within an otherwise decisive downtrend. Confluent resistance across all three timeframes clusters between $1,720 and $1,760, representing the first meaningful overhead zone where any relief rally is likely to stall.
Key Weekly Levels
- Weekly Resistance: $1,720–$1,760 (4H EMA50 and daily EMA7 confluence, first overhead supply zone); $1,895–$1,940 (daily EMA20 and weekly EMA7, significant structural resistance); $2,079 (weekly Bollinger Band midpoint and psychological level marking the return-to-range threshold)
- Weekly Support: $1,610–$1,615 (4H BB midline and current price floor — a critical near-term decision point); $1,480–$1,500 (2023 consolidation zone and next major historical demand cluster); $1,200–$1,250 (macro bear market support shelf from 2022 — the ultimate downside target if current support fails decisively)
Momentum & Volume Analysis
Weekly MACD remains deeply negative with the signal line below the zero line and histogram bars still expanding bearishly, suggesting downside momentum has not yet exhausted at the macro level. Daily MACD mirrors this structure, with both lines in negative territory and no bullish crossover imminent — however, histogram compression on the 4-hour chart hints at early deceleration in selling pressure. Weekly OBV has collapsed to multi-year lows, confirming that sustained net volume has been decidedly sell-side, and the daily OBV breakdown is equally severe, with no divergence signaling accumulation. The funding rate, currently at a near-neutral +0.0035%, is notably telling: despite the sharp sell-off, funding has not flipped meaningfully negative, which suggests shorts are not yet aggressively piling in — a slight contrarian positive, but insufficient alone to call a bottom without price confirmation.
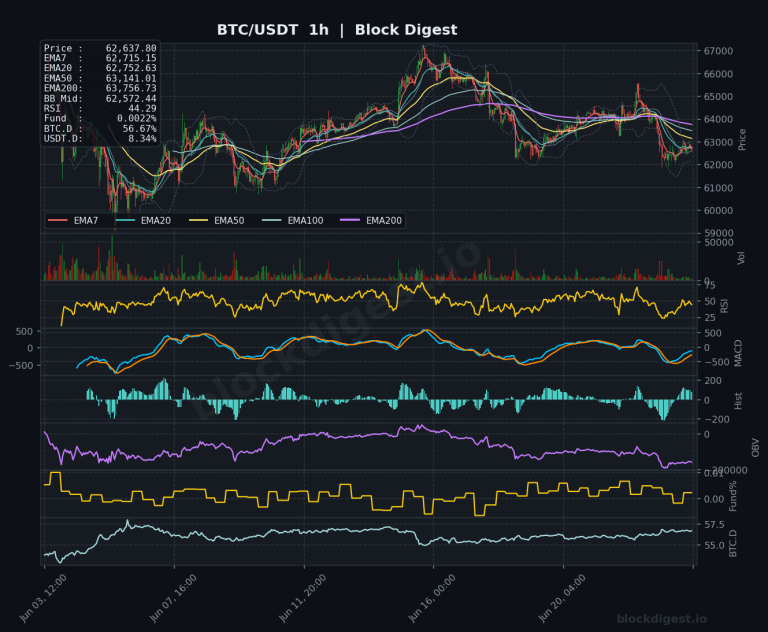
BTC Dominance & Altcoin Implications
Bitcoin dominance (BTC.D) sits at 56.27% and, per the 4-hour and weekly charts, remains in a steady uptrend that has persisted throughout the entire 2025–2026 correction — a structural headwind that has consistently suppressed ETH and altcoin performance. USDT dominance at 8.30% indicates a meaningful portion of market capital remains sidelined in stablecoins, which is a prerequisite for a future risk-on rotation but not a near-term catalyst in itself. Until BTC.D shows a decisive reversal or consolidation, ETH is unlikely to outperform Bitcoin, and the broader altcoin market will continue to suffer disproportionate losses relative to any BTC recovery.
Risk Scenarios
- Bull case: A weekly close above $1,760 — reclaiming the 4H EMA50 — would be the first meaningful sign of short-term trend exhaustion and could trigger a relief rally targeting $1,895–$1,940 (daily EMA20). The weekly RSI approaching 30 and an oversold daily RSI of 27 create the technical setup for a sharp but likely corrective bounce; sustained institutional re-entry via ETF inflows ending the outflow streak could be the macro catalyst needed to initiate the move.
- Bear case: Failure to hold the $1,610–$1,615 support zone on a weekly closing basis opens the path to $1,480, and a break of that level on meaningful volume would project downside continuation toward the $1,200–$1,250 macro support shelf. Continued AI-sector capital rotation, persistent ETF outflows, or an escalation of Middle East geopolitical tensions could serve as the catalyst for this next leg lower.
Weekly Outlook
The path of least resistance for ETH remains to the downside, with the technical structure offering no convincing reversal signal at this stage — traders should treat any near-term bounce as a potential dead-cat relief rally until weekly price closes above $1,760 with volume confirmation. The most critical level to monitor this week is the $1,610–$1,615 zone; a sustained breakdown below this area on elevated volume would signal acceleration toward the $1,480 target. On the positive side, the confluence of deeply oversold daily RSI (27.22), weekly RSI approaching 31, and the end of the 13-session Bitcoin ETF outflow streak creates a fragile but watch-worthy setup for a short-term mean-reversion bounce. Macro catalysts — including any Fed commentary on rate trajectory, further developments in the U.S.-Iran situation, or a shift in ETF flow data — will likely determine whether ETH can stabilize or continues its descent. Risk management remains paramount: position sizing should reflect the reality that, while a technical bounce is overdue, the macro and on-chain weight of evidence still favors sellers in this environment.
Disclaimer: This analysis is for informational purposes only and does not constitute financial advice. Cryptocurrency markets are highly volatile and unpredictable. All trading decisions should be made based on your own research and risk tolerance. Block Digest is not responsible for any financial losses incurred as a result of acting on this content.