Altcoin Daily Analysis: Bitcoin Dominance at 55.53%, USDT Elevated
Market Context
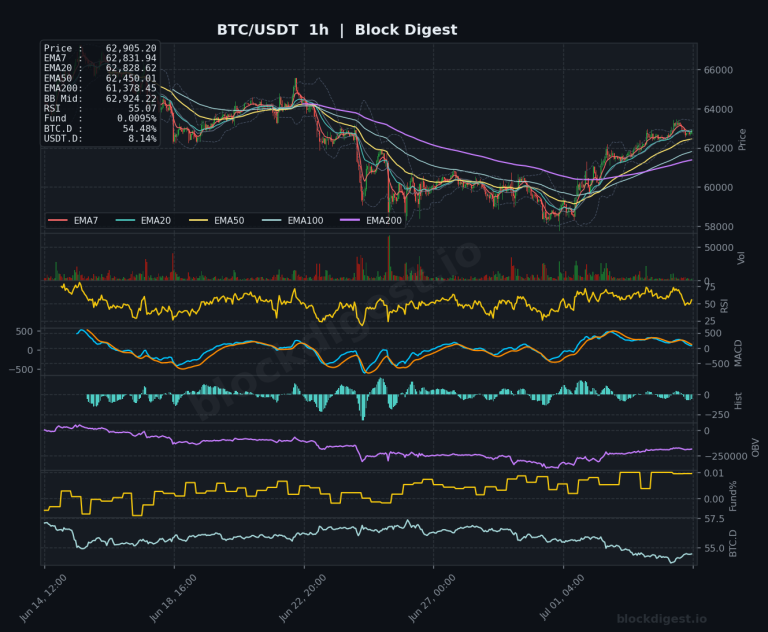
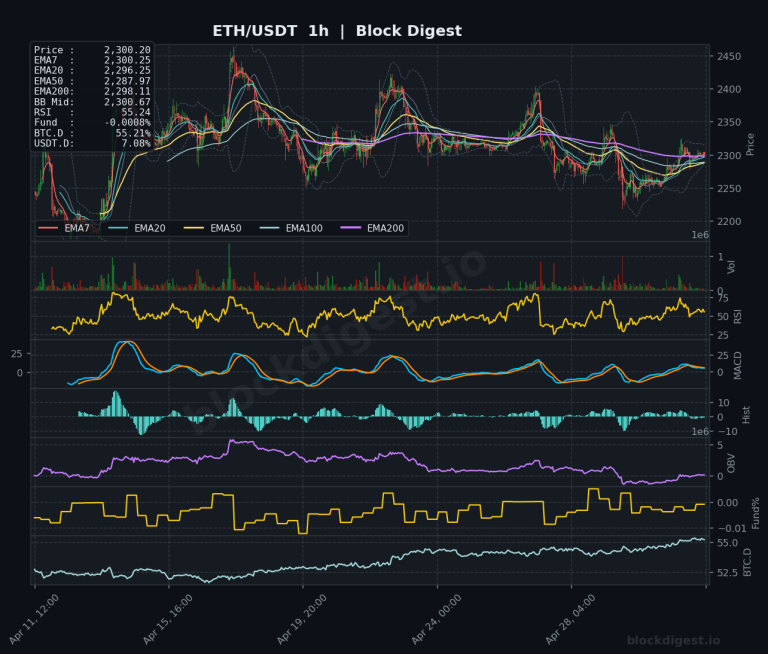
Bitcoin dominance has climbed to 55.53%, a level that historically constrains meaningful altcoin outperformance and signals continued capital rotation toward BTC at the expense of the broader altcoin market. USDT dominance remains elevated at 8.02%, reflecting persistent risk-off positioning as investors keep dry powder on the sidelines amid escalating U.S.-Iran geopolitical tensions that pulled BTC back from recent highs. The global crypto market cap sits at approximately $2.19T, and with the Fear & Greed Index registering 25 (Extreme Fear), the macro backdrop for altcoins remains decidedly cautious heading into the weekend.
Solana (SOL)
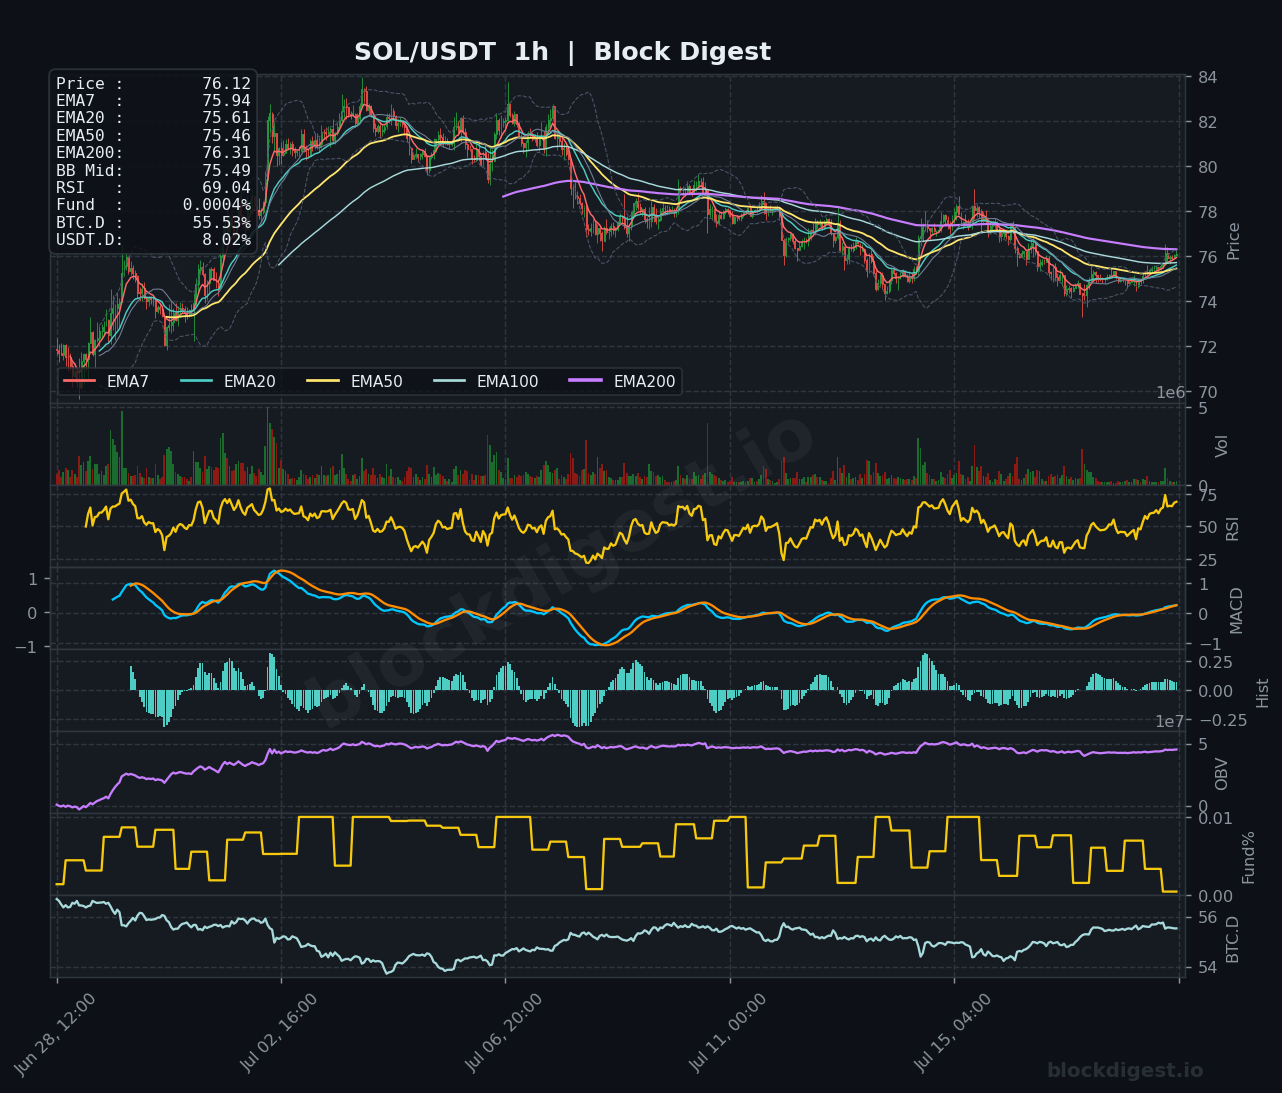
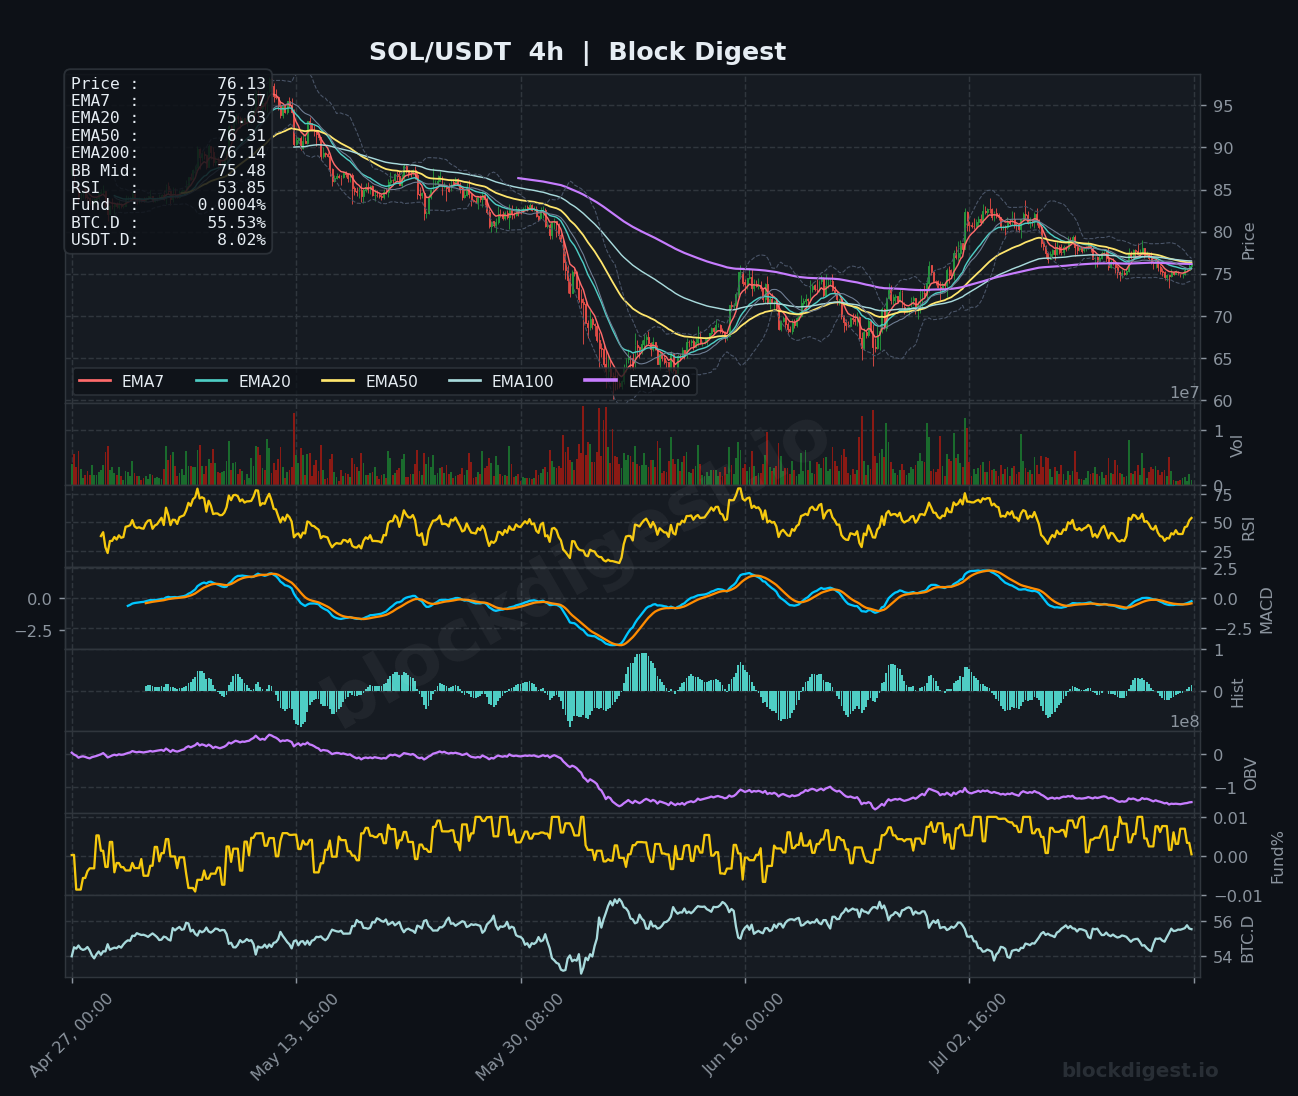
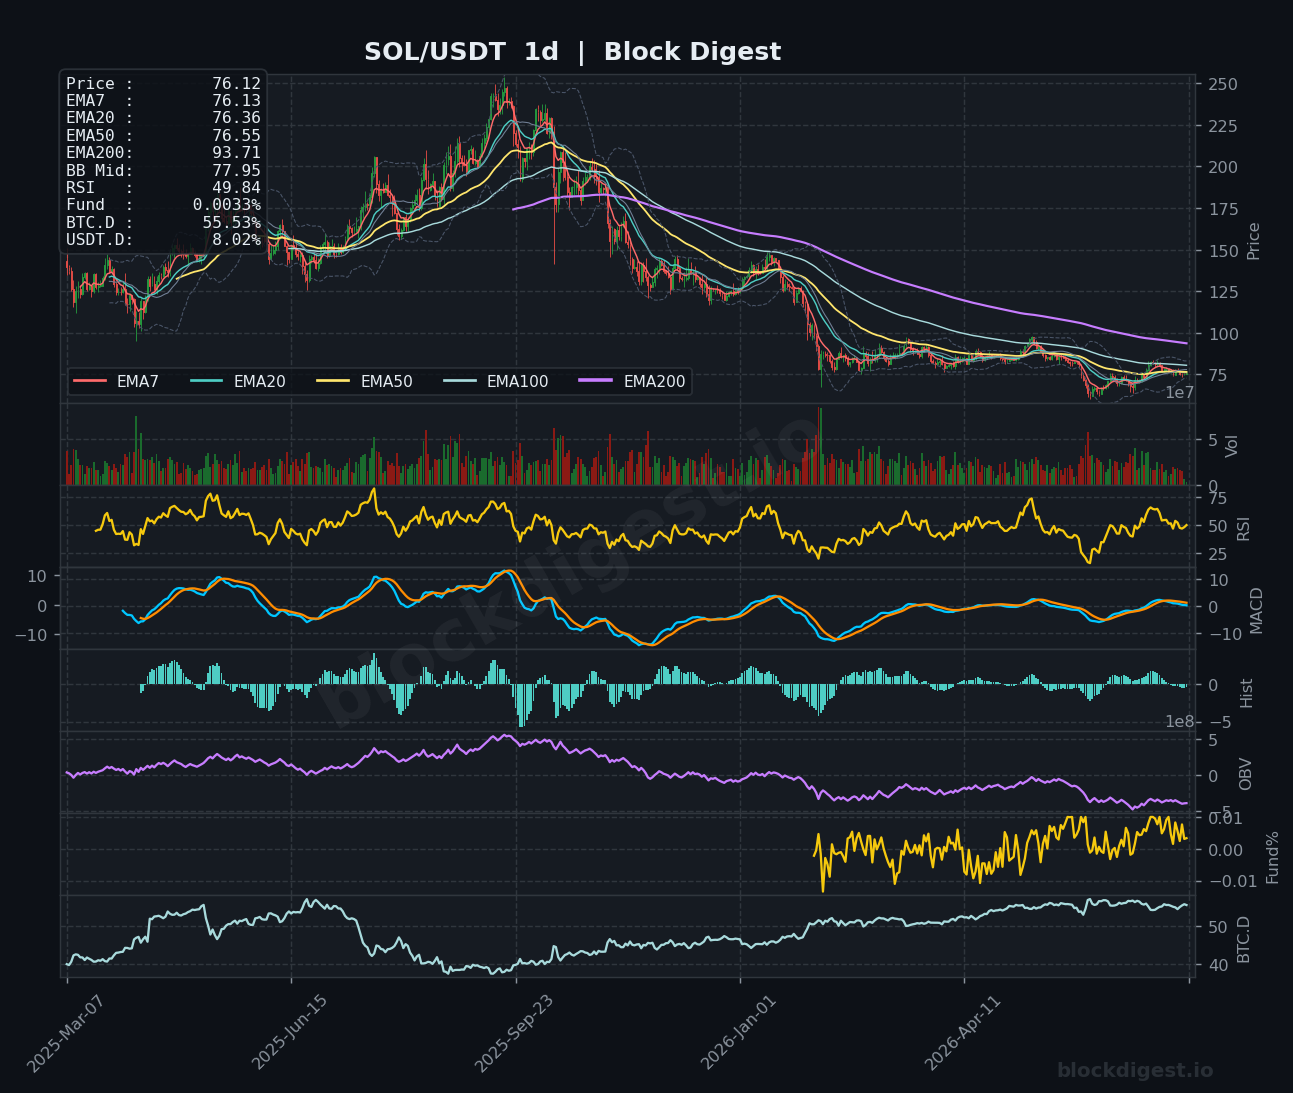
SOL is trading at $76.12, caught in a pronounced downtrend from its highs above $82 as all short-term EMAs (EMA7 at $75.94, EMA20 at $75.61) remain compressed below the EMA200 at $76.31, with price hugging the lower Bollinger Band on the 4h chart. The daily chart paints a structurally bearish picture — SOL has been in a sustained decline from its cycle peak near $250, and the EMA200 on the daily at $93.71 represents a formidable overhead resistance that remains far from current prices. The 1h RSI at 69.04 shows a short-term bounce attempt gaining mild momentum, while the 4h RSI at 53.85 suggests the intermediate trend is neutral-to-weak with the MACD barely recovered above its signal line. Immediate resistance sits at the $77.50–$78.00 cluster where the EMA200 on the 1h converges; a failure to reclaim that zone keeps the short-term bias bearish, with key support at $74.00.
XRP (XRP)
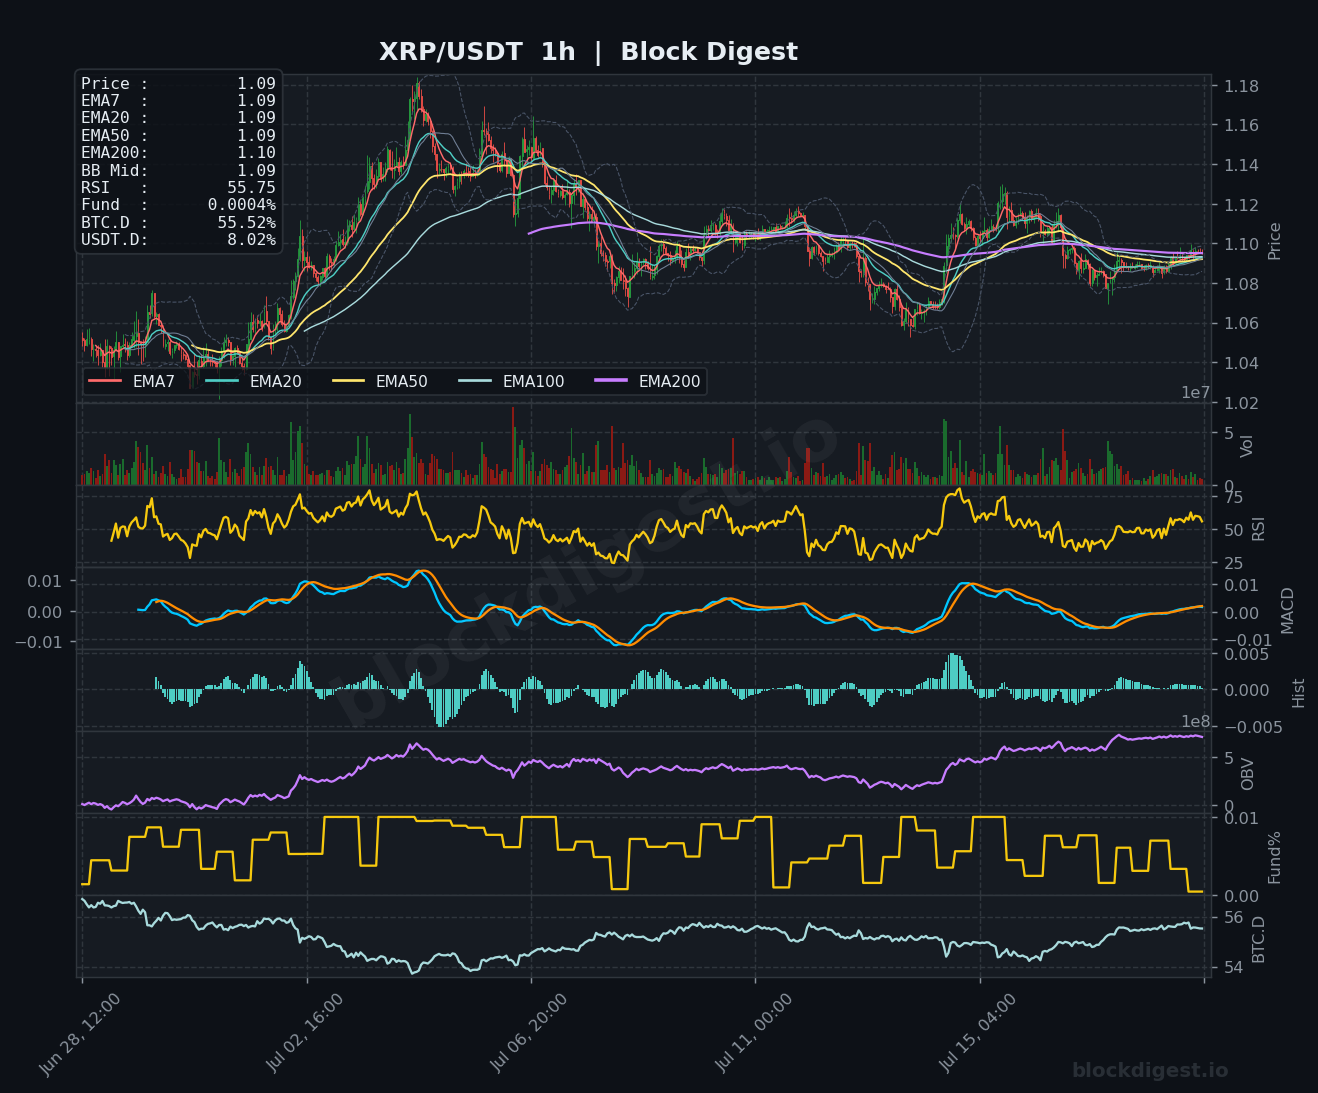
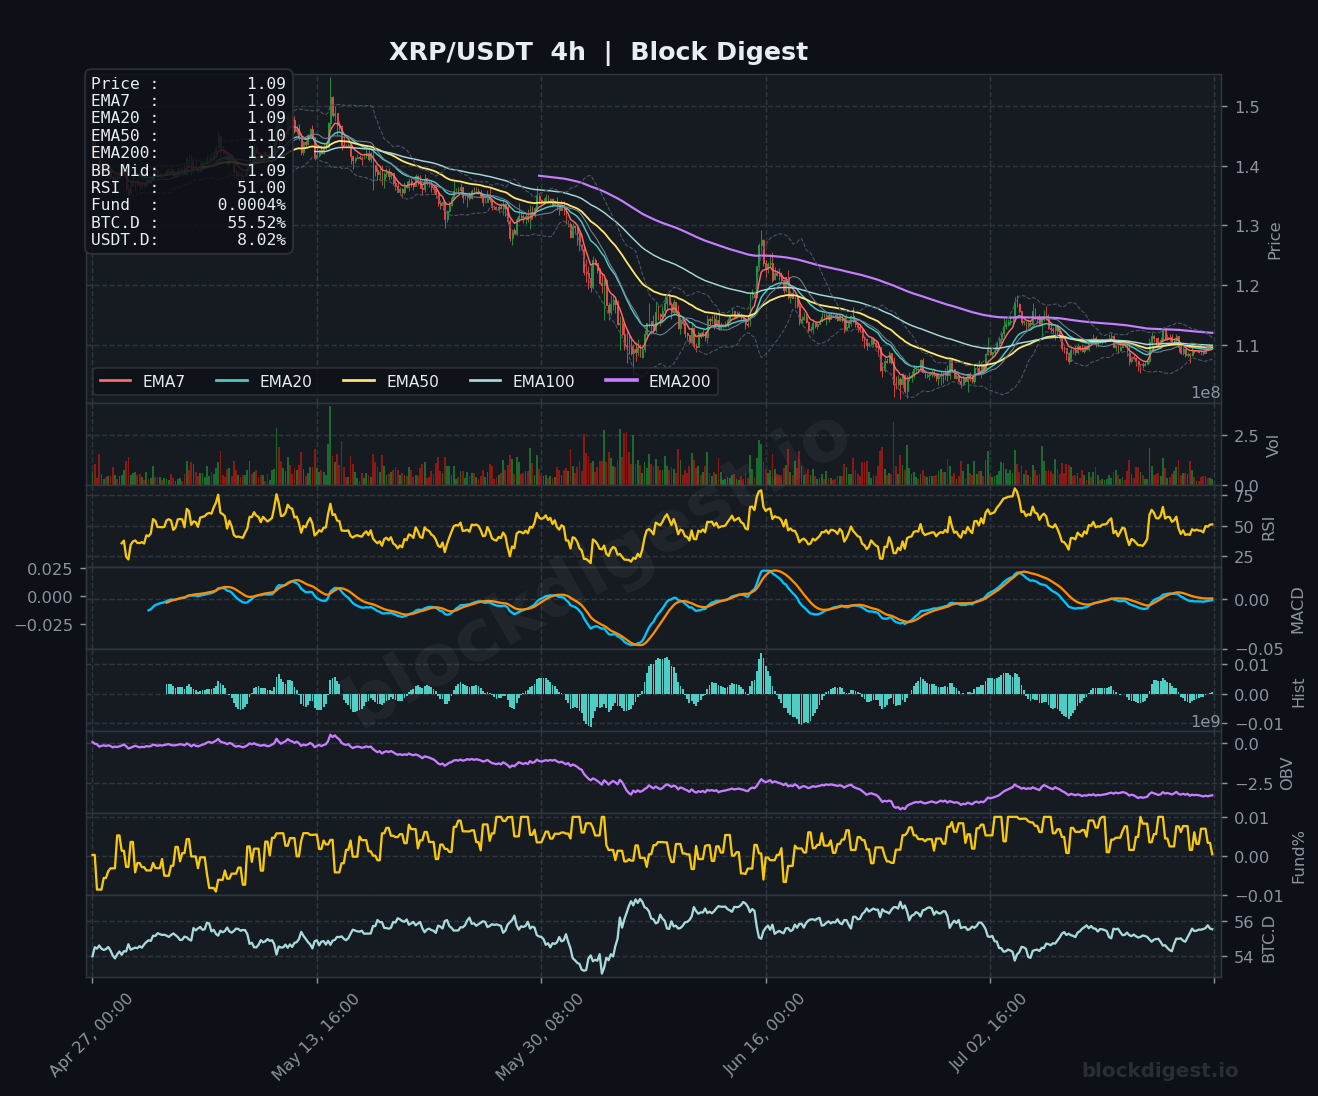
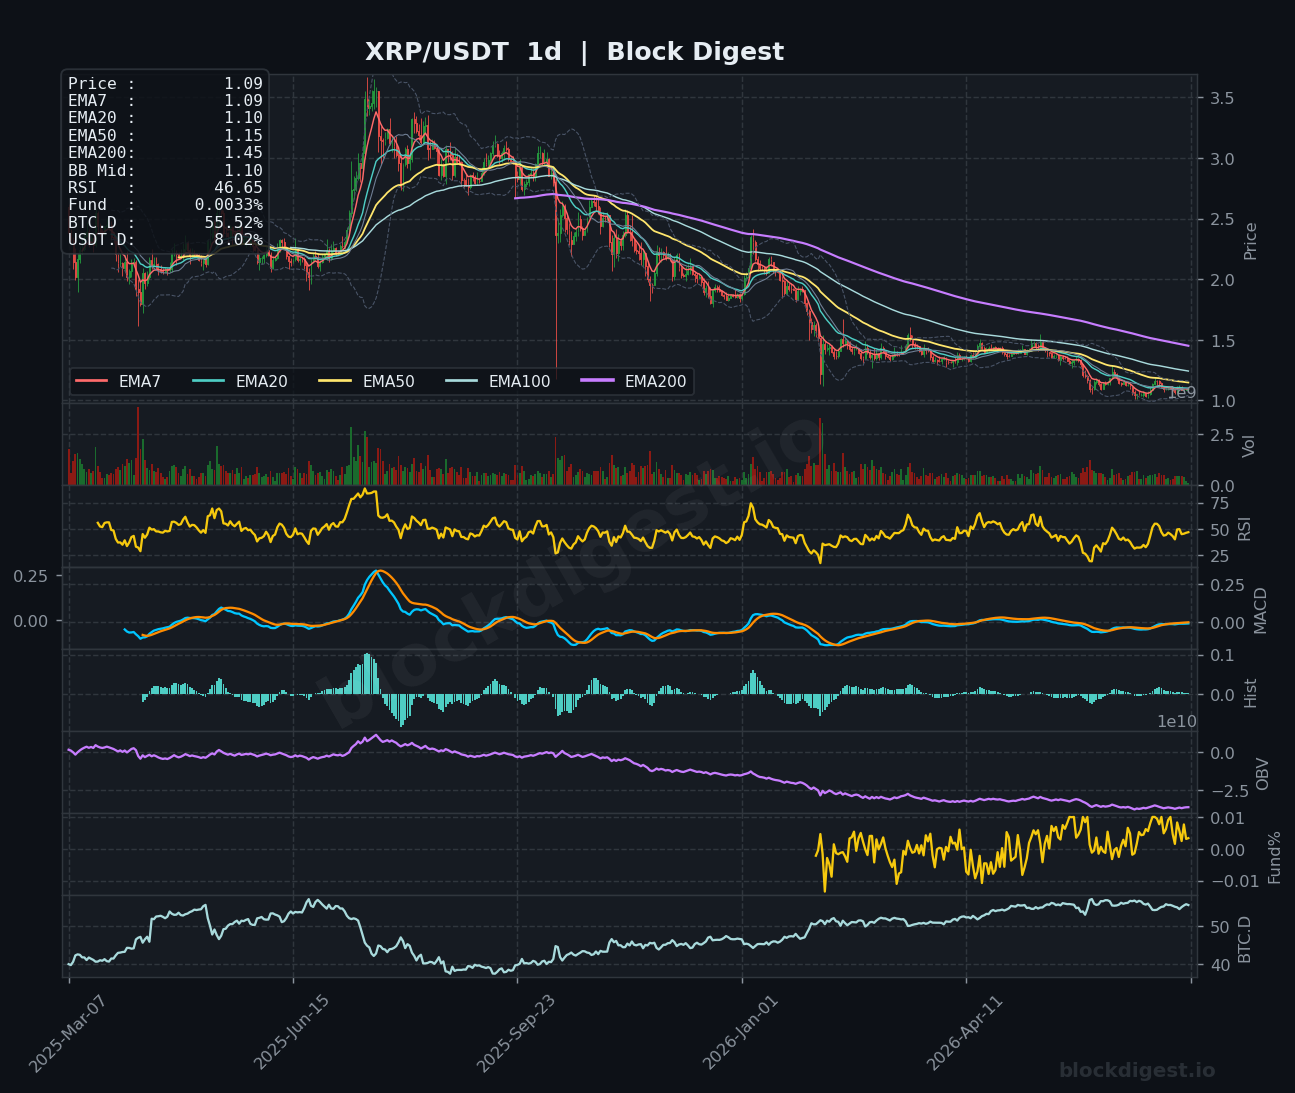
XRP is trading at $1.09, consolidating near multi-month lows after a prolonged downtrend from its peak above $3.00, with the daily EMA200 at $1.45 acting as a distant overhead ceiling. The 1h chart shows all EMAs (EMA7–EMA200) tightly stacked around $1.09–$1.10, suggesting a short-term equilibrium but no directional conviction, while the 1h RSI at 55.75 and a mildly positive MACD histogram indicate tentative buying interest. On the 4h timeframe, RSI at 51.00 and a flat MACD reflect the same indecision, with the OBV continuing its long-term downtrend — a bearish signal that accumulation has not yet materialized despite Ripple’s recent MiCA license approval and XRP’s inclusion in T. Rowe Price’s new ETF. Bulls need a decisive close above $1.12 to build any constructive case; below $1.06 support, renewed selling pressure would likely accelerate.
BNB (BNB)
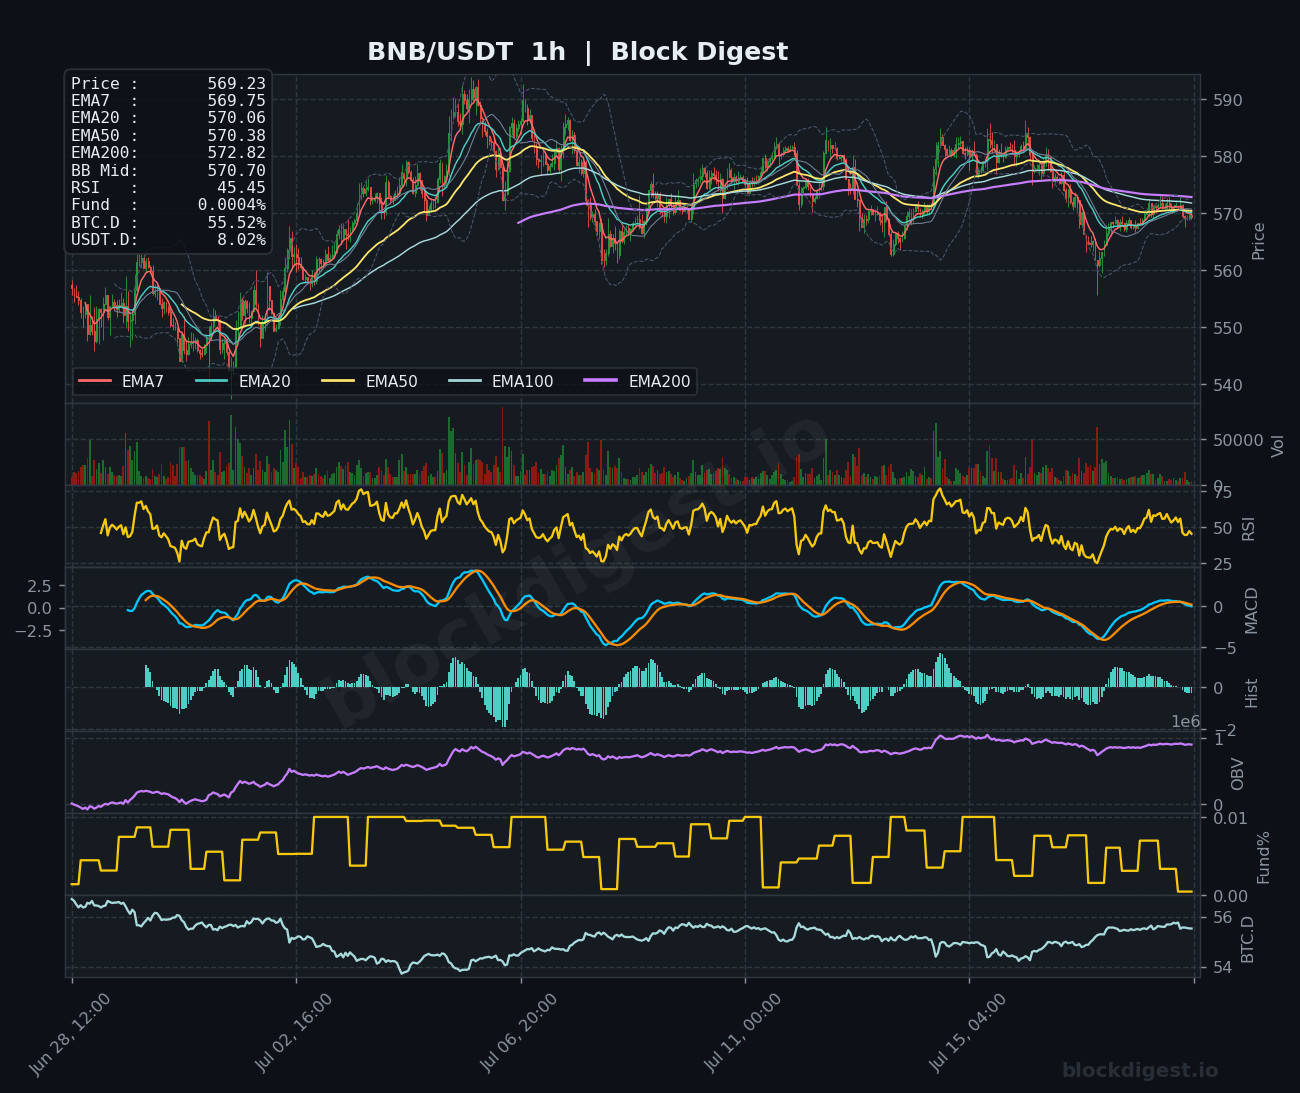
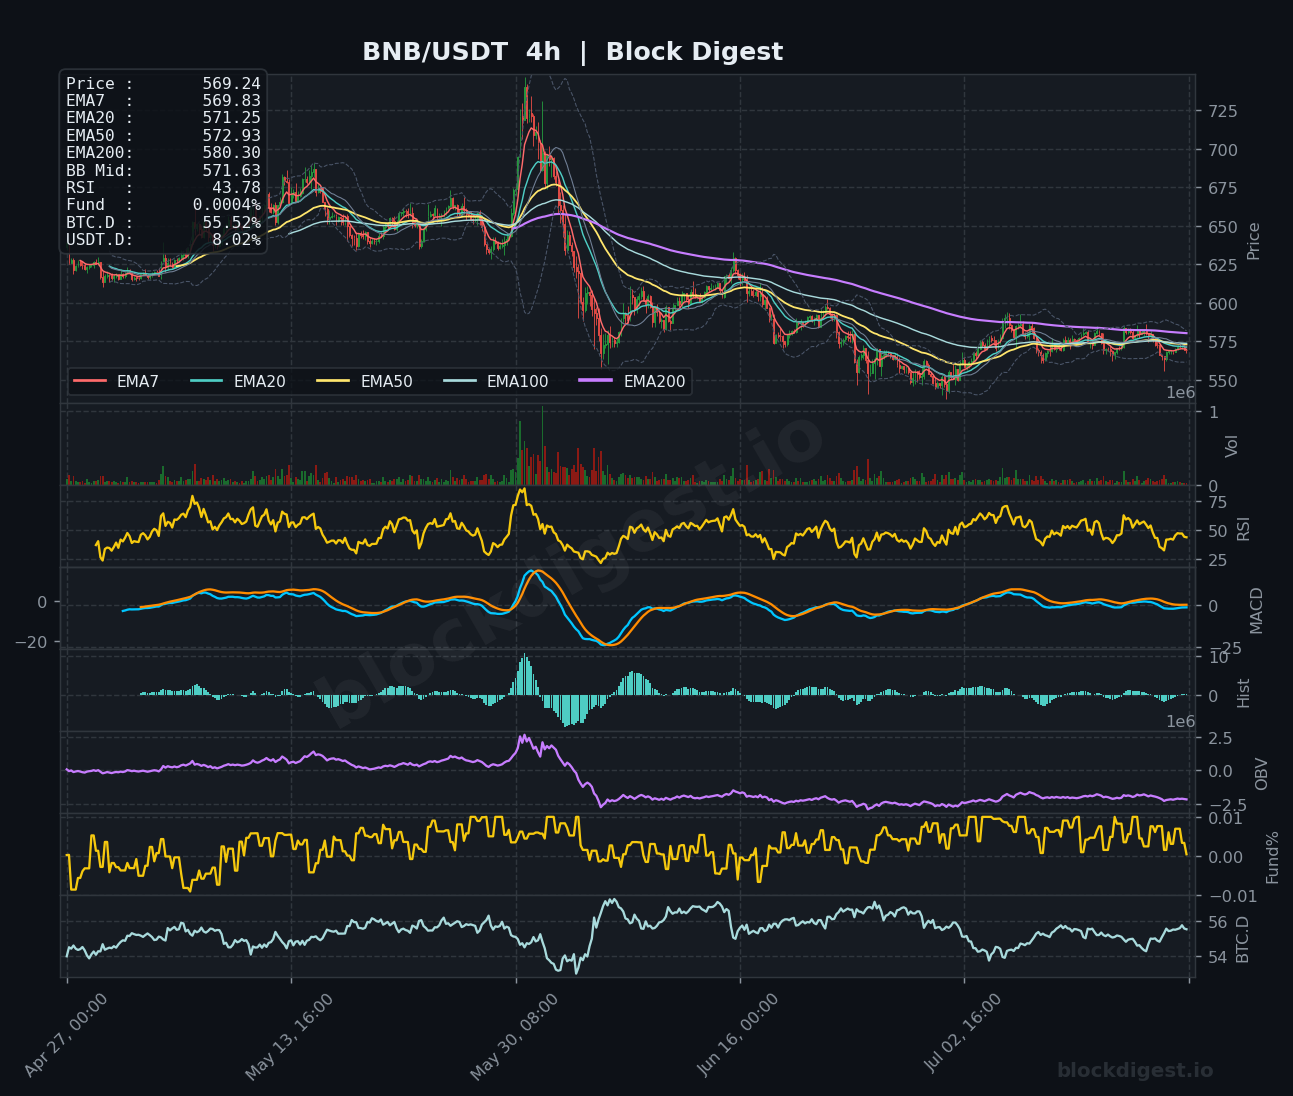
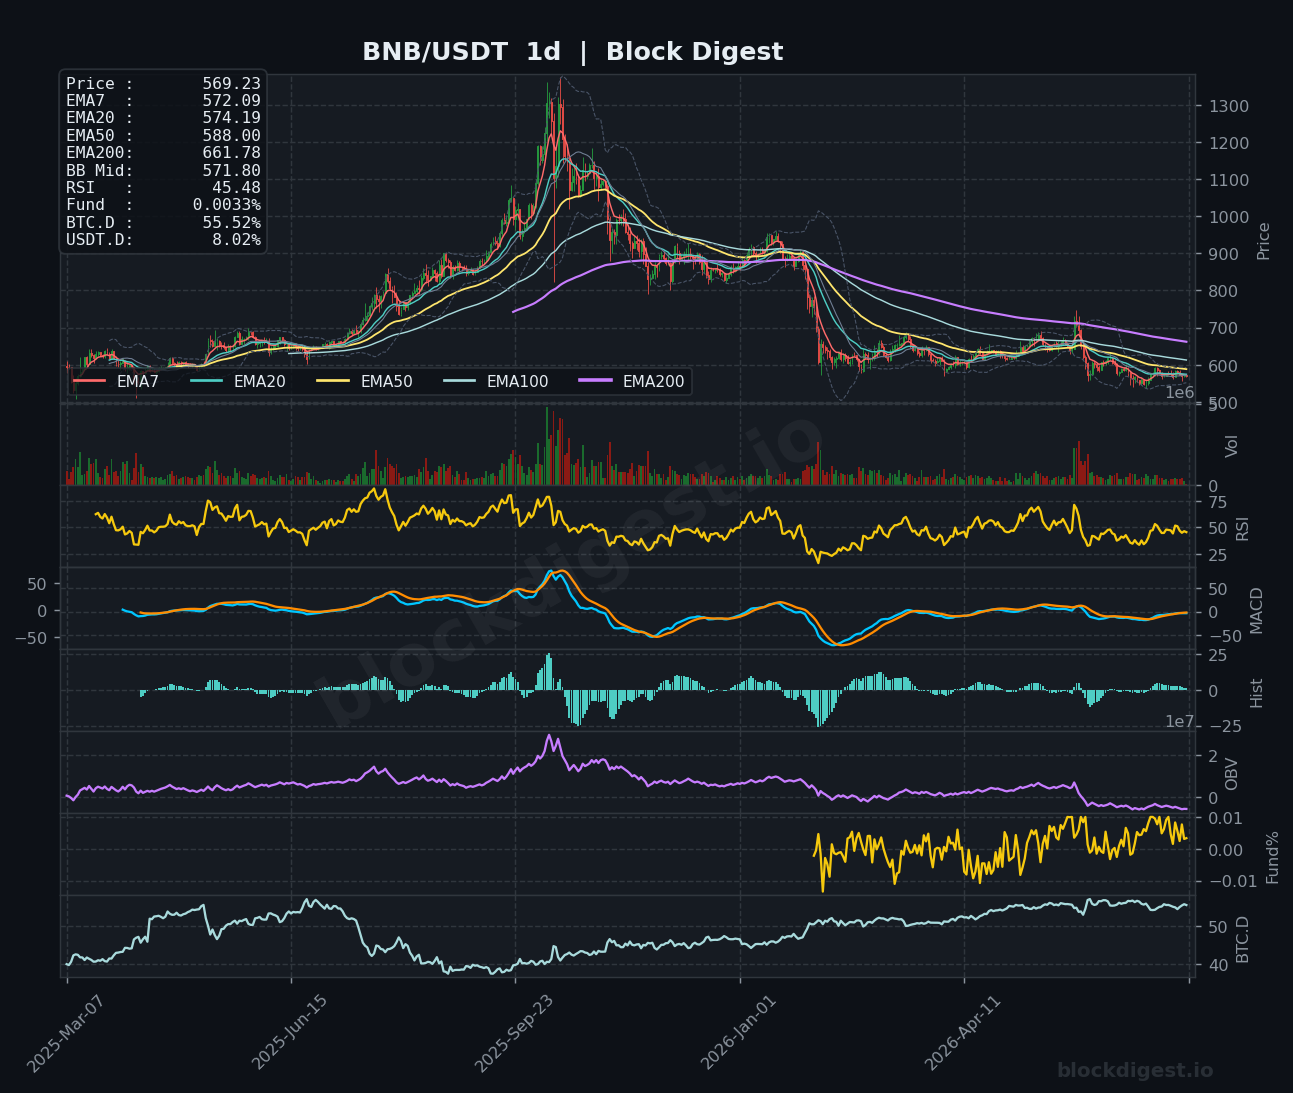
BNB is trading at $569.23, struggling to hold above its tightly clustered short-term EMAs ($569–$572) on the 1h chart, with all moving averages trending downward on the daily and the EMA200 at $661.78 highlighting the scale of the longer-term corrective move. The 1h RSI at 45.45 and the 4h RSI at 43.78 both sit in slightly bearish territory below the neutral 50 line, while the MACD on both timeframes shows negative histogram bars that are slowly compressing, hinting at potential momentum exhaustion rather than a clear reversal. Daily OBV has been declining persistently since the all-time highs, confirming that selling volume has dominated the recovery attempts, and the BB Midline at $571.80 on the 1h is now acting as a near-term pivot. A reclaim of $575–$580 would shift the short-term bias to neutral; failure to hold $560 support could invite a retest of the $550 zone.
Dogecoin (DOGE)
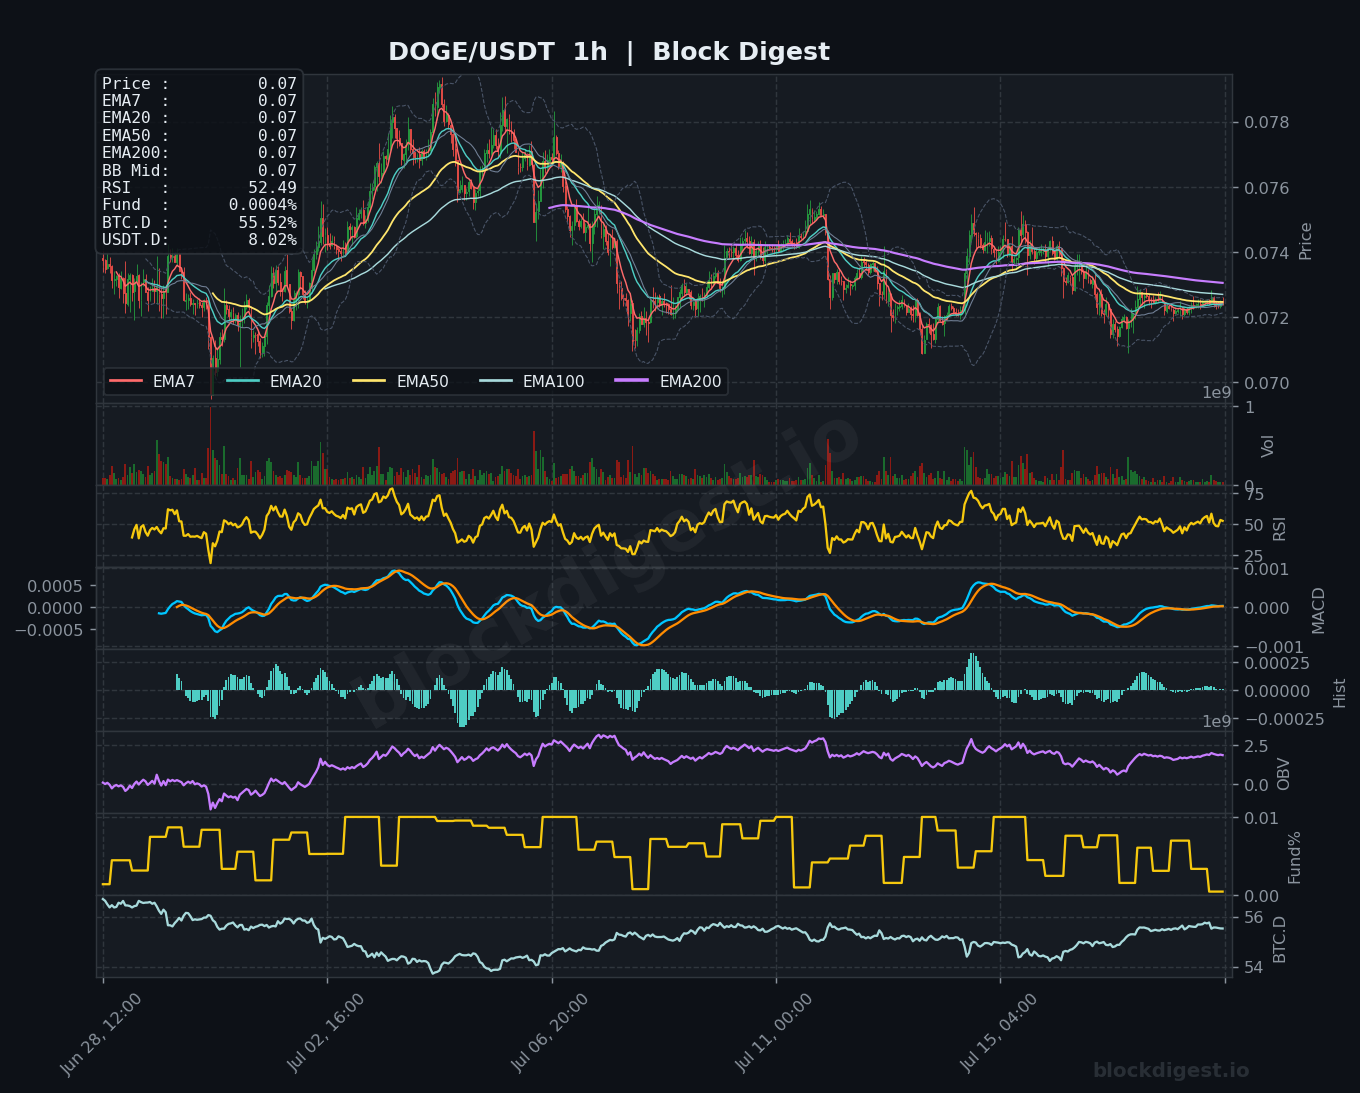
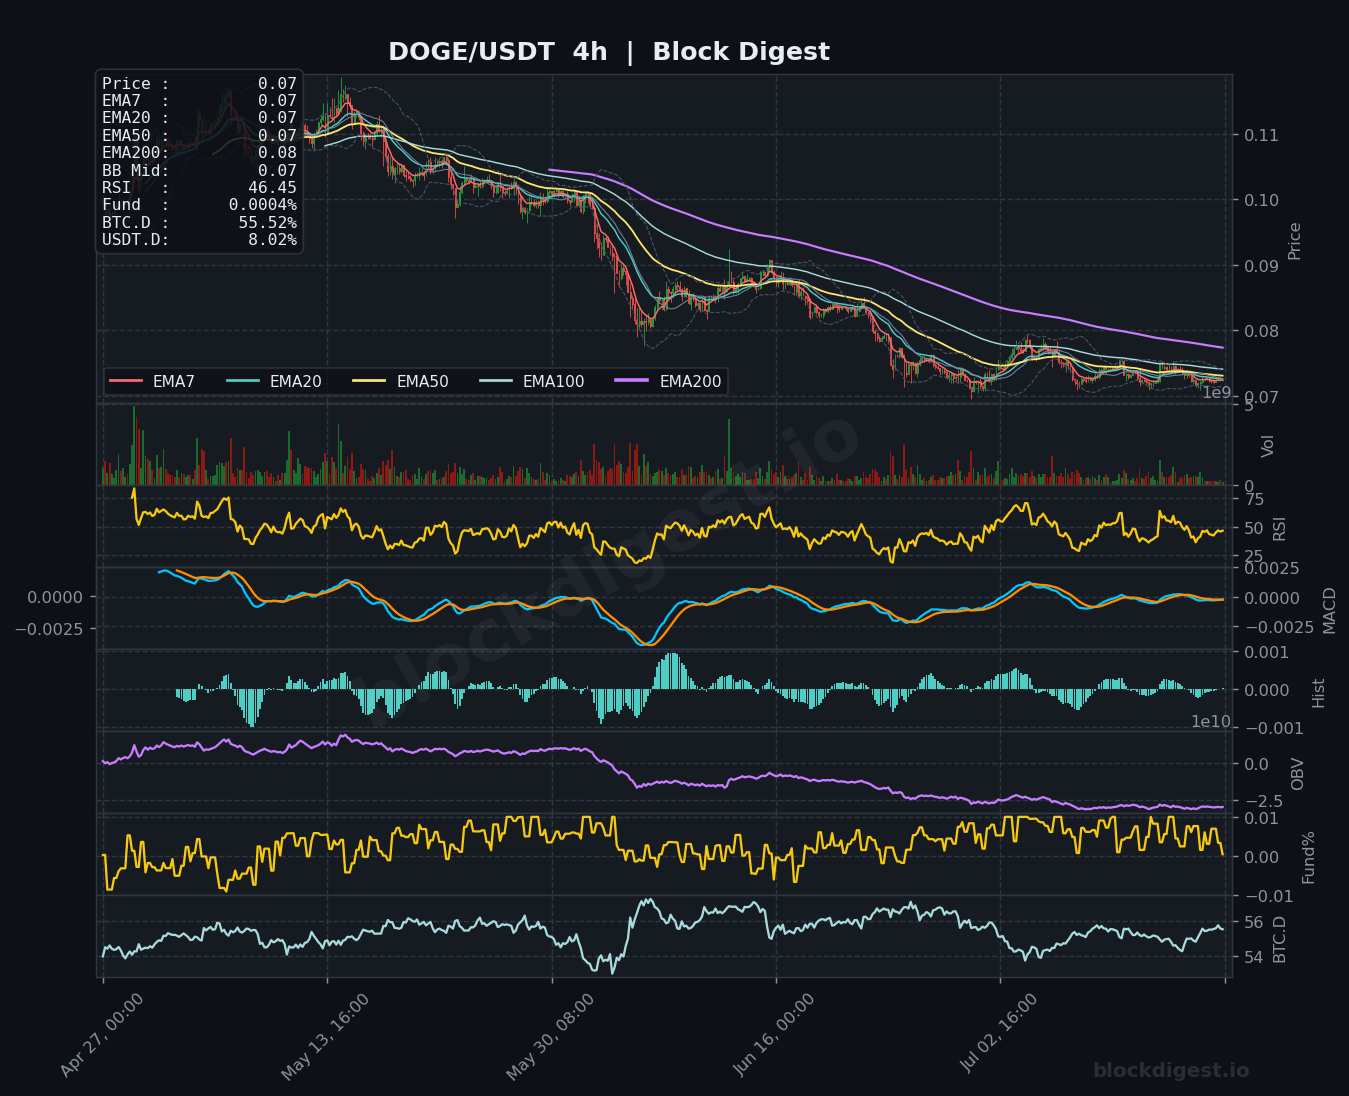
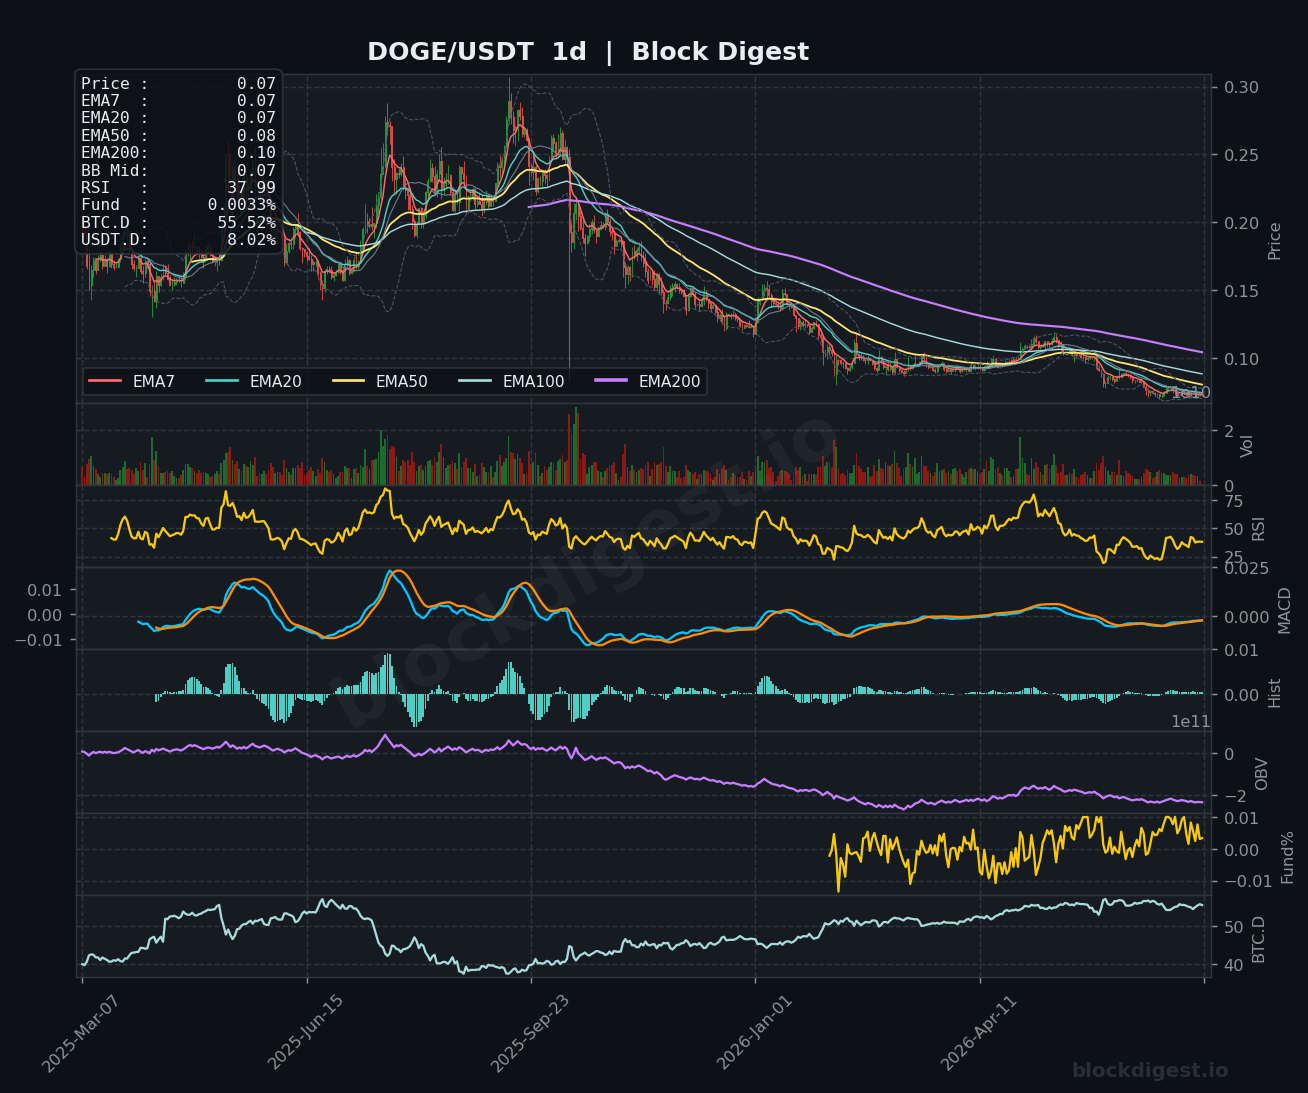
DOGE is trading at $0.0710, near the lower end of its recent consolidation range and well beneath the daily EMA200 at $0.10, underscoring the severity of the longer-term structural downtrend from the $0.25+ highs. The 4h chart shows a clear staircase of lower highs since the peak, with all EMAs in a bearish formation and price compressed below the $0.075 level that previously acted as support. The daily RSI at 37.99 is approaching oversold territory without yet triggering a meaningful bounce, and the MACD on the daily remains in negative territory with the histogram printing near-zero values — consistent with a slow bleed rather than a capitulation. Short-term, the 1h RSI at 52.49 and a recovering MACD signal a mild stabilization attempt, but any rally toward $0.074–$0.076 is likely to encounter stiff resistance from the descending EMA cluster; bias remains bearish.
Litecoin (LTC)
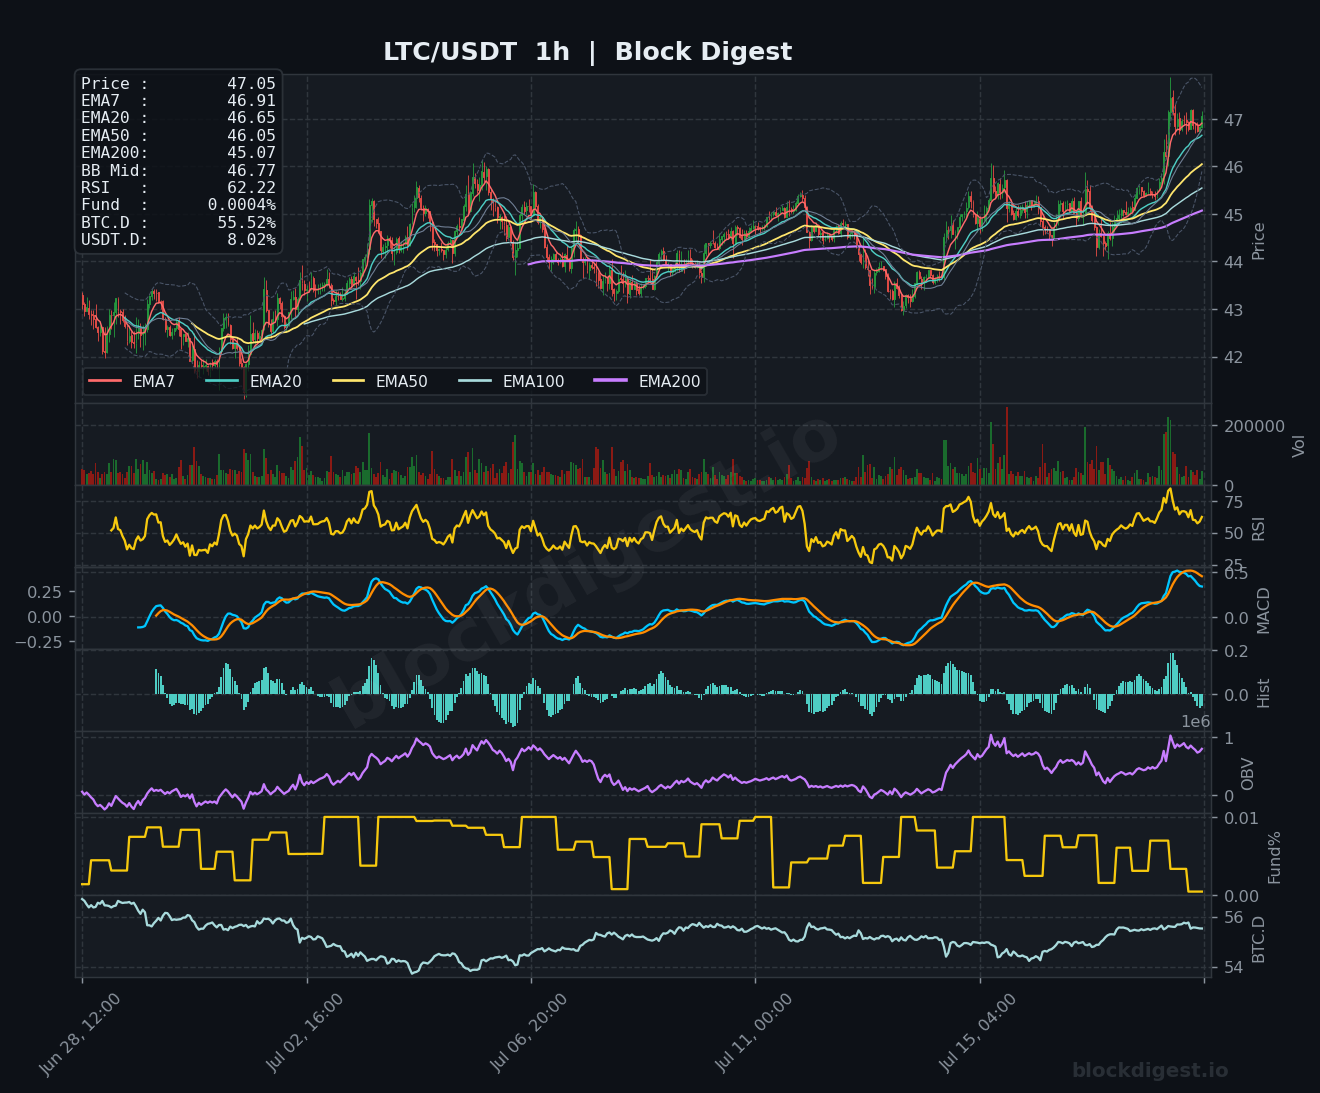
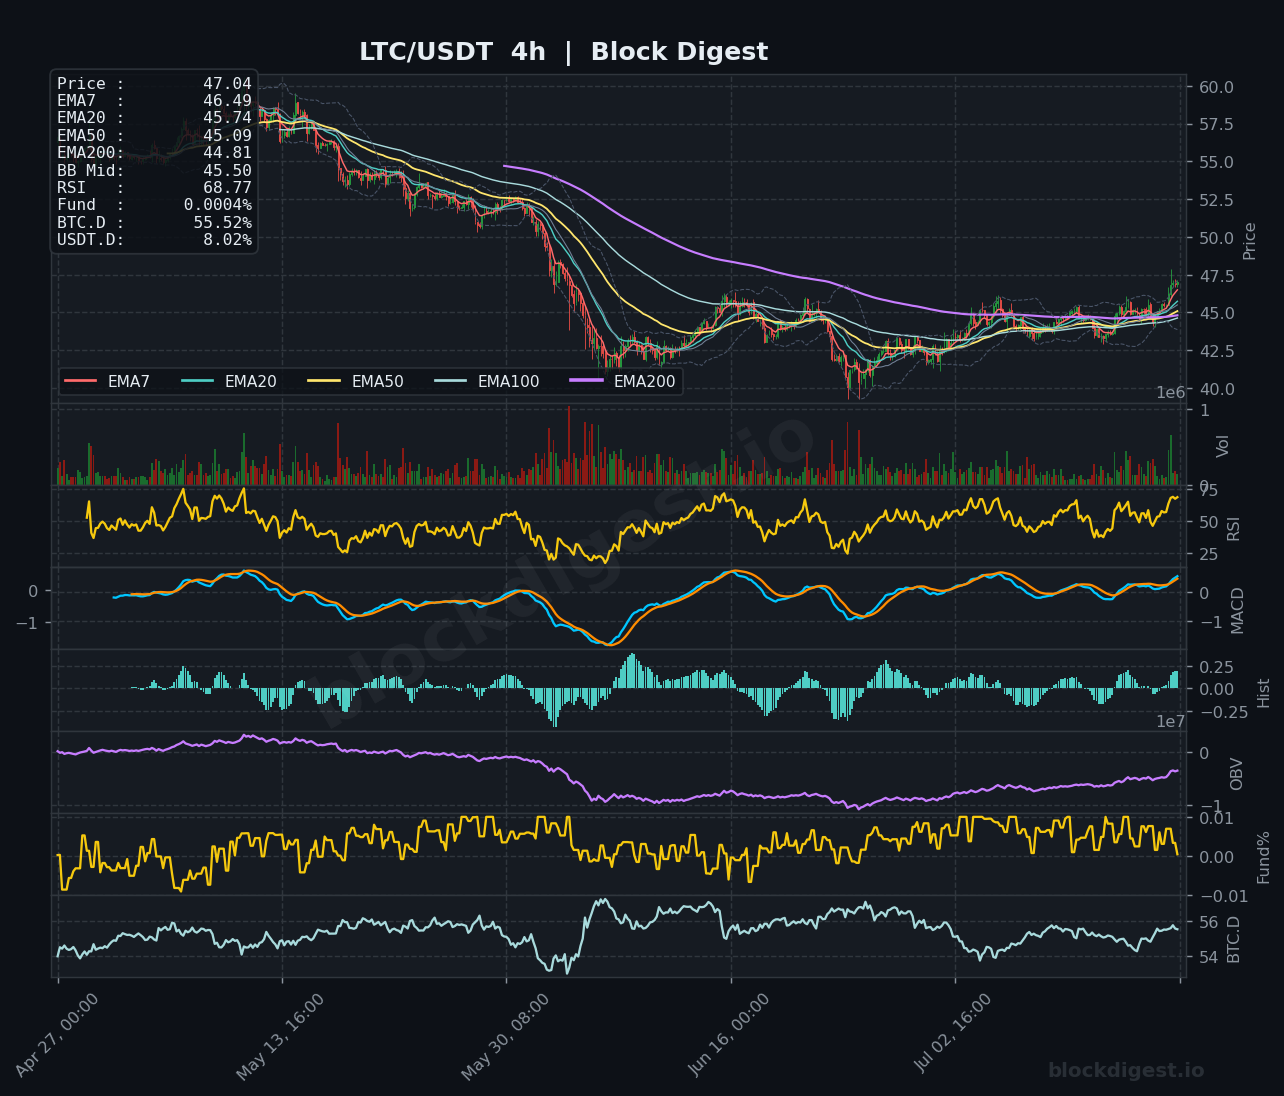
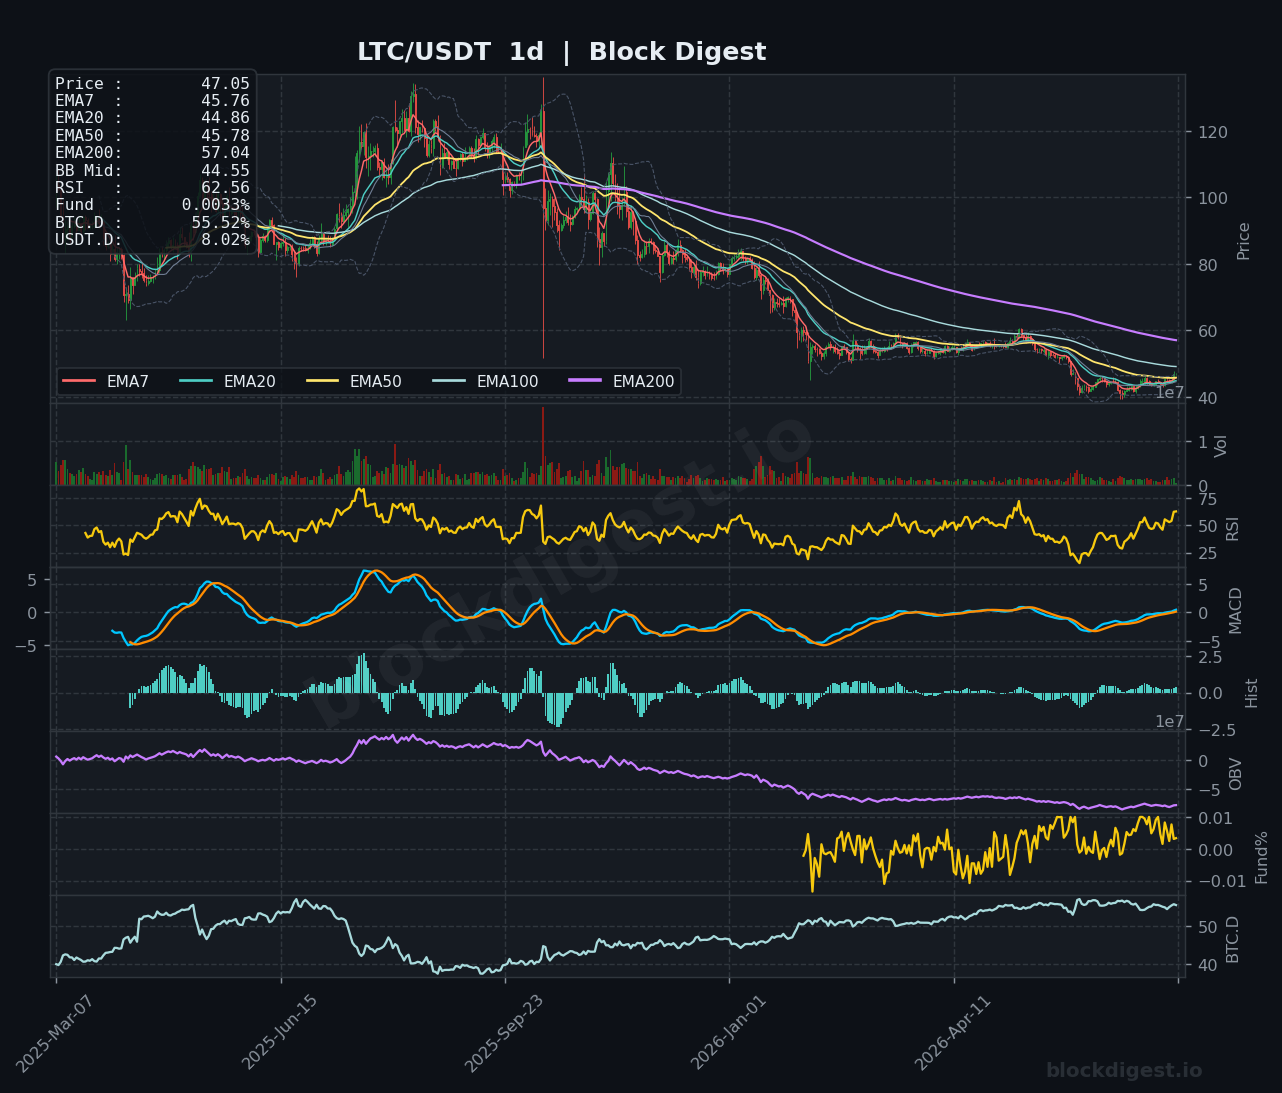
LTC at $47.05 stands out as the relative strength leader in today’s altcoin roundup, with price breaking above all short-term EMAs on the 1h chart (EMA7 at $46.91, EMA20 at $46.65, EMA50 at $46.05, EMA200 at $45.07) in a bullish alignment, accompanied by a rising OBV that confirms genuine buying volume underpinning the move. The 4h RSI at 68.77 is approaching overbought conditions, and the MACD has crossed positively with expanding histogram bars, suggesting the momentum move still has near-term continuation potential — though a brief consolidation or pullback to $45.50–$46.00 would be healthy. The daily chart shows RSI at 62.56 with the MACD signal lines crossing upward, and price has reclaimed the EMA20 ($44.86) and EMA50 ($45.78) on the daily — a constructive development not seen in most other majors today. The key test is whether LTC can sustain above the $47.00 handle and push toward the $48.50–$49.00 resistance zone; the short-term bias is cautiously bullish, the strongest setup in today’s coverage.
TRON (TRX)
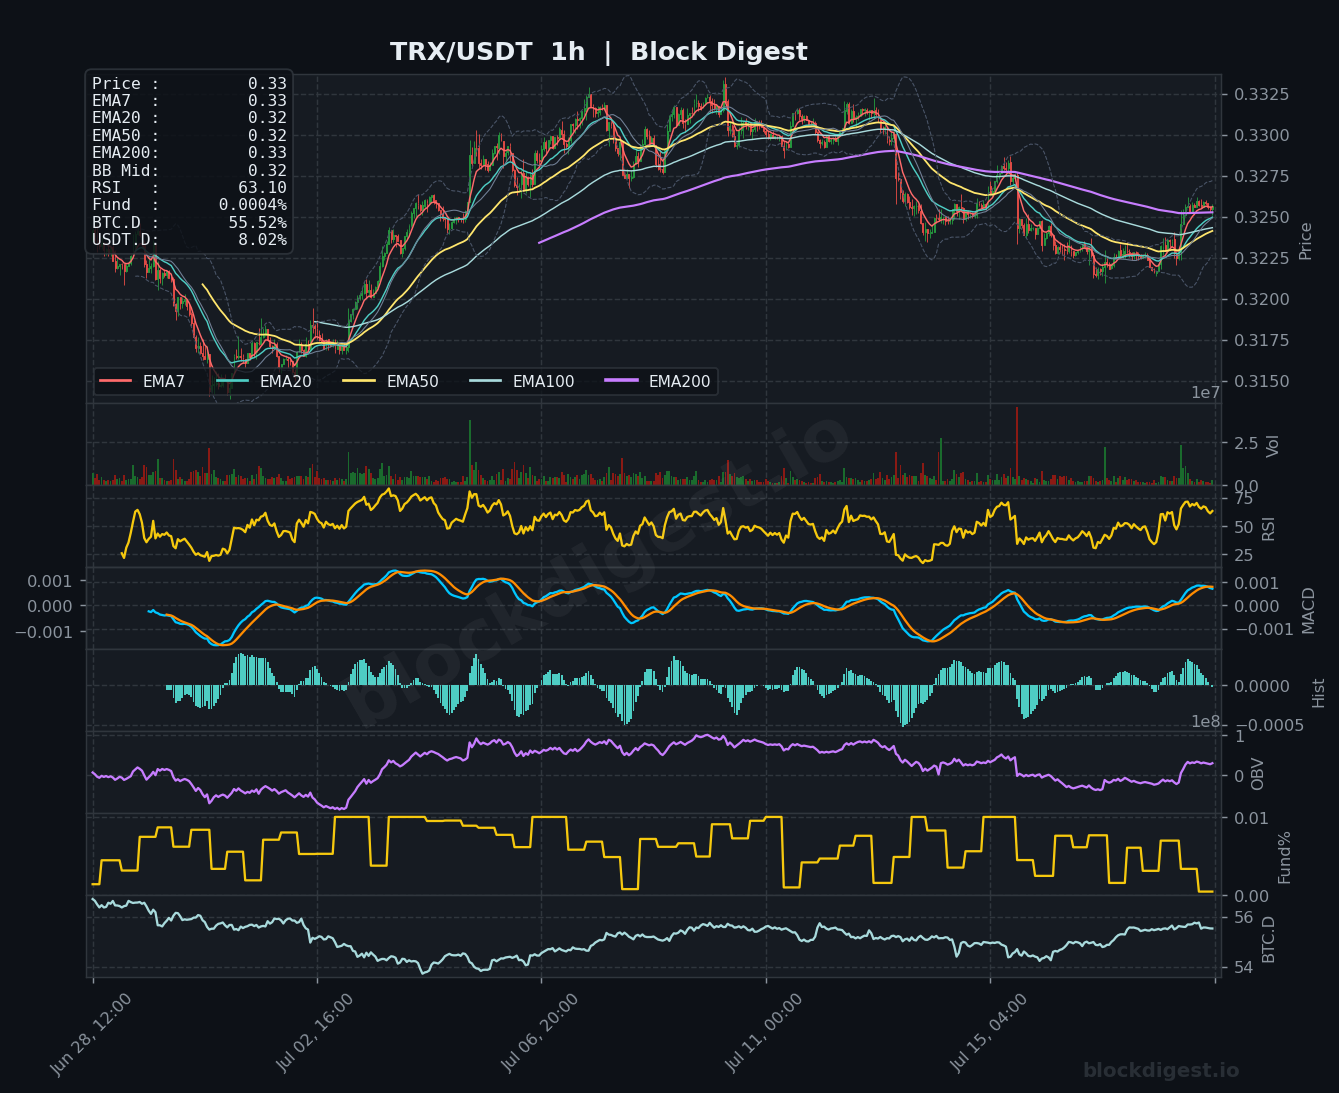
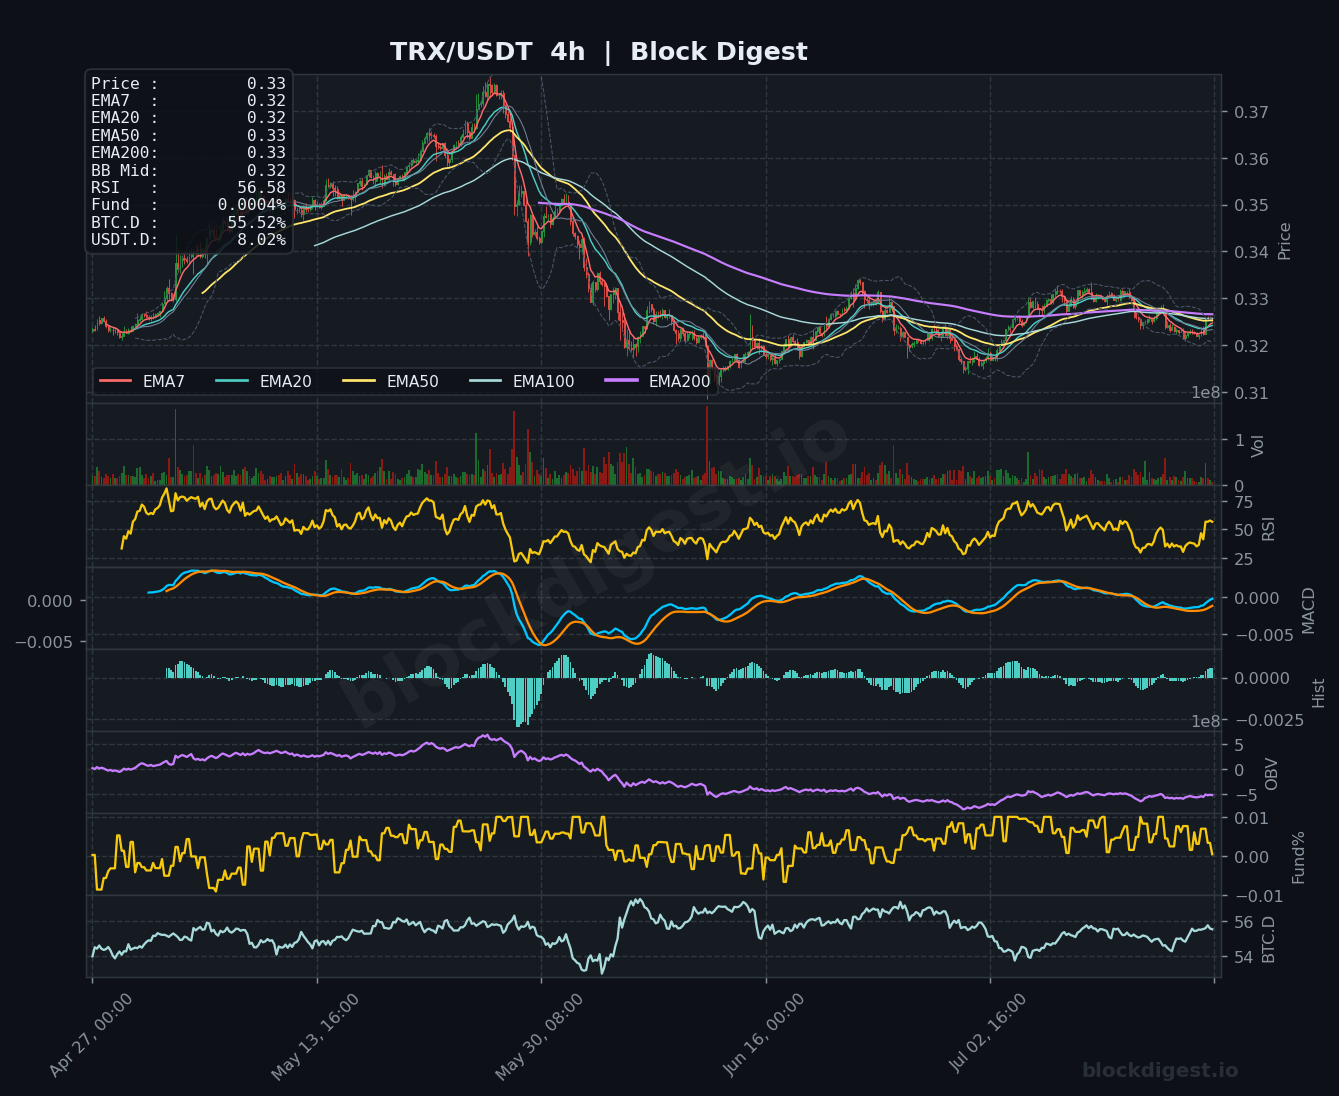
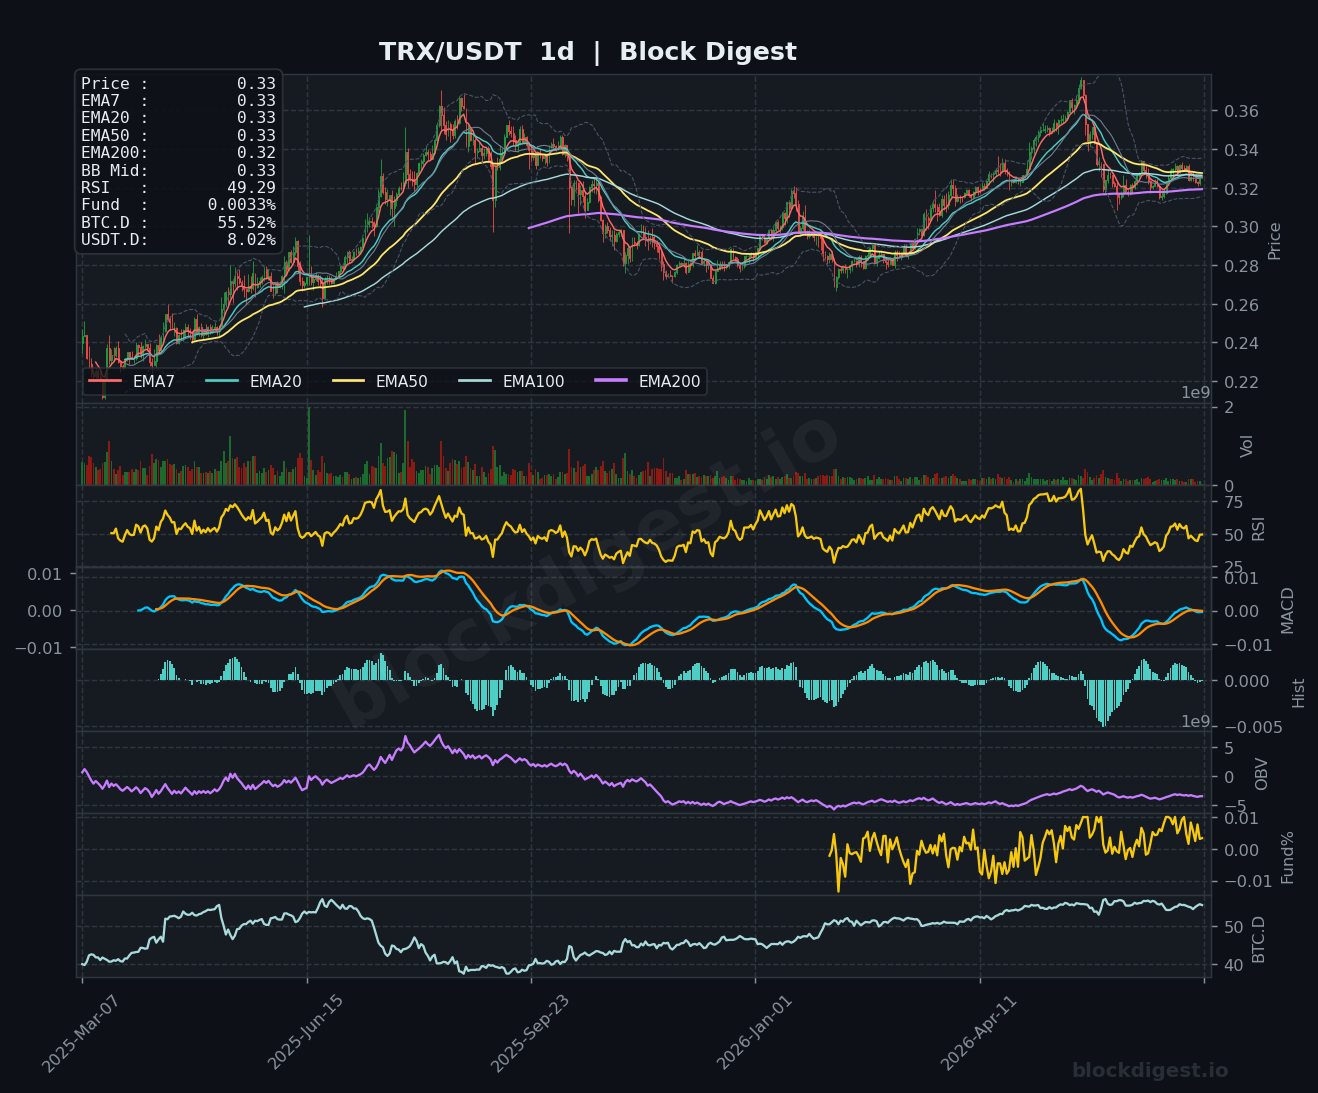
TRX is trading at $0.33, holding relatively firm above its short-term EMA cluster (EMA7 at $0.33, EMA20 at $0.32, EMA50 at $0.32) on the 1h chart, with price testing the upper Bollinger Band — a sign of near-term strength but also a warning of potential mean reversion. The 1h RSI at 63.10 is elevated, with MACD trending upward and OBV on the 1h ticking higher, supporting the near-term bullish lean, though the 4h RSI at 56.58 and a flat MACD histogram suggest the intermediate momentum is merely neutral rather than strongly directional. On the daily chart, RSI at 49.29 and a MACD that has been recovering from negative territory toward the zero line paint a picture of gradual stabilization; notably, TRX’s daily EMA200 at $0.32 is now acting as support rather than resistance — a key structural positive that differentiates it from SOL, XRP, and DOGE. The $0.33–$0.335 zone is near-term resistance; a clean break would target $0.34, while a slip below $0.32 would neutralize the short-term bullish thesis.
Altcoin Outlook
The broader altcoin market is navigating a difficult environment defined by elevated BTC dominance, risk-off capital flows, and geopolitical uncertainty suppressing speculative appetite — conditions that historically favor Bitcoin consolidation over altcoin expansion. Of the six assets covered today, Litecoin presents the cleanest bullish setup with aligned EMAs, rising OBV, and positive MACD across multiple timeframes, while TRON offers a secondary point of relative stability thanks to price holding above its daily EMA200. SOL, XRP, BNB, and DOGE all remain in structurally bearish or at best neutral configurations on the daily, with OBV declining and price well below long-term moving averages. Traders should watch for a potential BTC dominance rollover below 55% as a key trigger for broader altcoin relief, and monitor USDT.D for any decline below 7.80% as an early signal that risk appetite is returning to the market.
Disclaimer: This analysis is for informational purposes only and does not constitute financial advice. Cryptocurrency markets are highly volatile and unpredictable. All trading decisions should be made based on your own research and risk tolerance. Block Digest is not responsible for any financial losses incurred as a result of acting on this content.