BTC Daily Analysis — April 29, 2026
BTC Daily Analysis – April 29, 2026
Market Overview
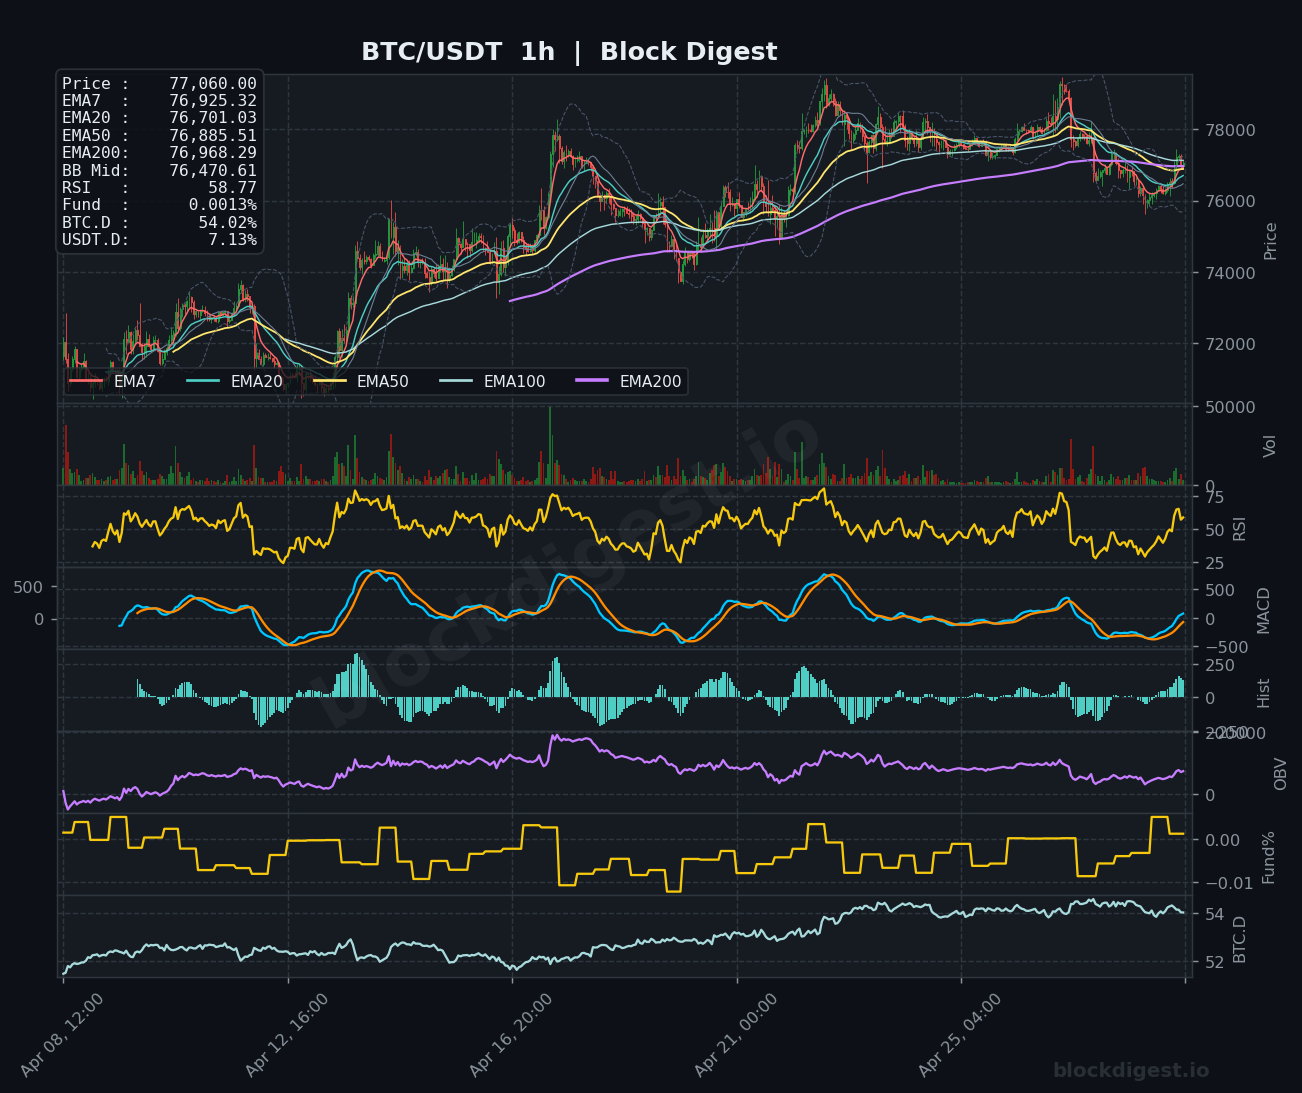
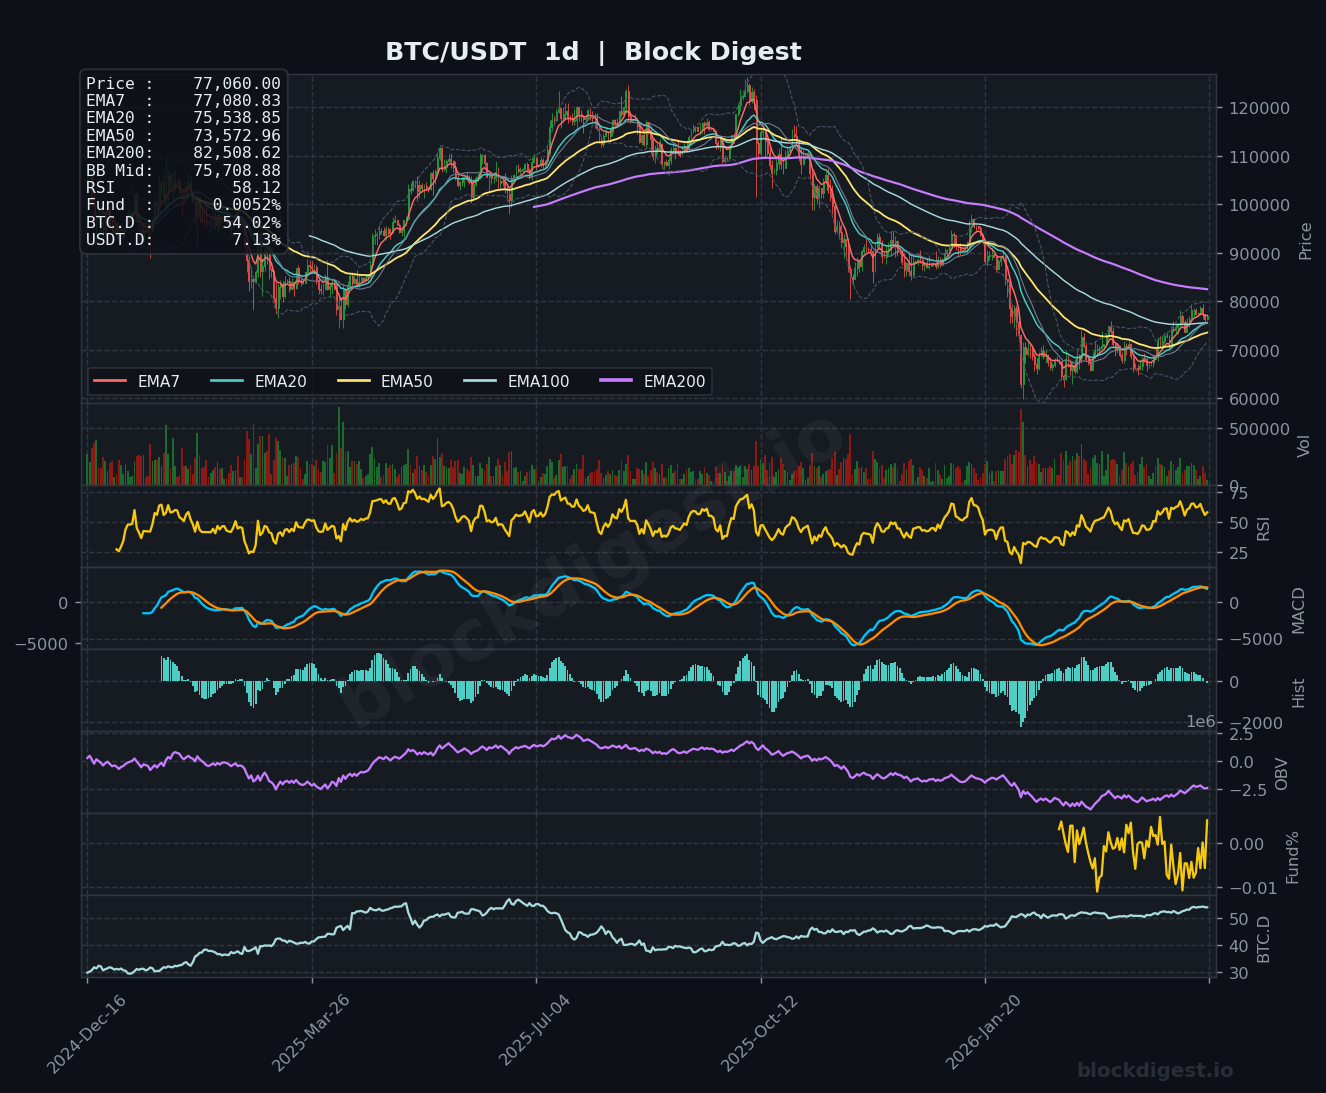
Bitcoin is currently trading at $77,060, positioned slightly above the critical cluster of short-term EMAs while facing significant resistance from higher timeframe moving averages. The price sits above the EMA7 ($77,080 on daily), EMA20 ($75,538), and EMA50 ($73,573), but remains decisively below the EMA200 ($82,509), indicating Bitcoin is still in a technical correction phase despite recent recovery attempts. The Bollinger Band midpoint at $76,470 on the 1-hour chart is providing dynamic support, while price action shows consolidation within a narrow range as the market digests recent volatility and attempts to establish directional conviction.
Multi-Timeframe Confluence
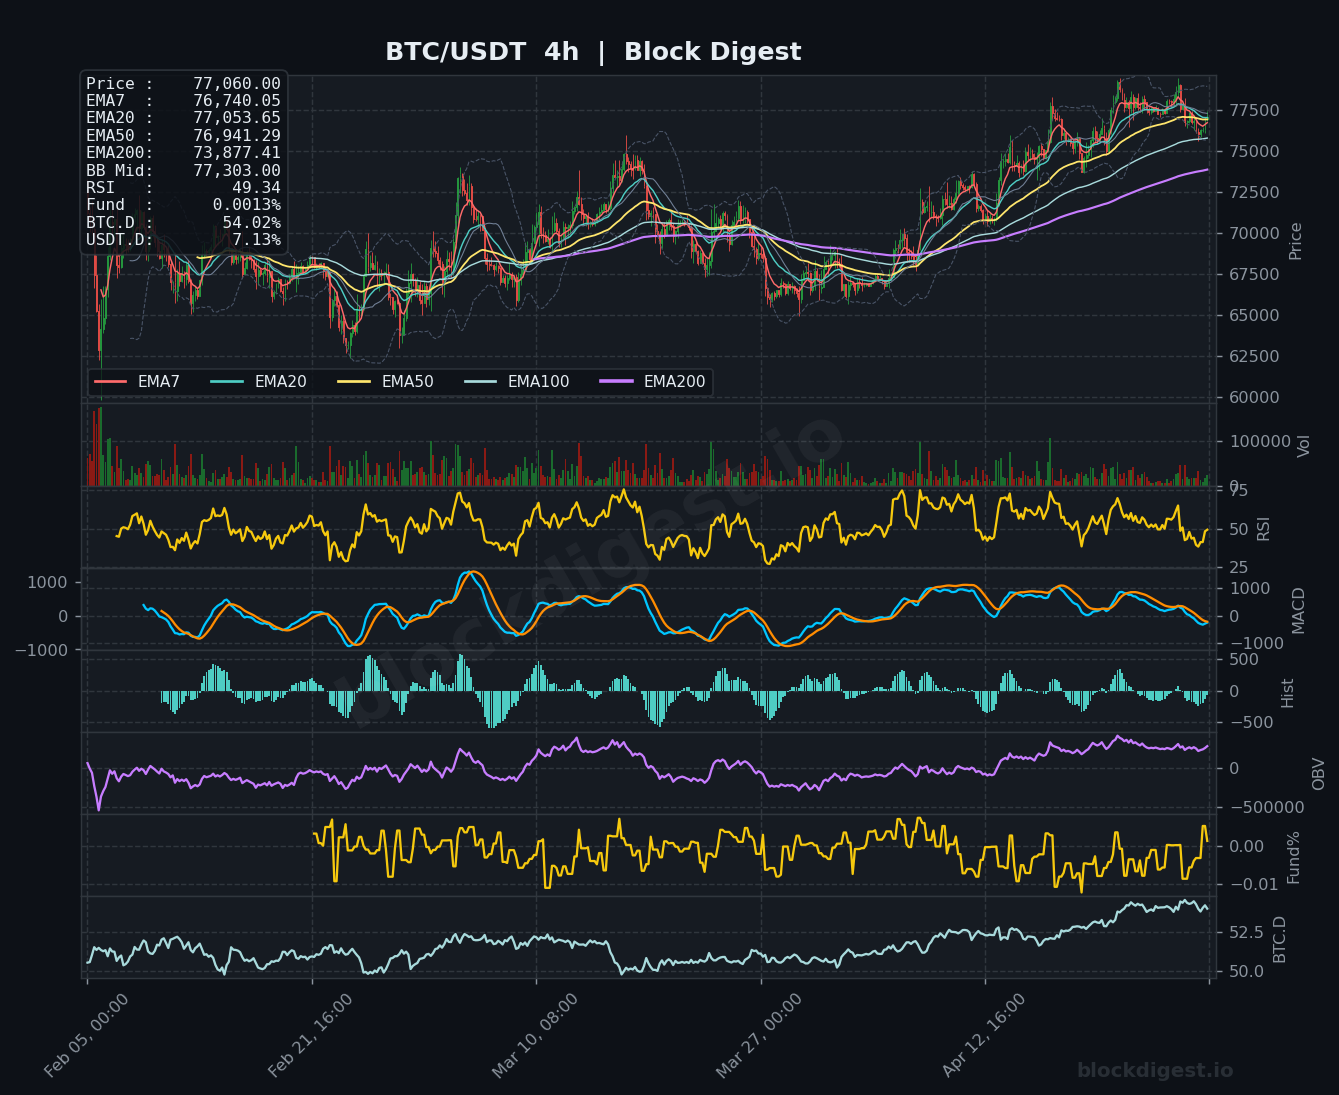
The multi-timeframe analysis reveals a delicate balance between short-term recovery and higher timeframe bearish structure. The 1-hour chart shows price coiling tightly around the $77,000 level with all short-term EMAs converging, suggesting an imminent volatility expansion. The 4-hour timeframe displays a similar structure with price testing above the EMA20 ($77,053) and EMA50 ($76,941), though momentum remains tentative. Most critically, the daily chart reveals price is attempting to reclaim the EMA7 ($77,080) and EMA20 ($75,538) while still trapped well below the EMA200, creating a scenario where short-term bullish momentum contradicts the broader bearish trend established since the prior breakdown from higher levels.
Key Levels to Watch
Resistance:
- $77,300-$77,500: Upper Bollinger Band on the 4-hour chart and recent local highs; a breakout here would signal short-term strength and potentially trigger momentum-based buying
- $79,000-$80,000: A critical resistance zone representing prior consolidation structure and the psychological $80,000 level; clearing this area would mark a significant trend shift
- $82,500-$83,000: The EMA200 on the daily timeframe, representing the most important structural resistance; reclaiming this level would confirm a trend reversal
Support:
- $76,700-$76,900: Confluence of the EMA50 on both 1-hour ($76,885) and 4-hour ($76,941) timeframes, along with the Bollinger Band midpoint providing immediate support
- $75,500-$76,000: The EMA20 on the daily chart ($75,538) and a previous consolidation zone; this level has acted as both support and resistance in recent price action
- $73,500-$74,000: The EMA50 on the daily timeframe ($73,573) representing a critical support zone; a breakdown below this level would likely trigger accelerated selling pressure
Momentum & On-Chain Signals
Momentum indicators present a mixed picture with slight bullish divergences on lower timeframes but continued weakness on the daily. The RSI across all timeframes shows neutral readings—58.77 on 1-hour, 49.34 on 4-hour, and 58.12 on daily—suggesting neither overbought nor oversold conditions but lacking conviction in either direction. The MACD on both the 1-hour and 4-hour charts shows bearish histogram compression near the zero line, indicating diminishing downside momentum but no confirmed bullish crossover yet. On-Balance Volume (OBV) displays a relatively flat trajectory across timeframes, suggesting balanced buying and selling pressure without clear accumulation or distribution. Funding rates remain slightly positive at 0.0013%, indicating mild long bias among perpetual traders but not at extreme levels that would signal overcrowded positioning.
BTC Dominance & Market Sentiment
Bitcoin Dominance stands at 54.02%, reflecting a modest risk-off posture in the broader crypto market where capital is consolidating into BTC rather than flowing into higher-risk altcoins. This level suggests market participants remain cautious, preferring the relative safety of Bitcoin during uncertain price action. USDT Dominance at 7.13% indicates moderate stablecoin positioning, neither extremely elevated (which would signal fear) nor extremely low (which would signal aggressive risk-on behavior). The combination of these metrics suggests a market in wait-and-see mode, with participants maintaining defensive positioning while monitoring for clearer directional signals before committing significant capital.
Risk Scenarios
Bullish case: A decisive break above $77,500 accompanied by expanding volume and a positive MACD crossover on the 4-hour chart would confirm short-term bullish momentum, potentially targeting the $79,000-$80,000 resistance zone. Sustained trading above the $76,900 support cluster with improving RSI readings above 60 across timeframes would validate this scenario, with the ultimate bullish confirmation being a reclaim of the daily EMA200 at $82,500.
Bearish case: Failure to hold the $76,700-$76,900 support zone, particularly if accompanied by increasing volume and a MACD bearish crossover, would likely trigger a retest of $75,500. A breakdown below $75,000 with deteriorating momentum indicators would expose the $73,500-$74,000 zone, with further downside potentially accelerating toward the $70,000 psychological level if selling pressure intensifies.
Outlook
Bitcoin’s technical structure suggests a critical inflection point is approaching, with the market coiling within a tightening range that typically precedes significant directional movement. The immediate 24-48 hour period will likely determine whether the recent recovery attempt gains traction or falters. Key triggers to monitor include volume expansion accompanying any breakout attempt, MACD crossovers on the 4-hour timeframe, and price behavior around the $77,500 resistance and $76,700 support levels. A sustained break and close above $77,500 would shift near-term bias bullish, while failure to hold $76,700 would reinstate bearish pressure. Given the compression across all timeframes and neutral momentum readings, traders should exercise caution and wait for confirmed breakout signals before committing to directional positions, as false breakouts remain a significant risk in this environment.
Disclaimer: This analysis is for informational purposes only and does not constitute financial advice. Cryptocurrency markets are highly volatile and unpredictable. All trading decisions should be made based on your own research and risk tolerance. Block Digest is not responsible for any financial losses incurred as a result of acting on this content.
Charts