Ethereum Daily Analysis: Ethereum at $2,023 in Deeply Oversold Territory
Market Overview
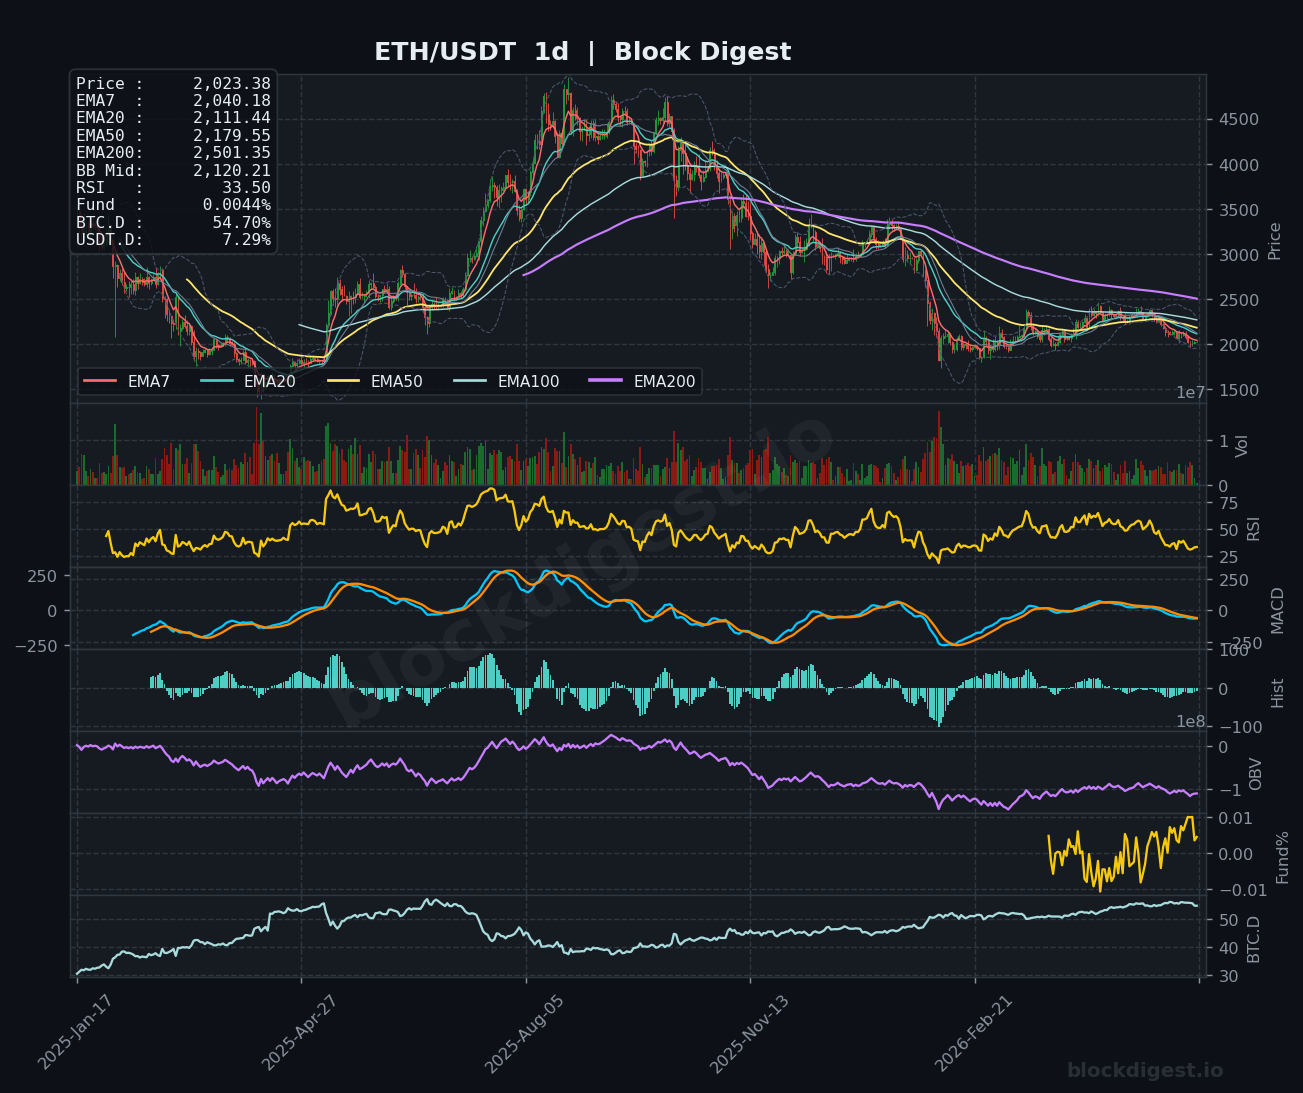
Ethereum is trading at $2,023 as of May 31, 2026, sitting in deeply oversold territory relative to its all-time high of $4,953 reached in August 2025 — a drawdown of approximately 59%. On the daily timeframe, price is trading well below all major EMAs: the EMA7 at $2,040, EMA20 at $2,111, EMA50 at $2,179, EMA100 near $2,300, and the EMA200 at $2,501 — a textbook bearish EMA stack with no signs of imminent reversal. The Bollinger Band midline on the daily sits at $2,120, and price is hugging the lower band, indicative of sustained selling pressure with no meaningful mean-reversion attempt. The dominant trend on the daily timeframe remains firmly bearish, with the structure of lower highs and lower lows intact since the August 2025 peak.
Multi-Timeframe Confluence
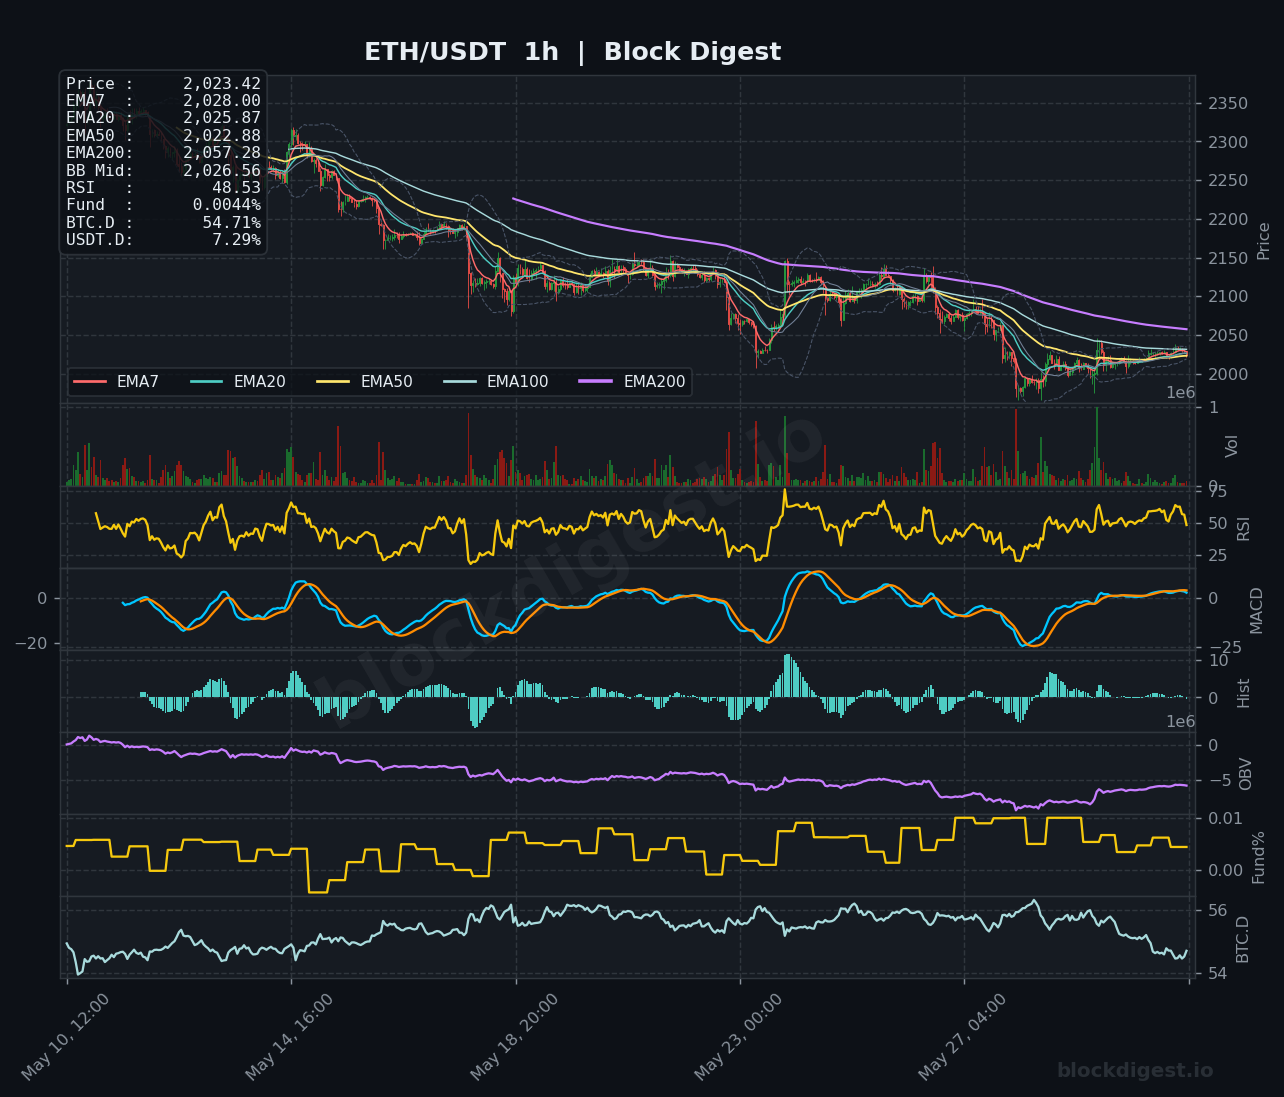
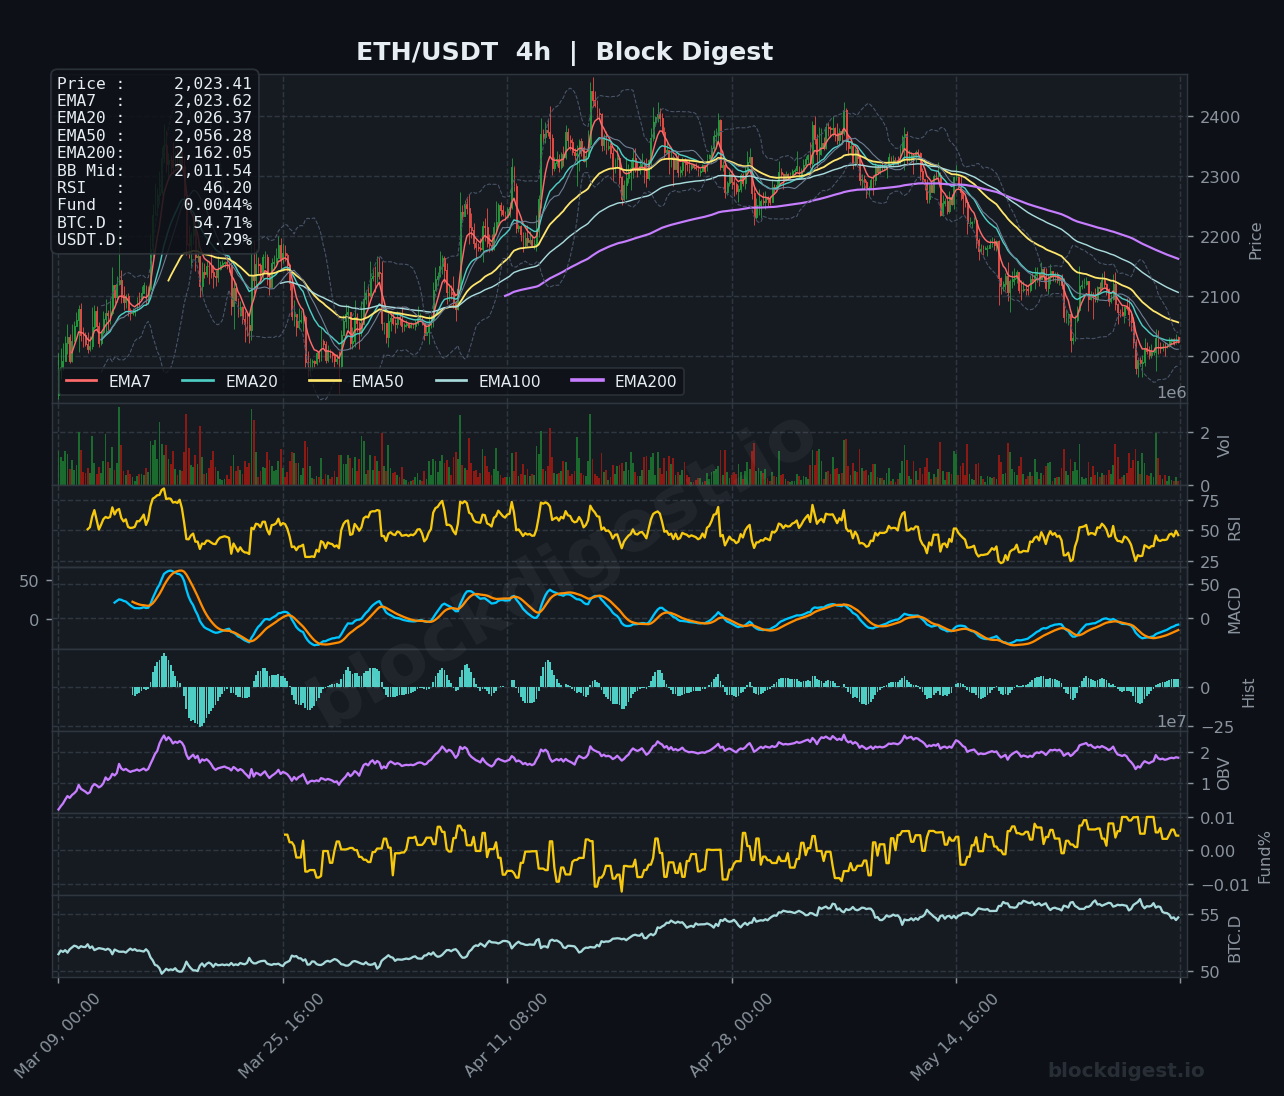
Across all three timeframes, the bearish structure is broadly consistent, offering little divergence to suggest an imminent trend reversal. On the 1-hour chart, price at $2,023 is compressing tightly around the EMA7 ($2,028), EMA20 ($2,026), and EMA50 ($2,023), with the EMA200 declining steeply at $2,057 — acting as a dynamic resistance ceiling overhead. The 4-hour chart reinforces this picture: price has broken below the EMA50 ($2,056) and EMA200 ($2,162), with the BB midline at $2,011 now serving as a near-term pivot. Short-term momentum on the 1-hour is attempting a modest consolidation after a sharp selloff, but this appears corrective rather than impulsive — the higher-timeframe bearish trend retains clear dominance.
Key Levels to Watch
- Resistance: $2,057 — the descending 1-hour EMA200, which has capped multiple recovery attempts and represents the first meaningful overhead obstacle; $2,111 — daily EMA20, a key moving average that has acted as resistance during the broader downtrend; $2,179 — daily EMA50, which aligns with a prior consolidation zone and would need to be reclaimed to alter the bearish thesis.
- Support: $2,000 — a major psychological round number and near-term floor that the market has tested recently; $1,980–$1,990 — the lower Bollinger Band region on the 4-hour chart, representing the next technical support if $2,000 fails; $1,900 — a broader structural support level visible on the daily chart from the early 2026 base-building phase.
Momentum & On-Chain Signals
The daily RSI at 33.50 is approaching oversold territory but has not yet triggered a clear reversal signal, suggesting continued downside pressure remains possible before exhaustion. On the 4-hour, RSI at 46.20 sits in neutral-to-bearish territory, while the 1-hour RSI at 48.53 shows a marginal uptick, consistent with the short-term consolidation attempt. The daily MACD remains in negative territory with the histogram printing persistent bearish bars, and no bullish crossover is visible across any timeframe. The OBV on the daily timeframe has declined sharply from its 2025 highs and continues to trend lower, firmly indicating net distribution — a concerning signal that suggests institutional and large-participant selling has not abated. The funding rate of +0.0044% across timeframes is modestly positive, implying the futures market remains slightly net long, which adds a degree of liquidation risk if support at $2,000 gives way.
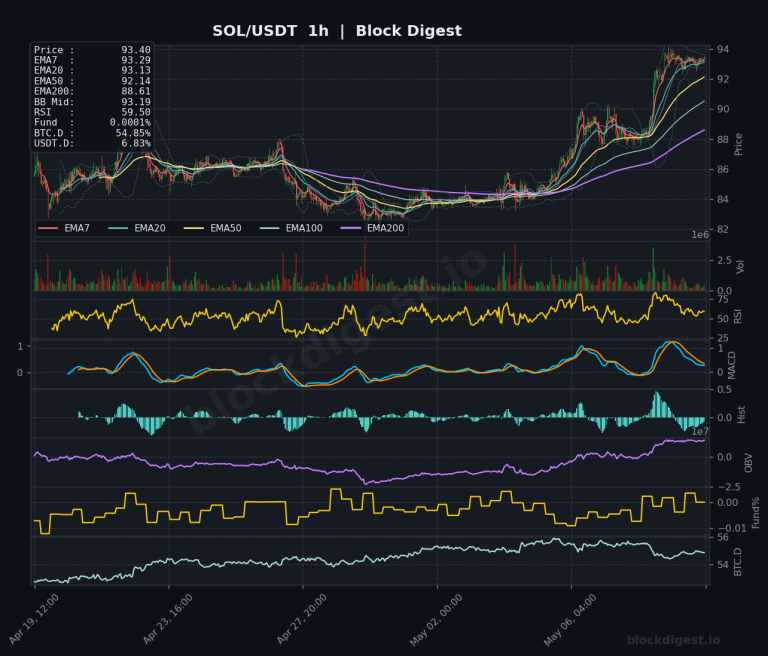
BTC Dominance & Market Sentiment
BTC dominance sits at 54.71% on the 1-hour and 4-hour charts, with the daily chart showing dominance in a sustained uptrend from the low 40s — a clear indication that capital continues to rotate toward Bitcoin and away from altcoins including ETH. USDT dominance at 7.29% remains elevated, signaling that a significant portion of market participants remain in cash or stablecoins rather than redeploying into risk assets. For Ethereum specifically, the combination of rising BTC.D and high USDT.D is a headwind, as it implies continued relative underperformance and muted buying interest — consistent with the Crypto Fear & Greed Index’s reading of 25 (Extreme Fear) and confirmed by spot ETF outflows noted in recent market reports.
Risk Scenarios
- Bullish case: A decisive reclaim of the $2,057 EMA200 on the 1-hour chart, followed by a move through $2,111 on rising volume, would suggest the short-term correction is exhausted and could open a path toward the $2,179–$2,200 range. Confirmation would require a bullish MACD crossover on the 4-hour and a sustained RSI push above 50 on the daily.
- Bearish case: A clean breakdown and daily close below the $2,000 psychological level would expose the $1,980–$1,990 support cluster, and a failure there accelerates downside risk toward the $1,900 structural level. This scenario would be reinforced by continued ETF outflows, deteriorating sentiment, and BTC dominance pushing above 56%.
Outlook
The path of least resistance for ETH remains to the downside in the near term, with price trapped below all major EMAs on every timeframe and the daily RSI not yet deeply enough oversold to compel a durable bounce. The key trigger to watch over the next 24–48 hours is whether the $2,000 level holds as a psychological support or capitulates under renewed selling pressure — a close below that level on the daily would materially shift the risk profile lower. Any thesis change to the upside requires at minimum a reclaim of $2,111 (daily EMA20) with conviction and volume, alongside a positive shift in macro sentiment and a reversal in ETF flow data. Until those conditions are met, any short-term relief rallies toward $2,057–$2,080 should be viewed as potential distribution opportunities within the context of an ongoing bear structure.
Disclaimer: This analysis is for informational purposes only and does not constitute financial advice. Cryptocurrency markets are highly volatile and unpredictable. All trading decisions should be made based on your own research and risk tolerance. Block Digest is not responsible for any financial losses incurred as a result of acting on this content.