Weekly Market Overview
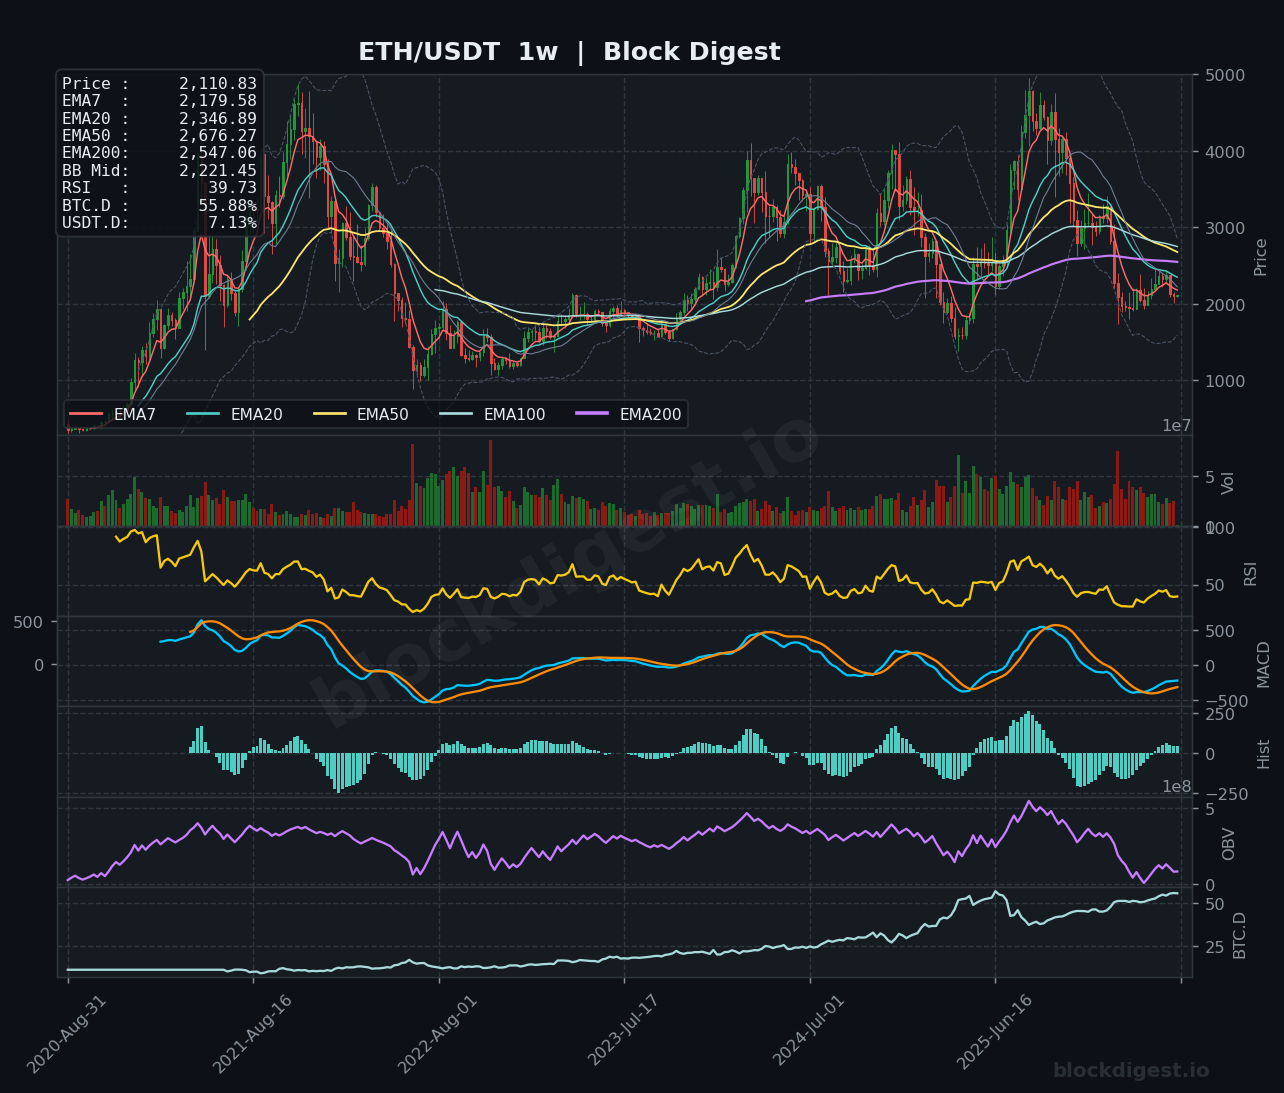
ETH/USDT closed the week around $2,110, extending a prolonged downtrend that has seen price shed roughly 50% from its 2025 highs near $4,500. The current weekly candle is printing in deeply bearish territory, with price trading well below all major moving averages on both the weekly and daily timeframes. The recent macro relief — driven by geopolitical de-escalation and positive sentiment around institutional ETF inflows into ETH — has offered only a modest bounce, failing to produce any meaningful structural reversal. Despite Ethereum recording $1.6 billion in ETF inflows and a year-high above $3,800 earlier in the cycle, the chart structure remains technically damaged and under significant distribution pressure.
Higher Timeframe Structure
On the weekly chart, the EMA stack tells a starkly bearish story: price at $2,110 sits below the EMA7 ($2,179), EMA20 ($2,346), EMA50 ($2,676), and EMA200 ($2,547), with all averages sloping downward in a full bearish alignment. The Bollinger Band midline at $2,221 is now acting as overhead resistance, and price is hugging the lower band — a sign of persistent selling pressure rather than an oversold bounce opportunity. Historically, the last time ETH traded in this EMA configuration was during the 2022 bear market, making the current zone a critical macro test. The weekly RSI at 39.73 is approaching oversold territory but has not yet confirmed a capitulation low, suggesting further downside cannot be ruled out.
Multi-Timeframe Confluence
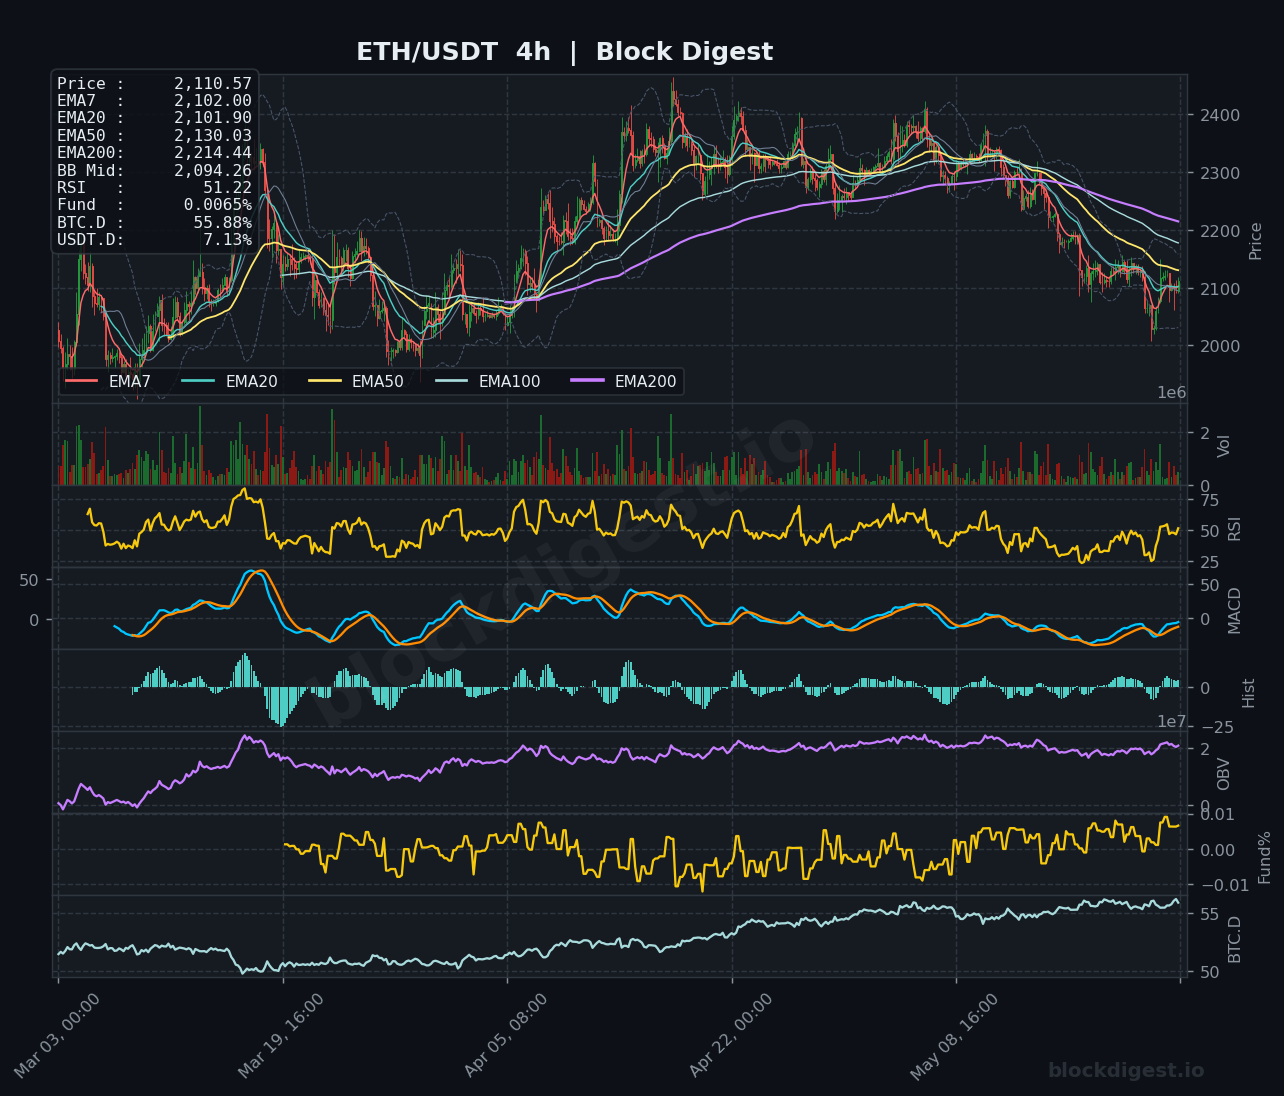
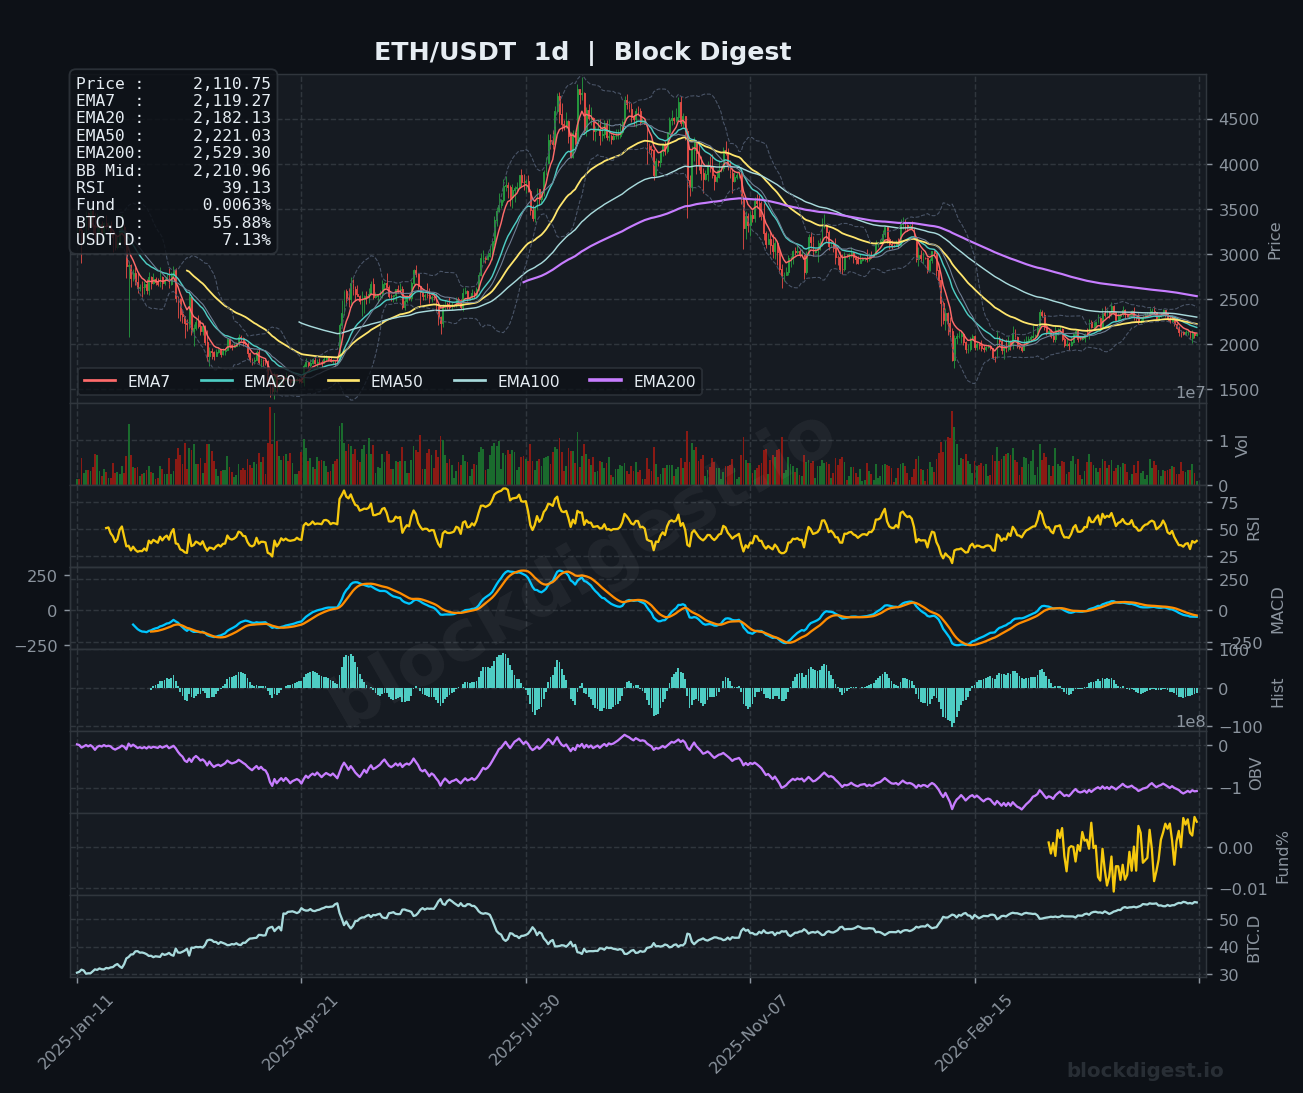
Across all three timeframes, the bearish thesis is consistently reinforced, with no meaningful divergence between the weekly, daily, and 4-hour structures. On the daily chart, the EMA200 at $2,529 remains a distant overhead target, while the EMA7 ($2,119) and EMA20 ($2,182) have already rolled over and are providing immediate resistance just above current price. The 4-hour chart does show price briefly reclaiming the EMA7 ($2,102) and EMA20 ($2,101), offering a micro-bullish signal, but the EMA50 at $2,130 on that same timeframe represents the first real test for any intraweek recovery attempt. Until daily structure shows a convincing reclaim of at least the $2,220–$2,350 zone, any 4-hour strength should be treated as a counter-trend move.
Key Weekly Levels
- Weekly Resistance:
- $2,221 — Bollinger Band midline and weekly BB Mid; first structural ceiling
- $2,346 — Weekly EMA20, the clearest line-in-the-sand for trend reassertion
- $2,529–$2,547 — Weekly EMA200 / EMA50 cluster; major macro resistance zone
- Weekly Support:
- $2,000 — Psychological round number and recent structural low; critical defense zone
- $1,800–$1,850 — Next meaningful demand area visible on the weekly chart, aligning with 2023 consolidation structure
- $1,500–$1,600 — Deep support and multi-year demand zone; only relevant in an accelerated breakdown scenario
Momentum & Volume Analysis
The weekly RSI at 39.73 is hovering just above the oversold threshold (30), reflecting sustained bearish momentum but not yet indicating a panic-driven bottom. The weekly MACD remains deeply negative with histogram bars still printing bearish, though there is a slight narrowing that warrants monitoring for a potential crossover signal in coming weeks. On the daily timeframe, RSI sits at a more concerning 39.13, also failing to bounce convincingly, while the 4-hour RSI at 51.22 is the one bright spot — it has reclaimed the midline, suggesting short-term buyers are attempting to stabilize price. OBV across all timeframes confirms distribution: the weekly OBV has been in a steady decline since the 2025 peak, and the daily OBV reflects a series of lower lows, indicating persistent net selling. The funding rate at +0.0065% is marginally positive, suggesting the market is not in extreme short positioning — which paradoxically means there’s no significant short-squeeze fuel available to power a sharp relief rally.
BTC Dominance & Altcoin Implications
BTC dominance at 55.88% remains elevated and, critically, on an uptrend visible across both the 4-hour and weekly BTC.D panels — a structurally unfavorable backdrop for ETH and the broader altcoin market. USDT dominance at 7.13% suggests a meaningful portion of capital remains sidelined in stablecoins, indicating risk-off positioning has not fully unwound. For ETH to mount a sustained recovery, BTC.D would need to show a confirmed rollover below the 54–55% range, which would signal capital rotating back into altcoins; until that happens, ETH is likely to continue underperforming on a relative basis.
Risk Scenarios
- Bull case: A sustained reclaim of the $2,221 BB midline on a weekly close, supported by continued ETH ETF inflows and a softening in U.S. bond yields, could trigger a relief rally toward the $2,346 EMA20 and eventually the $2,529–$2,547 EMA cluster. Confirmation of a BTC dominance rollover and a positive shift in daily MACD would strengthen this scenario materially, with the potential to retest the $2,800–$3,000 range over a 4–6 week horizon.
- Bear case: Failure to hold the $2,000 psychological support, particularly on a weekly closing basis, would open the door to a deeper retracement toward $1,800–$1,850. Persistent BTC ETF outflows, rising U.S. 30-year yields above 5%, and continued Fed policy uncertainty could amplify selling pressure, with the extreme downside scenario targeting the $1,500–$1,600 demand zone last tested in late 2023.
Weekly Outlook
ETH enters the week of May 25, 2026 in a technically precarious position — trading below all major weekly EMAs, with momentum indicators hovering near oversold without confirming a reversal, and OBV in clear decline. The immediate focus will be whether bulls can defend the $2,000 psychological level and push back above the $2,221 BB midline to demonstrate any real structural intent. Key catalysts to monitor this week include Federal Reserve commentary surrounding Powell’s impending term expiration, U.S. bond yield movements — particularly the 30-year approaching the critical 5% threshold — and the continuation or reversal of ETH ETF flow trends. Given the weight of macro headwinds and the bearish EMA alignment across all timeframes, the directional bias for the week leans cautiously bearish to neutral, with the most likely path being continued range-bound price action between $2,000 and $2,220. Traders should treat any bounce toward the $2,220–$2,350 region as a potential shorting opportunity unless accompanied by a decisive volume expansion and daily MACD crossover confirmation.
Disclaimer: This analysis is for informational purposes only and does not constitute financial advice. Cryptocurrency markets are highly volatile and unpredictable. All trading decisions should be made based on your own research and risk tolerance. Block Digest is not responsible for any financial losses incurred as a result of acting on this content.
Stay Ahead of the Market
Follow BlockDigest for crypto market intelligence, research and real-time updates.