Altcoin Daily Analysis: BTC Dominance 54.24%, Capital Parked in Stablecoins
Market Context
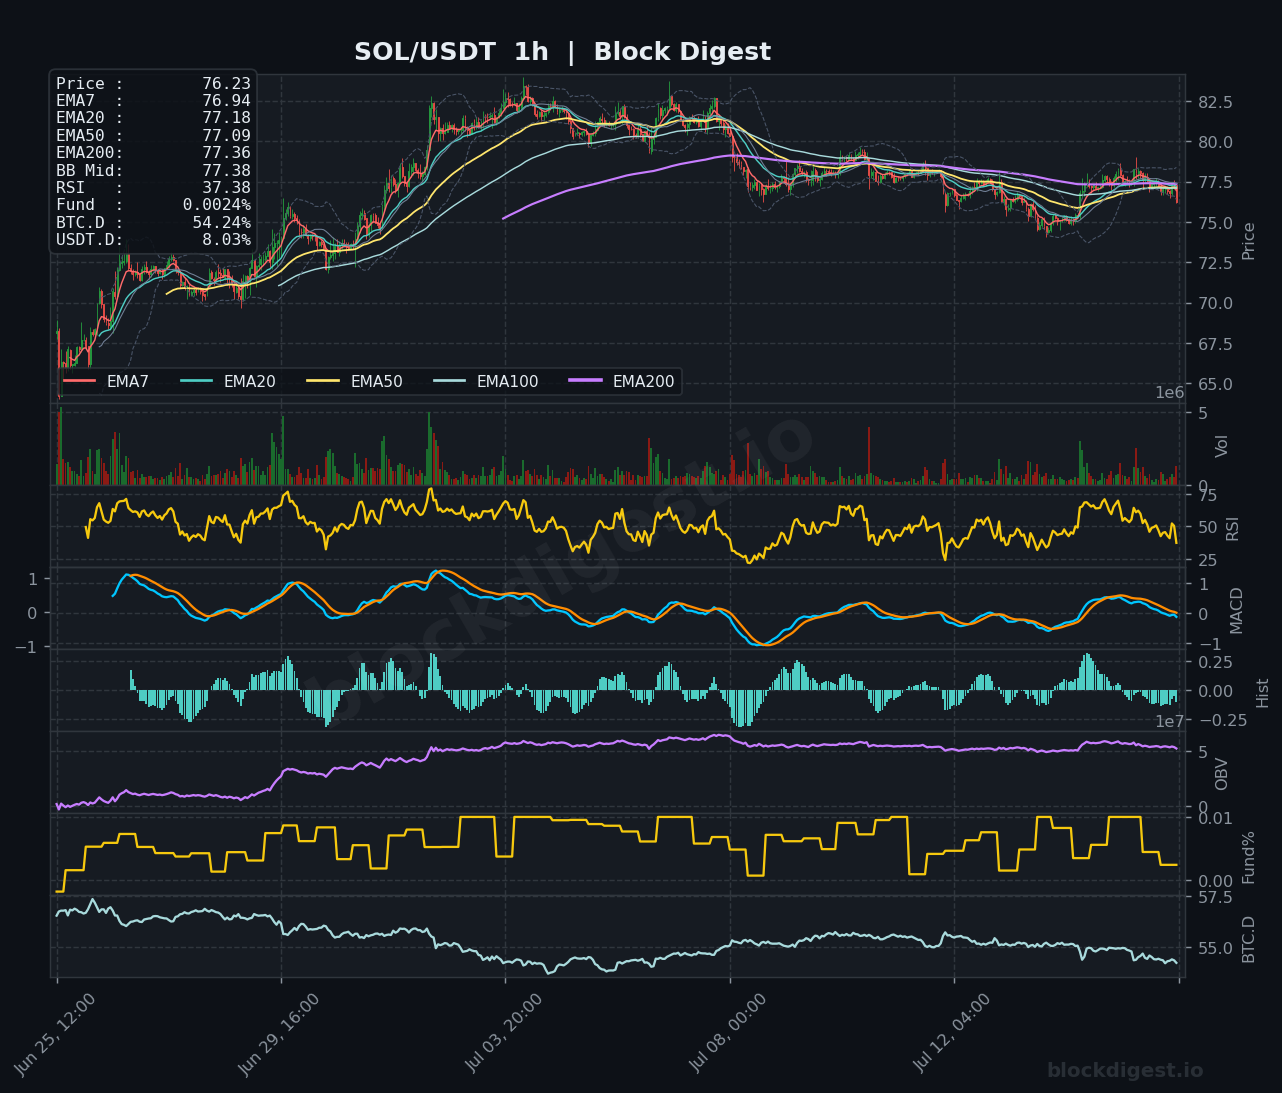
The altcoin market is navigating a broadly risk-off environment as of July 16, 2026, with BTC dominance holding at 54.24% — a level that historically suppresses meaningful altcoin outperformance. USDT dominance at 8.03% signals that a significant pool of capital remains parked in stablecoins, reflecting persistent caution rather than active deployment into risk assets. The CMC Fear index sitting at 34 corroborates what the charts show: consolidation at depressed levels with little conviction on either side.
Solana (SOL)
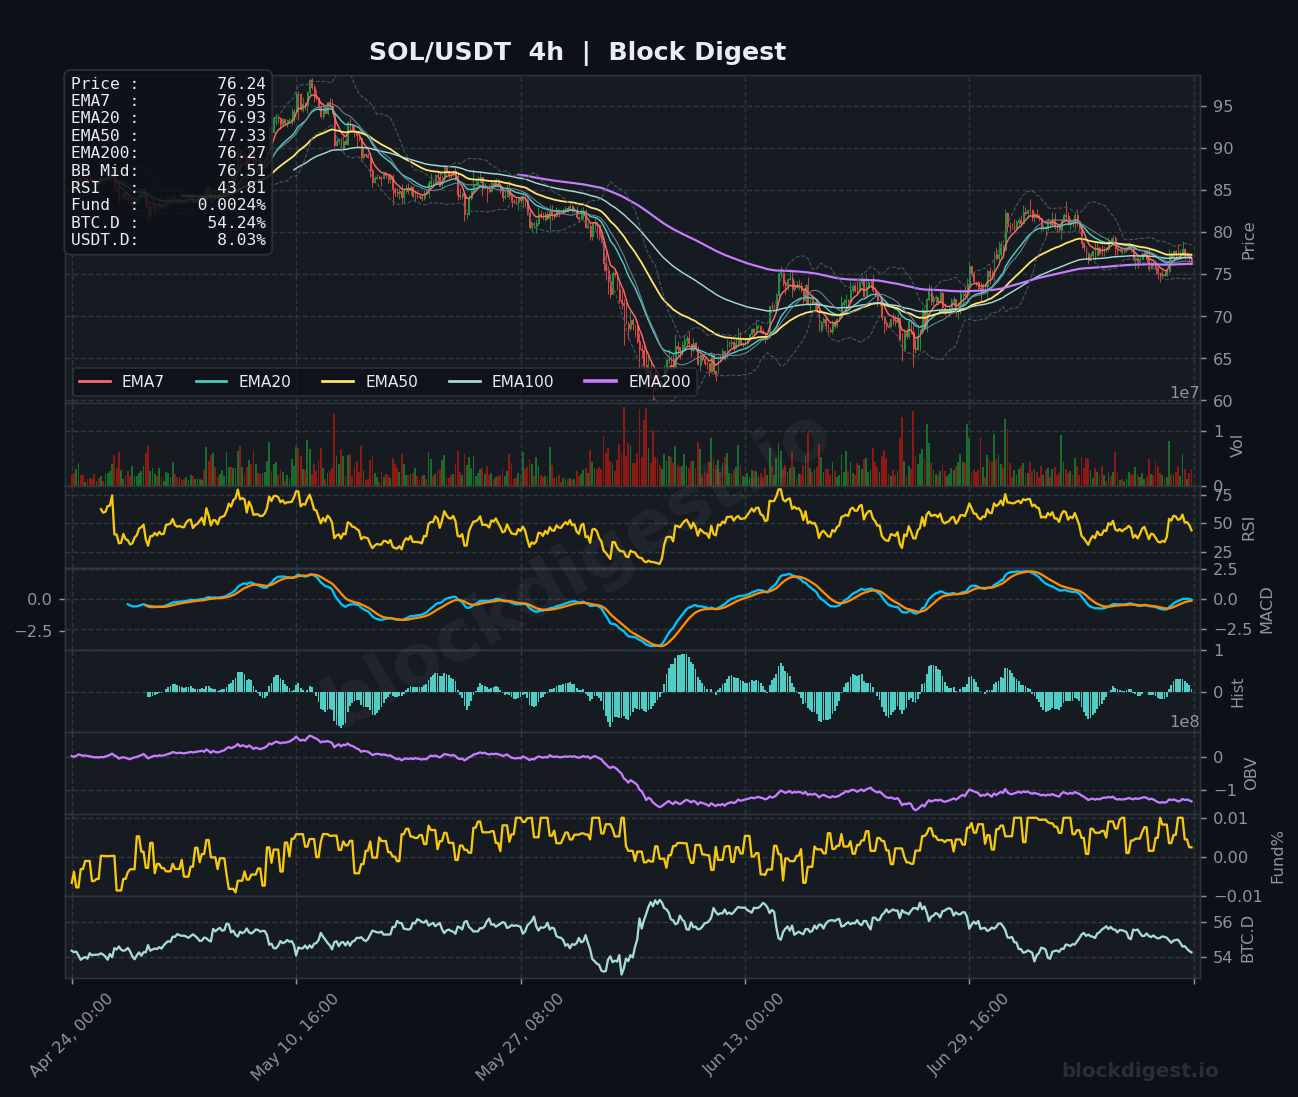
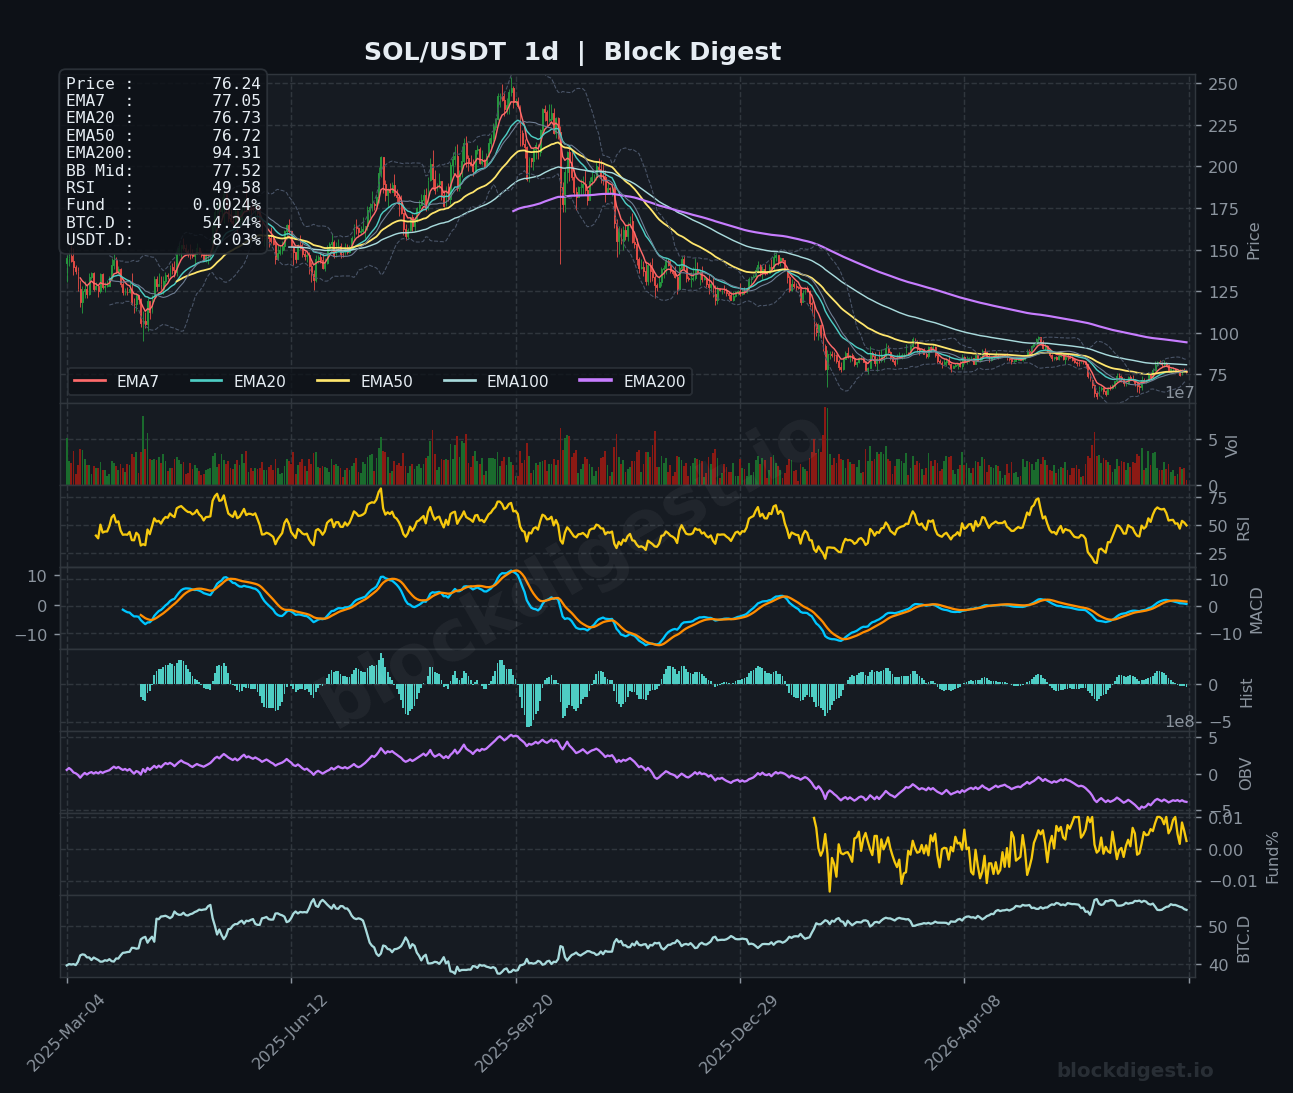
SOL is trading at $76.24, pinned beneath a tightly stacked cluster of short-term EMAs (EMA7 at $76.94, EMA20 at $76.93, EMA50 at $77.33) that are all acting as immediate overhead resistance. On the 1h chart, RSI sits at a weak 37.38, and the MACD remains in bearish territory with a flattening histogram, suggesting limited near-term buying pressure. The daily chart paints a more sobering picture: the EMA200 at $94.31 towers well above current price, and OBV has been in a sustained decline, indicating persistent net selling over the medium term. The $72–$75 zone represents the next meaningful support should selling resume, while bulls need a decisive reclaim of $79–$80 to shift the short-term bias to neutral.
XRP (XRP)
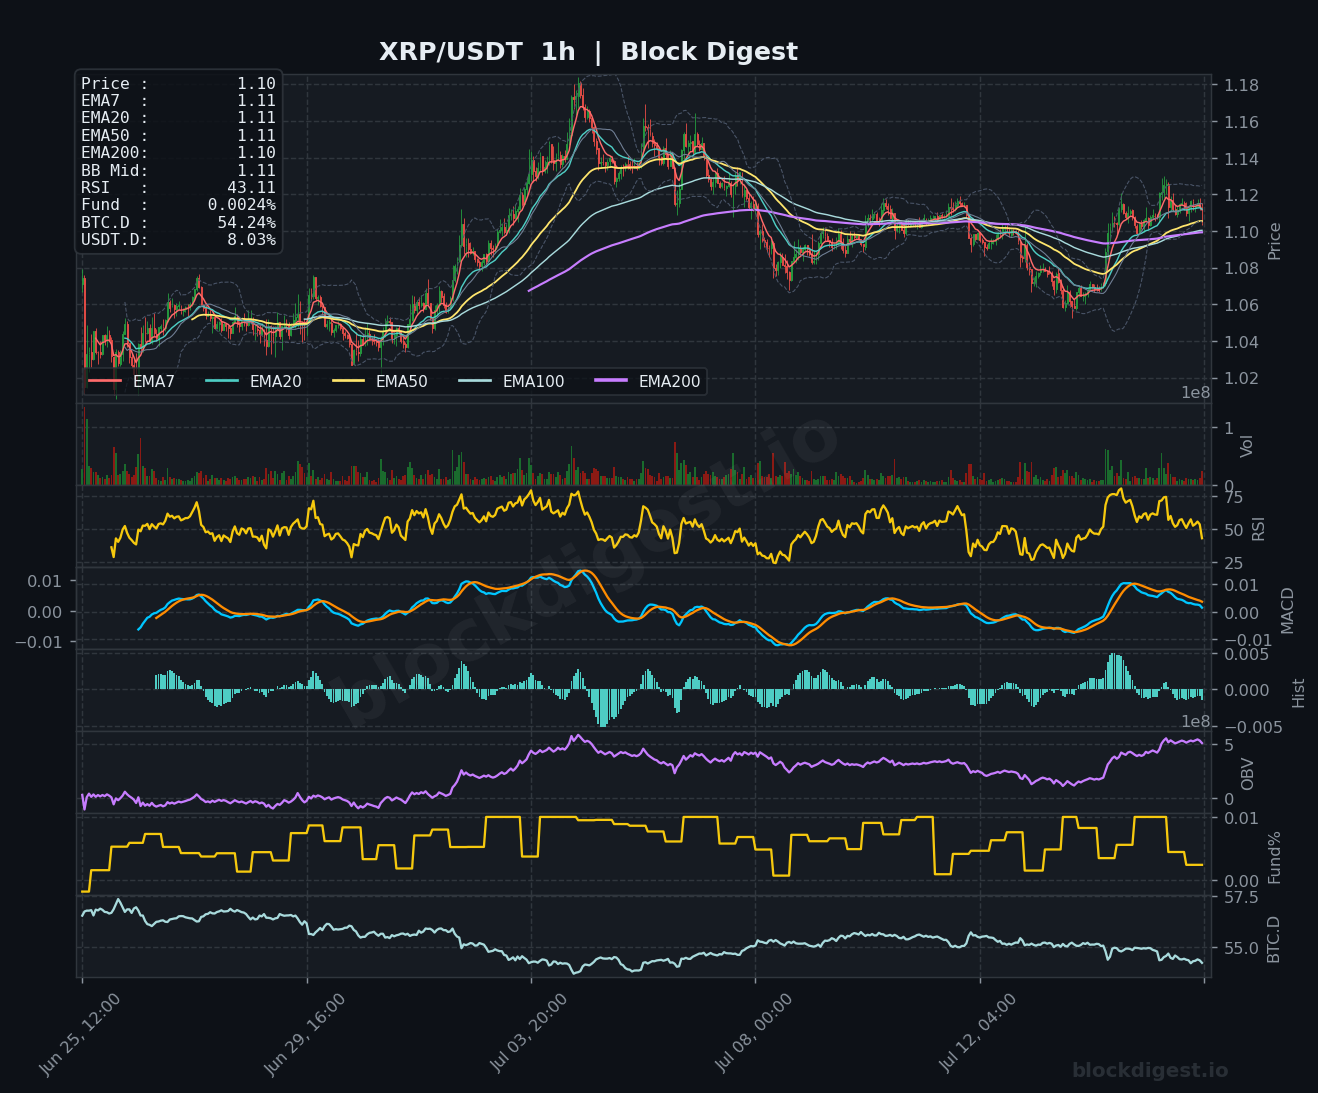
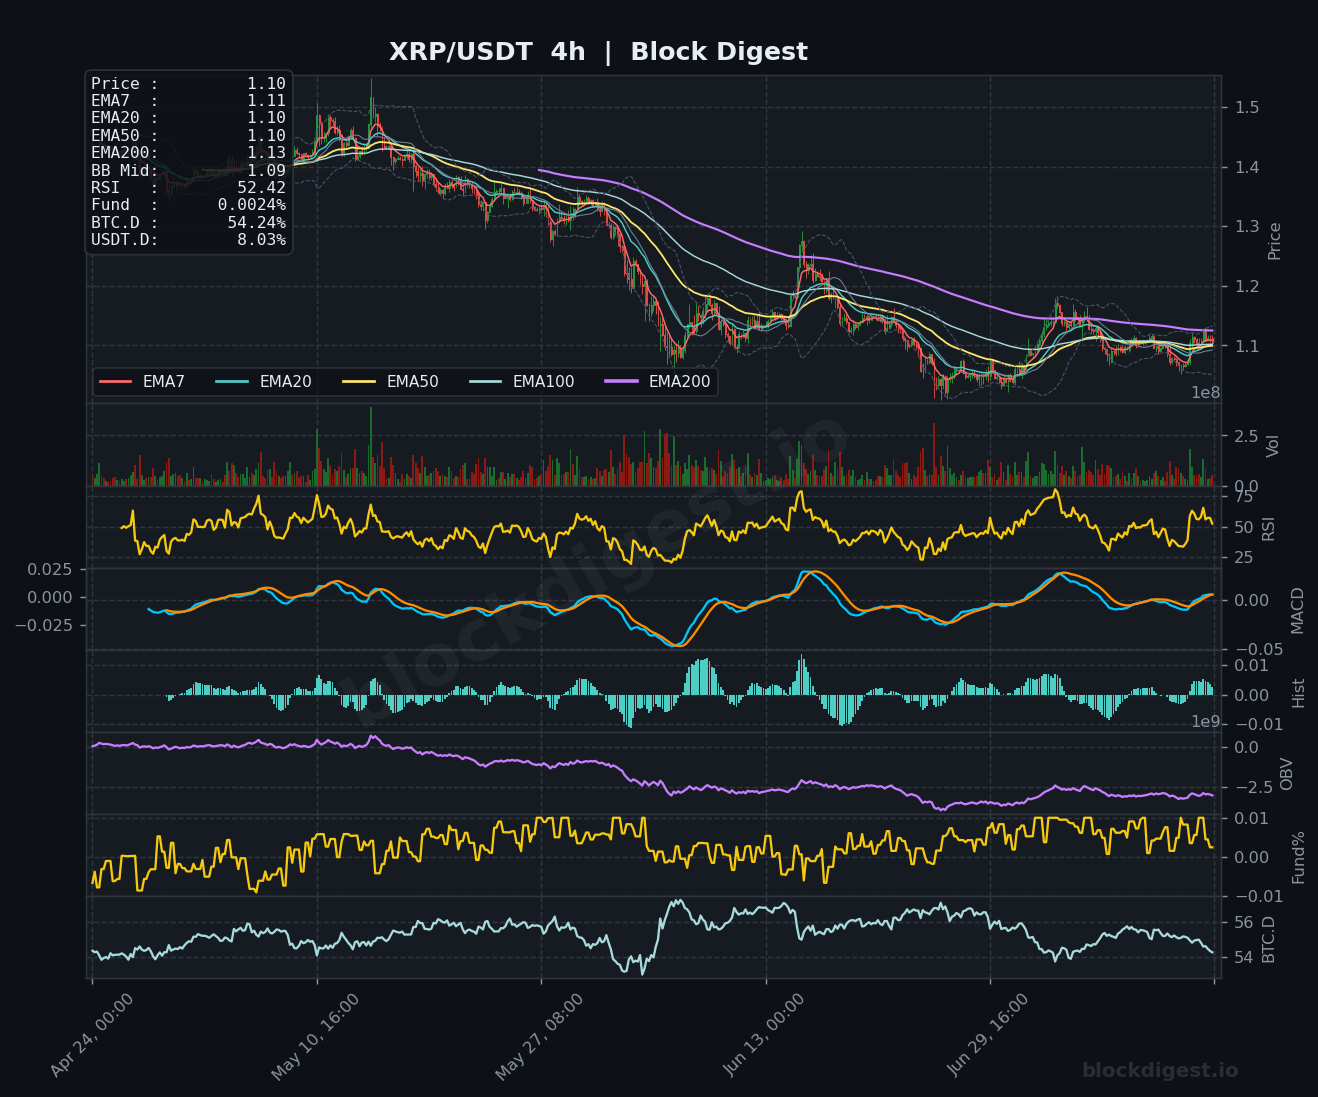
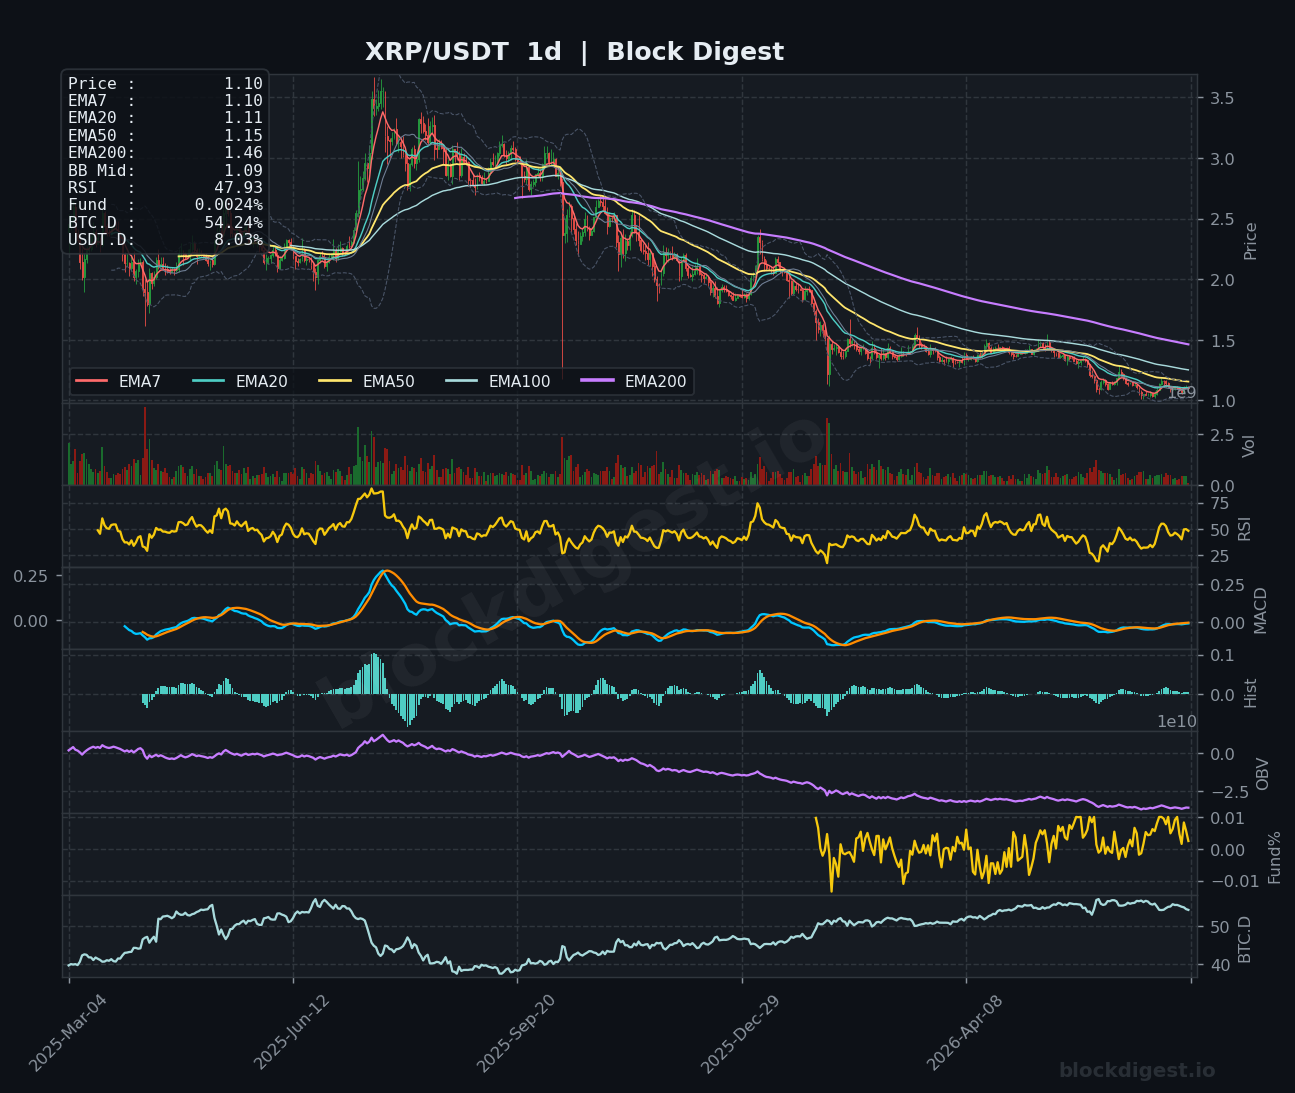
XRP is trading at $1.10, holding just above the EMA200 on the 1h chart ($1.10) in what is one of the more technically constructive setups in this cohort. The 4h RSI has recovered to 52.42 — the only asset in today’s roundup with a near-neutral reading — and the 4h MACD is grinding back toward the zero line from below, hinting at a potential momentum shift. However, the daily chart remains structurally compromised, with price far below the declining EMA50 ($1.15) and EMA200 ($1.46), and the daily OBV trend continuing lower. A sustained hold above $1.08–$1.10 is critical; failure here opens a retest of the $1.04 region, while a breakout above $1.14 would be the first meaningful bullish signal.
BNB (BNB)
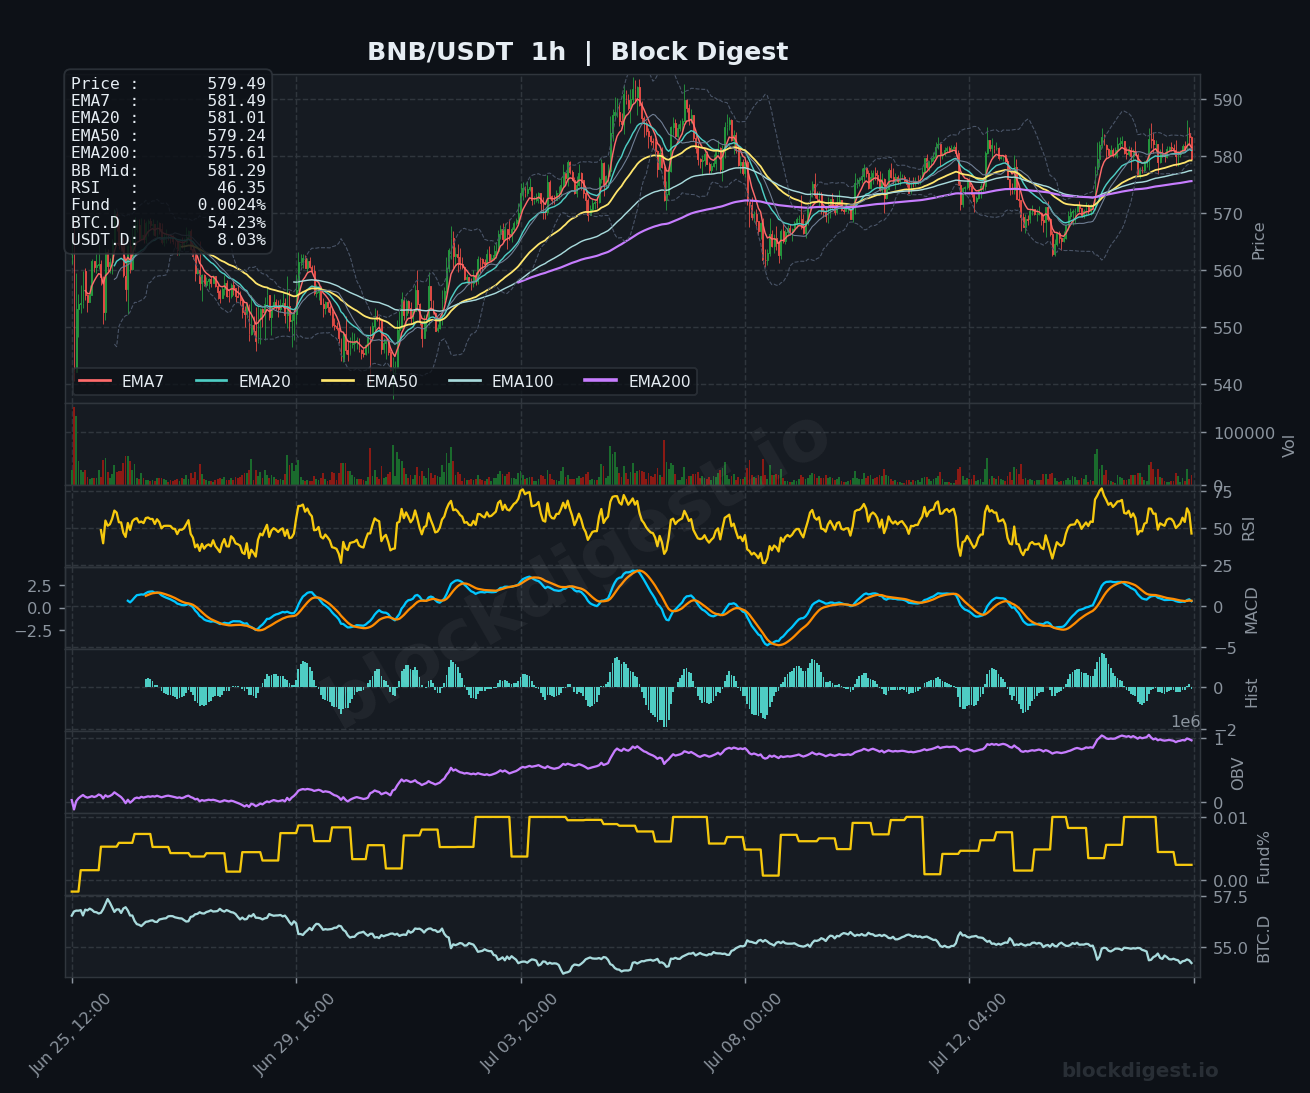
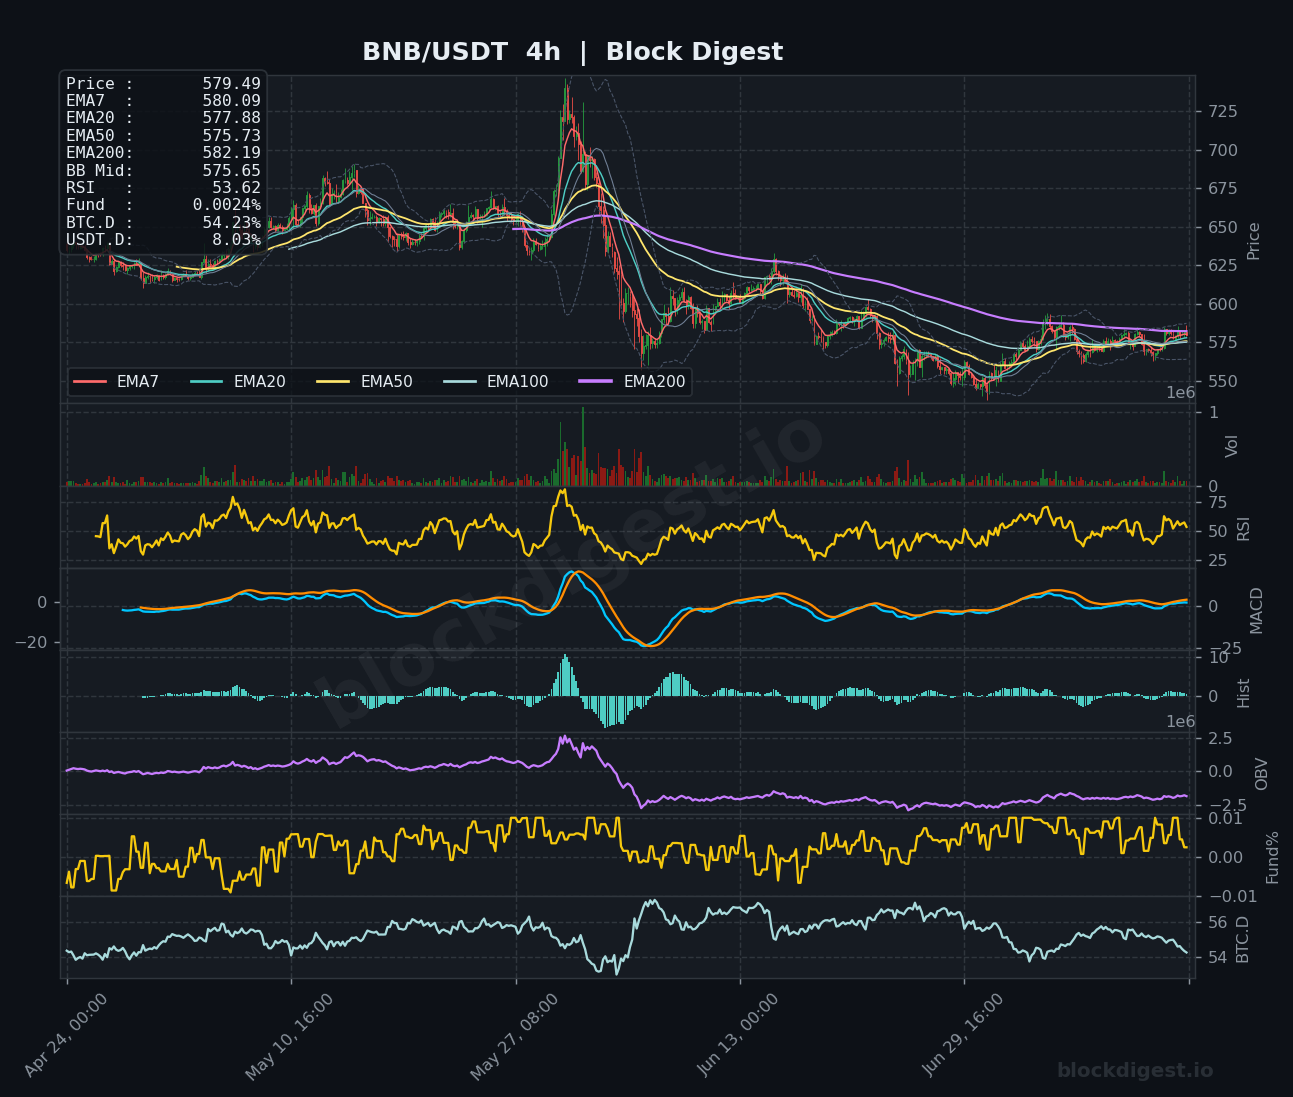
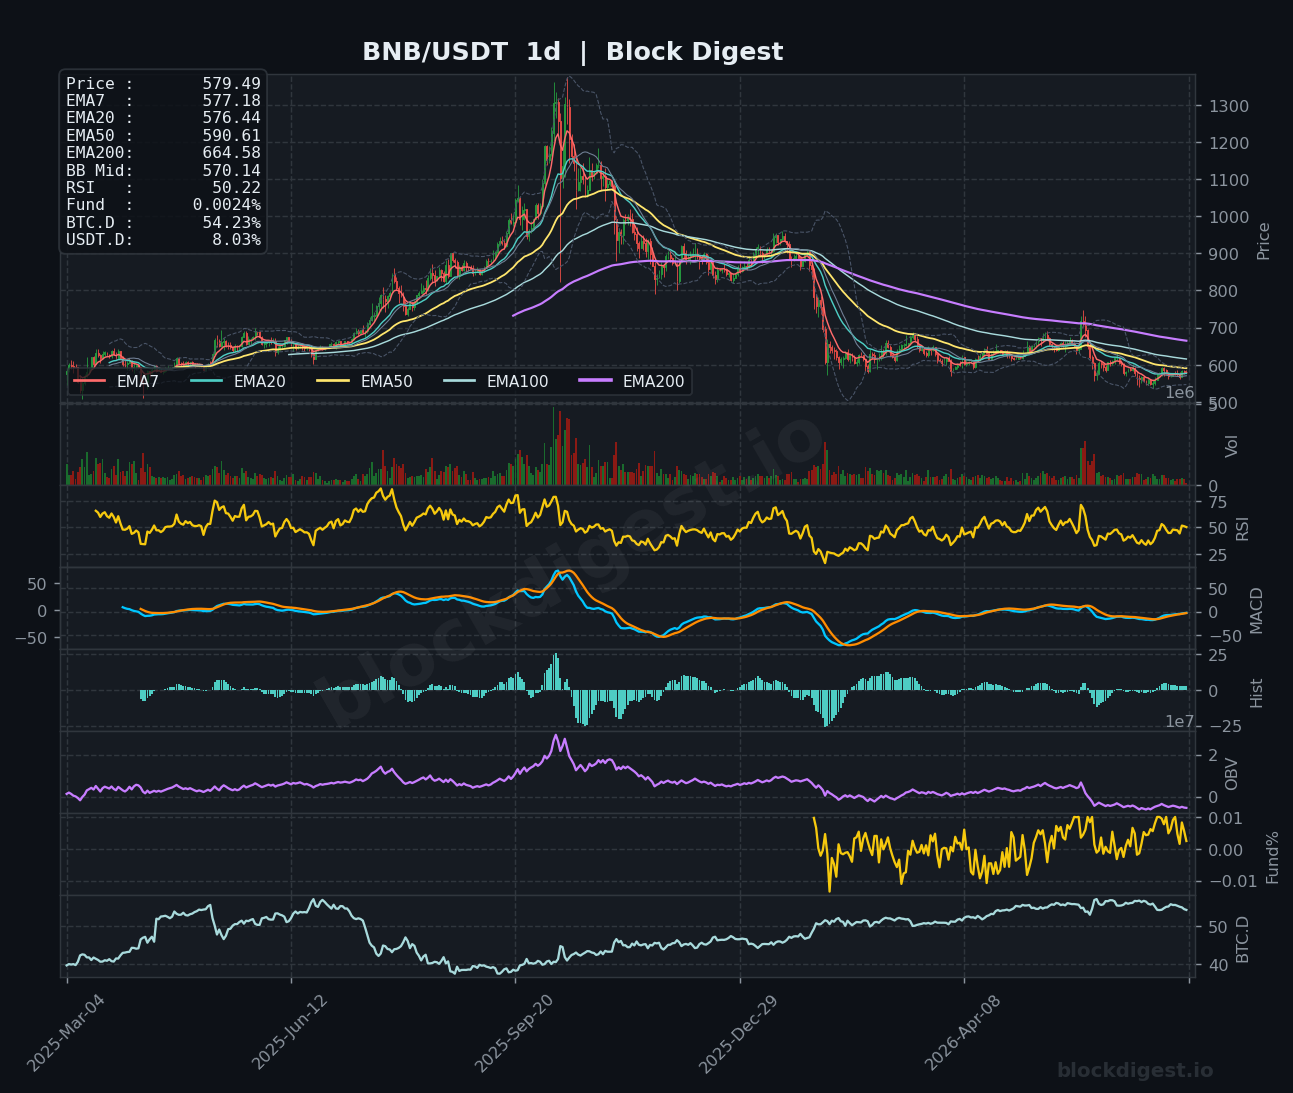
BNB is trading at $579.49, and is arguably the most resilient asset on the 4h timeframe, with the 4h RSI at 53.62 and price holding above both EMA7 ($580.09) and EMA20 ($577.88). The 1h OBV has trended consistently higher over the past three weeks, suggesting steady accumulation rather than distribution — a notable divergence from peers like SOL and DOGE. On the daily chart, however, the broader downtrend from the cycle high remains intact with the EMA200 at $664.58 far overhead, and the EMA50 ($590.61) serving as the next key resistance level to reclaim. Short-term bias leans cautiously neutral-to-bullish with support at $563–$565; a break above $590 would open room toward $610.
Dogecoin (DOGE)
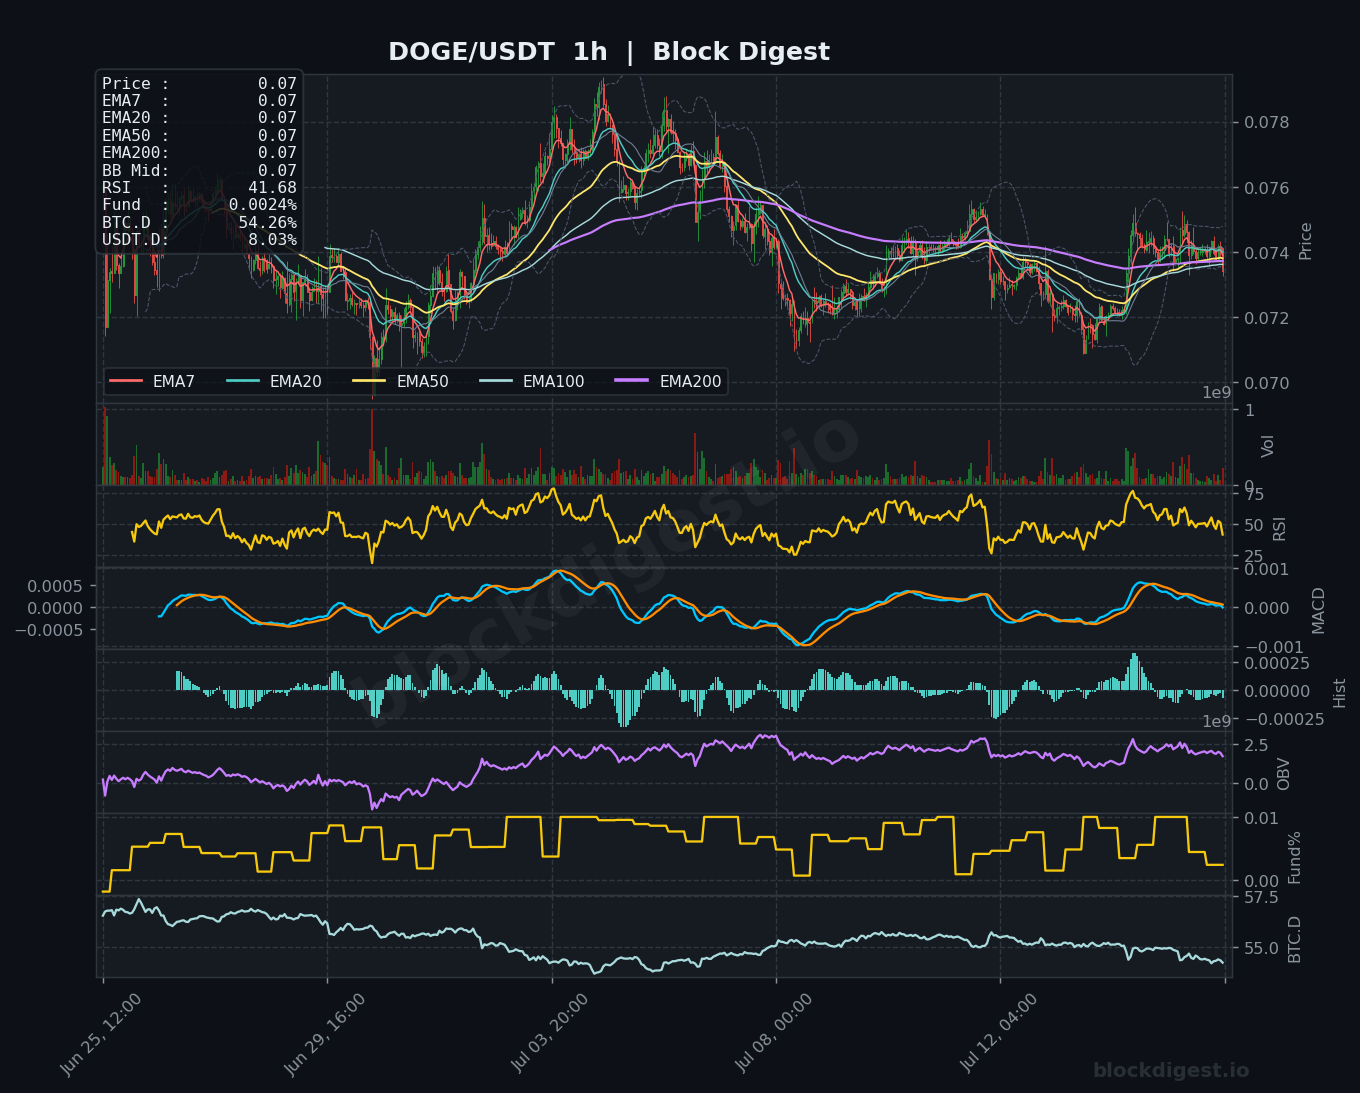
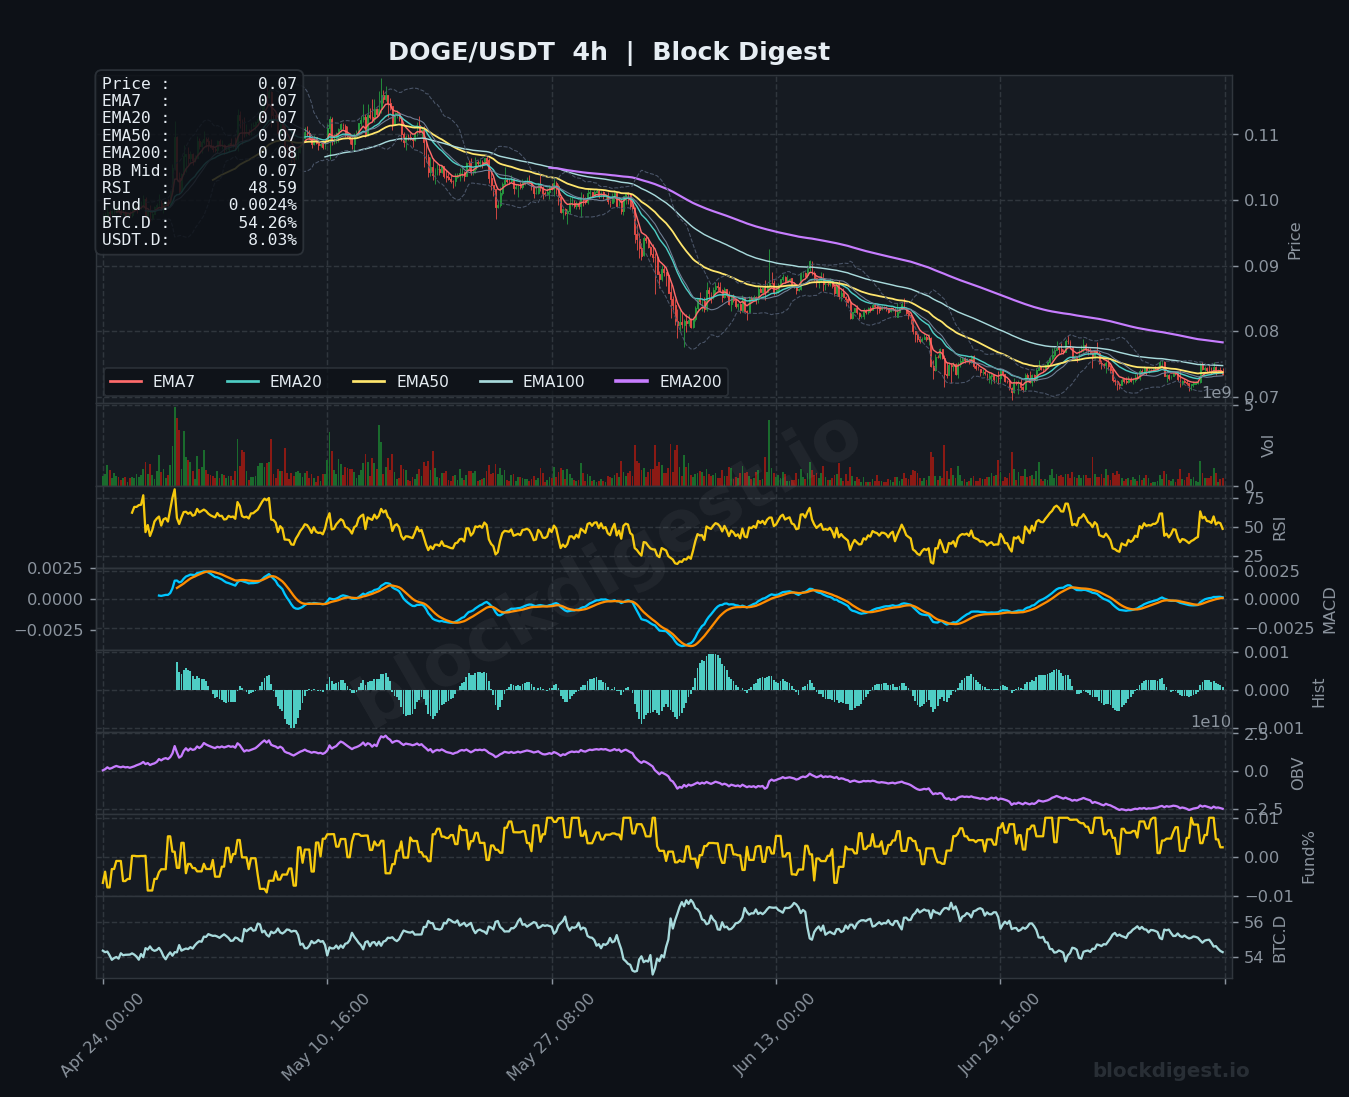
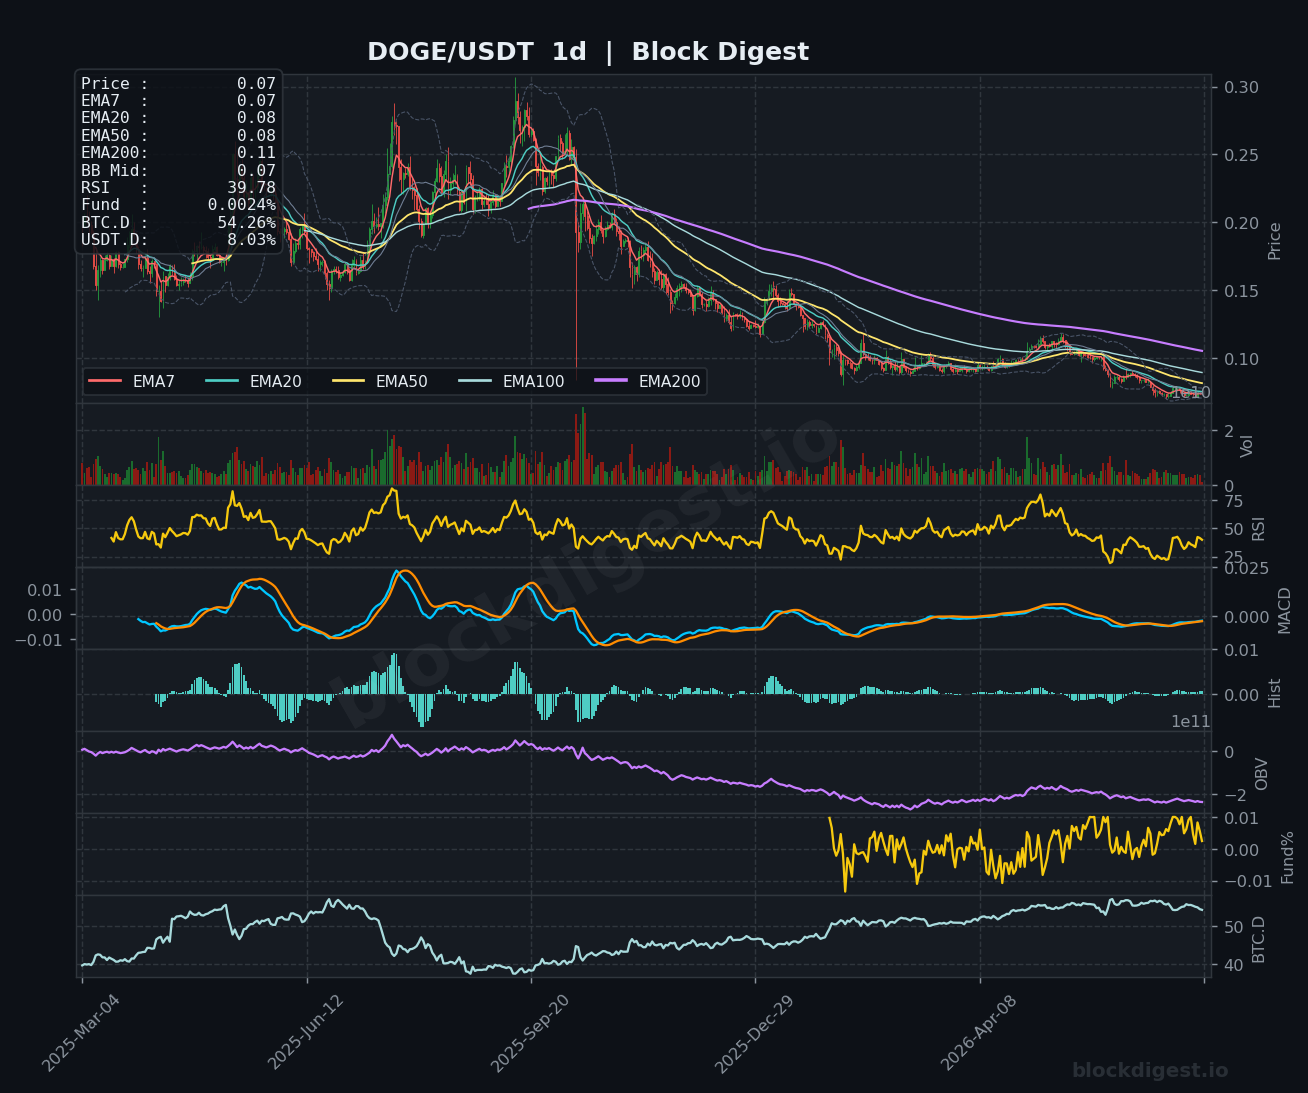
DOGE is trading at $0.0715 on the news-based price, while charts show consolidation near $0.074, with all EMAs compressed into a tight band reflecting a market in indecision. The 1h RSI at 41.68 and daily RSI at 39.78 place DOGE in weakly bearish territory, while the daily MACD remains fractionally below the signal line with a near-flat histogram — offering no recovery signal yet. The 4h OBV has been flat-to-declining since the cycle peak, confirming that the much-discussed whale accumulation in large wallets has not translated into sustained spot buying pressure on exchanges. Key support sits at $0.070–$0.071, and DOGE needs a reclaim of $0.077–$0.078 on the daily close to establish any bullish case; until then, the path of least resistance remains sideways-to-lower.
Litecoin (LTC)
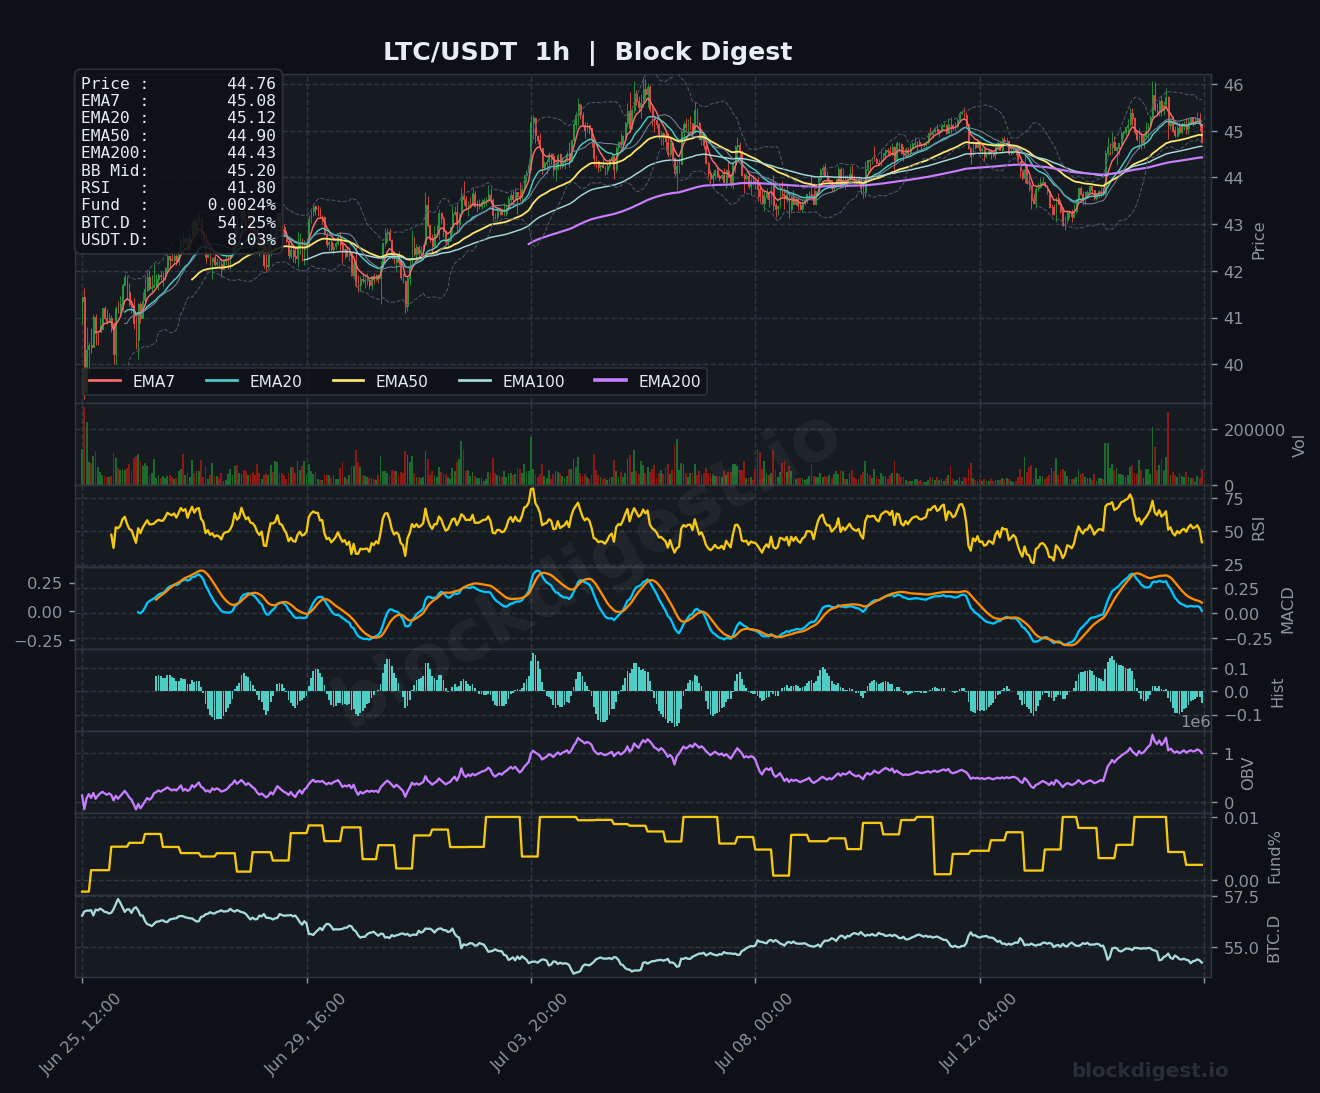
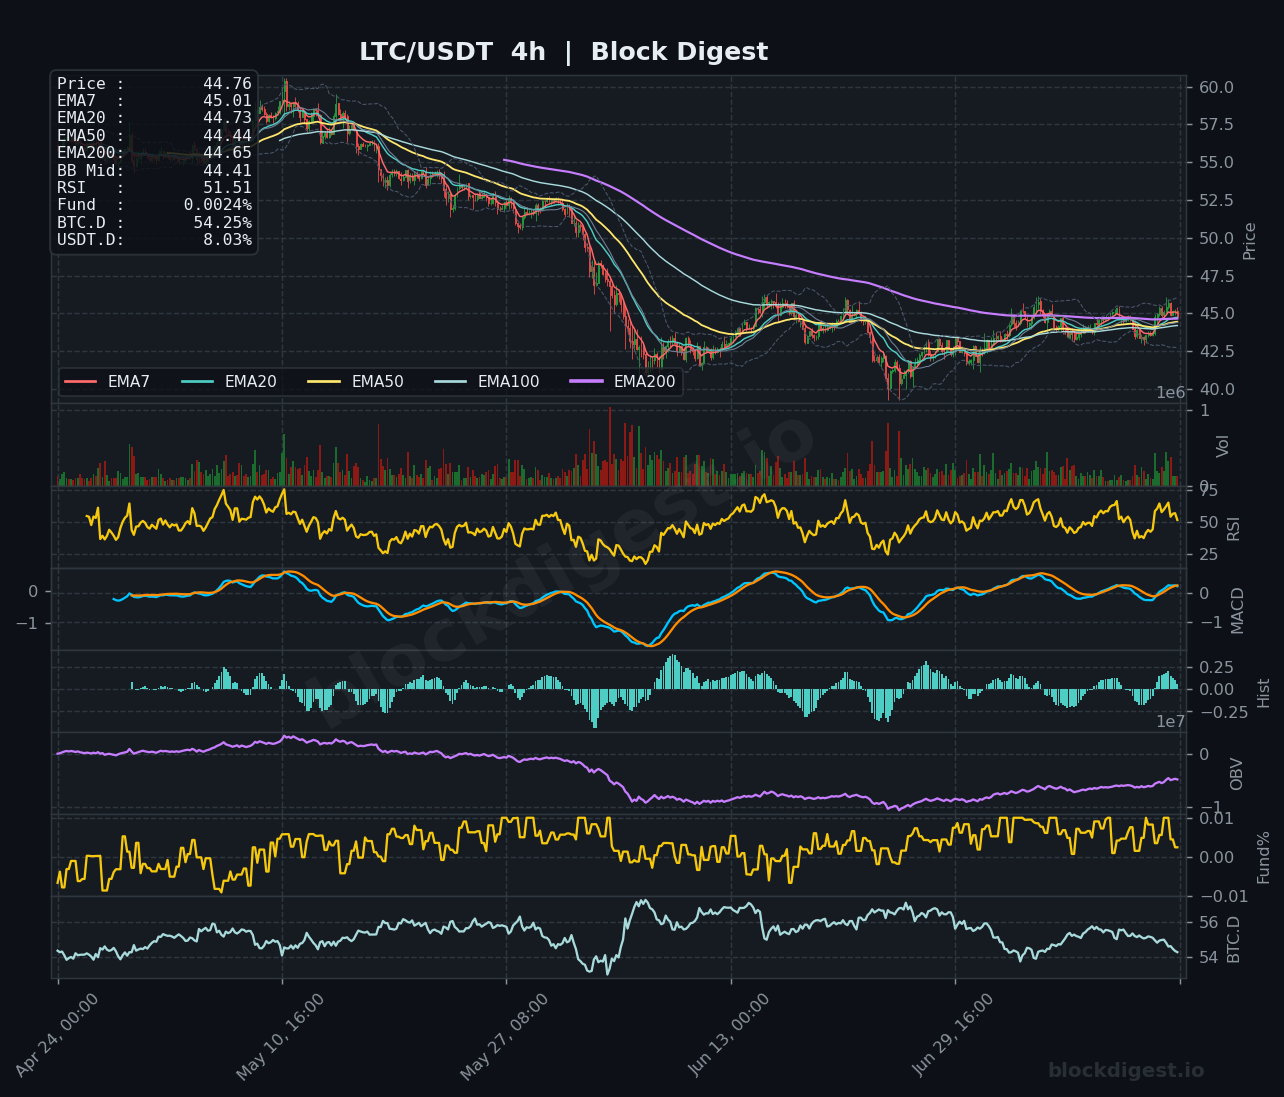
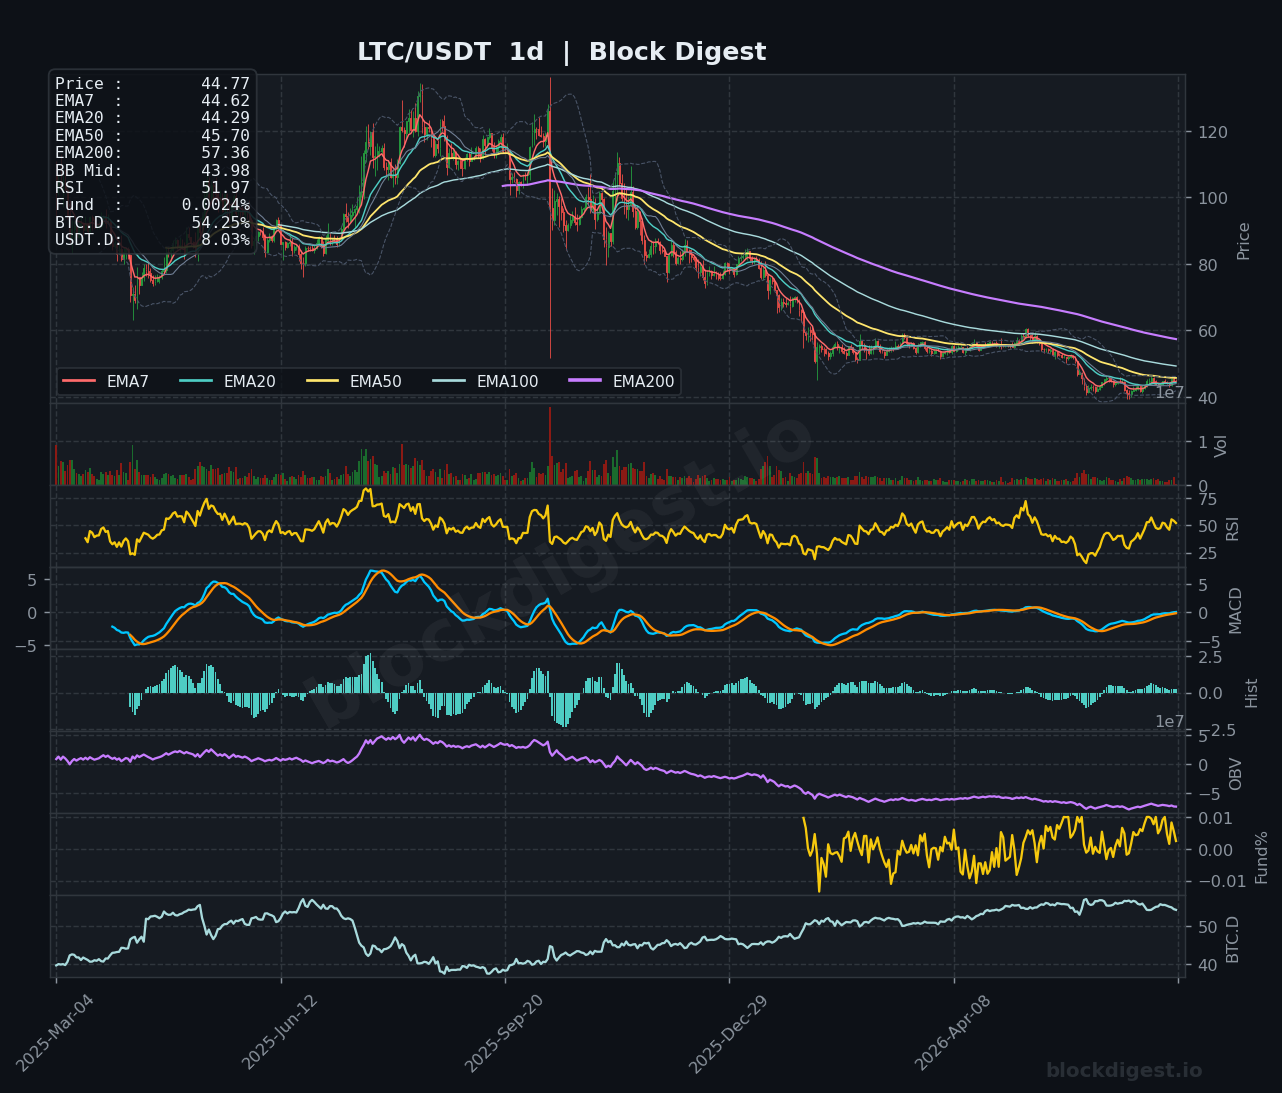
LTC is trading at $44.76, and stands out as a relative bright spot structurally: the 4h RSI is at 51.51 and the daily RSI at 51.97, both hovering in neutral territory and suggesting the worst of the selling pressure may have run its course. On the 4h chart, the short-term EMAs (EMA7 at $45.01, EMA20 at $44.73, EMA50 at $44.44) are beginning to converge and flatten after a prolonged bearish trend, and the 4h MACD histogram is showing tentative positive momentum. The 1h OBV has been quietly trending higher over the past several weeks, which aligns with what appears to be patient base-building around the $42–$44 support zone. Resistance lies at $46.00–$47.50, and a confirmed break above $47 on volume would represent the most constructive near-term development for LTC across this entire cohort.
TRON (TRX)
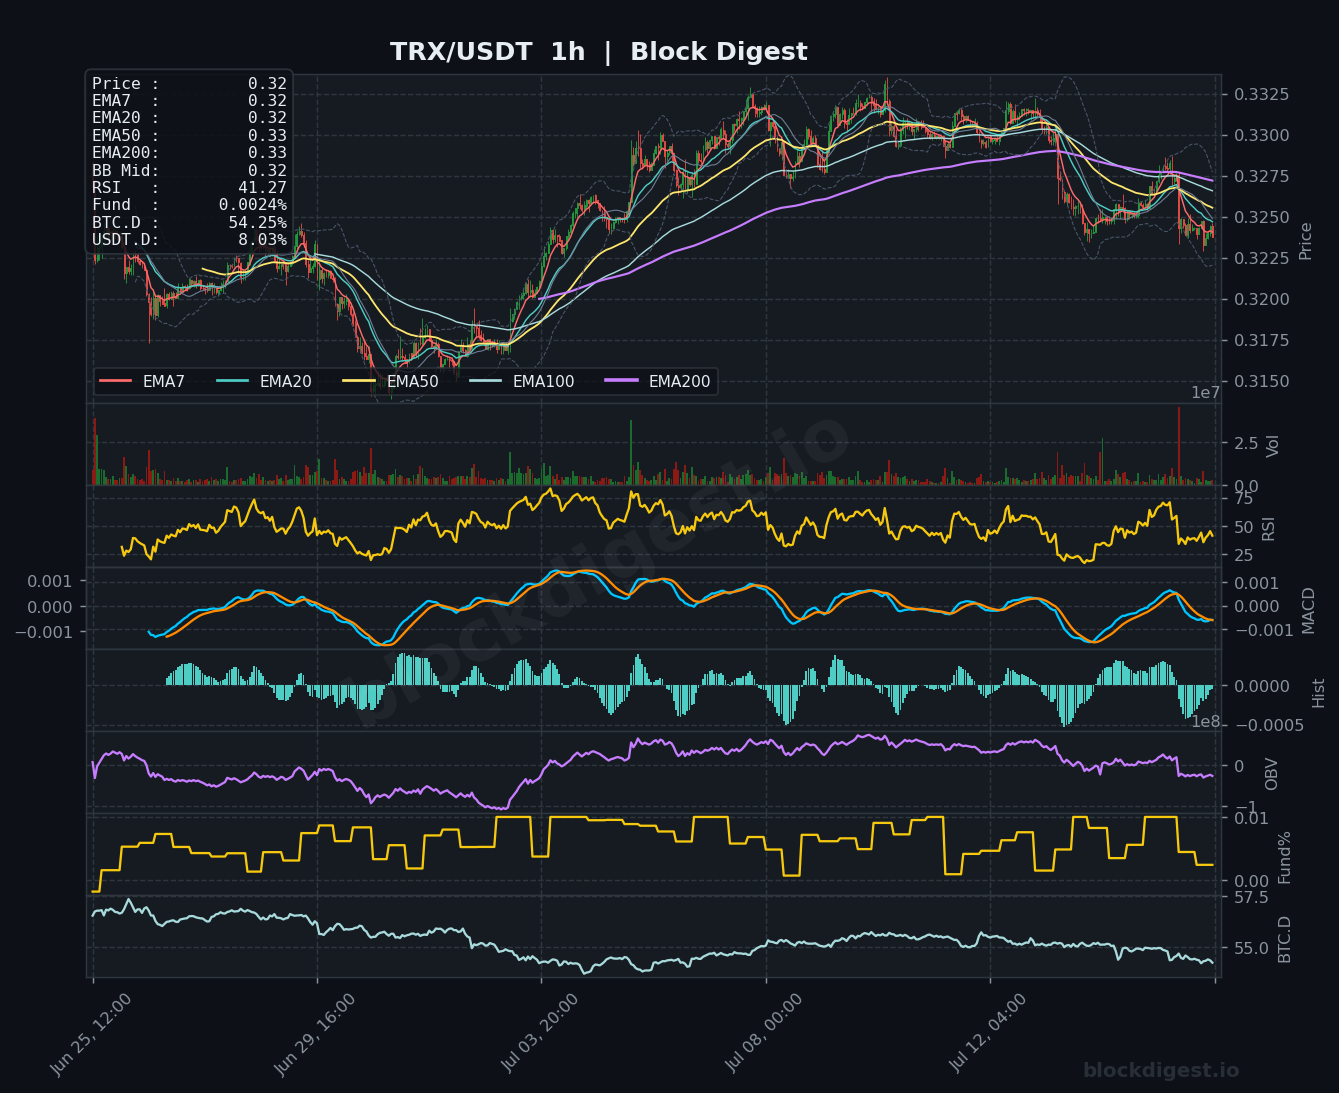
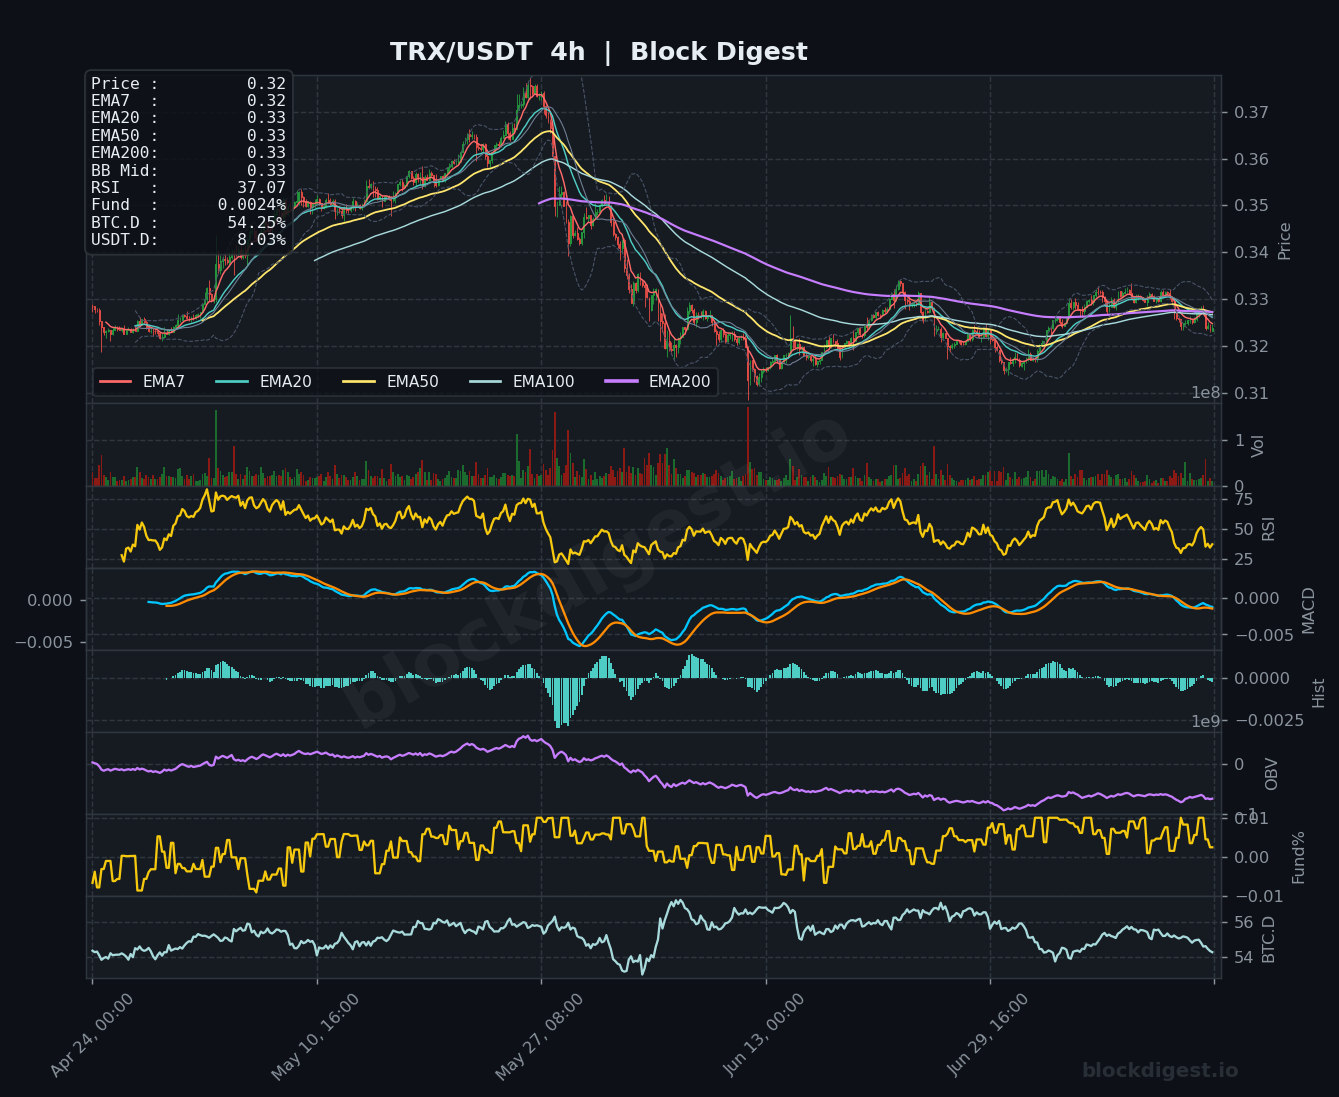
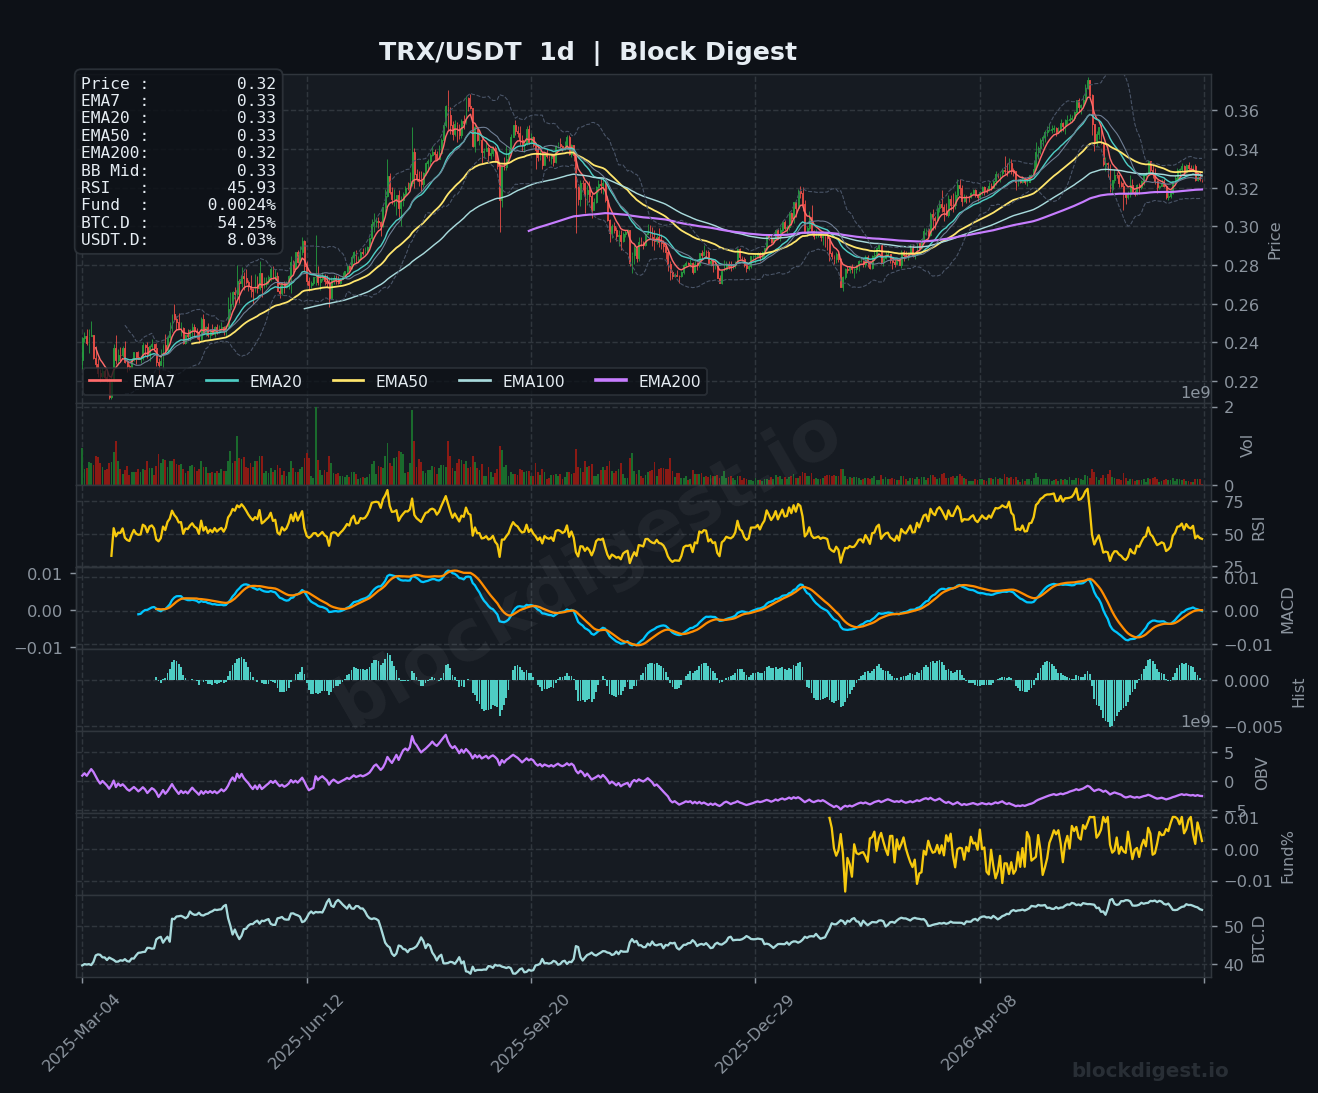
TRX is trading at $0.32, having pulled back from a recent high near $0.3325, and is currently testing the lower range of its consolidation band. The 1h RSI at 41.27 and 4h RSI at 37.07 suggest building bearish momentum on shorter timeframes, with price now trading below the EMA50 ($0.33) and EMA200 ($0.33) on both the 1h and 4h charts. The 1h MACD is rolling over bearishly from near zero, and the histogram is printing negative bars — a near-term sell signal. On the daily chart, TRX tells a more nuanced story: the EMA200 ($0.32) is rising and meeting current price from below, which could provide dynamic support, while the daily RSI at 45.93 leaves room for further compression. The $0.318–$0.320 band is the immediate support line to watch; a break below risks a slide toward $0.310.
Altcoin Outlook
The overall altcoin setup as of July 16, 2026 is one of fragile consolidation — most assets are caught between meaningful overhead resistance and thin but identifiable support floors, with neither bulls nor bears holding decisive control. BNB and LTC present the most constructive near-term setups, with healthier RSI readings, improving OBV trends, and more stable EMA structures relative to peers. SOL and DOGE remain the weakest setups on a technical basis, weighed down by declining OBV, sub-40 RSI readings on multiple timeframes, and heavy EMA resistance overhead. The key macro condition to watch is whether USDT.D begins to roll over meaningfully below 8%, which would signal capital rotation back into altcoins; until that occurs, any rallies in this space should be treated as counter-trend moves rather than the start of a sustained recovery.
Disclaimer: This analysis is for informational purposes only and does not constitute financial advice. Cryptocurrency markets are highly volatile and unpredictable. All trading decisions should be made based on your own research and risk tolerance. Block Digest is not responsible for any financial losses incurred as a result of acting on this content.