ETH Daily Analysis — May 13, 2026
ETH Daily Analysis – May 13, 2026
Market Overview
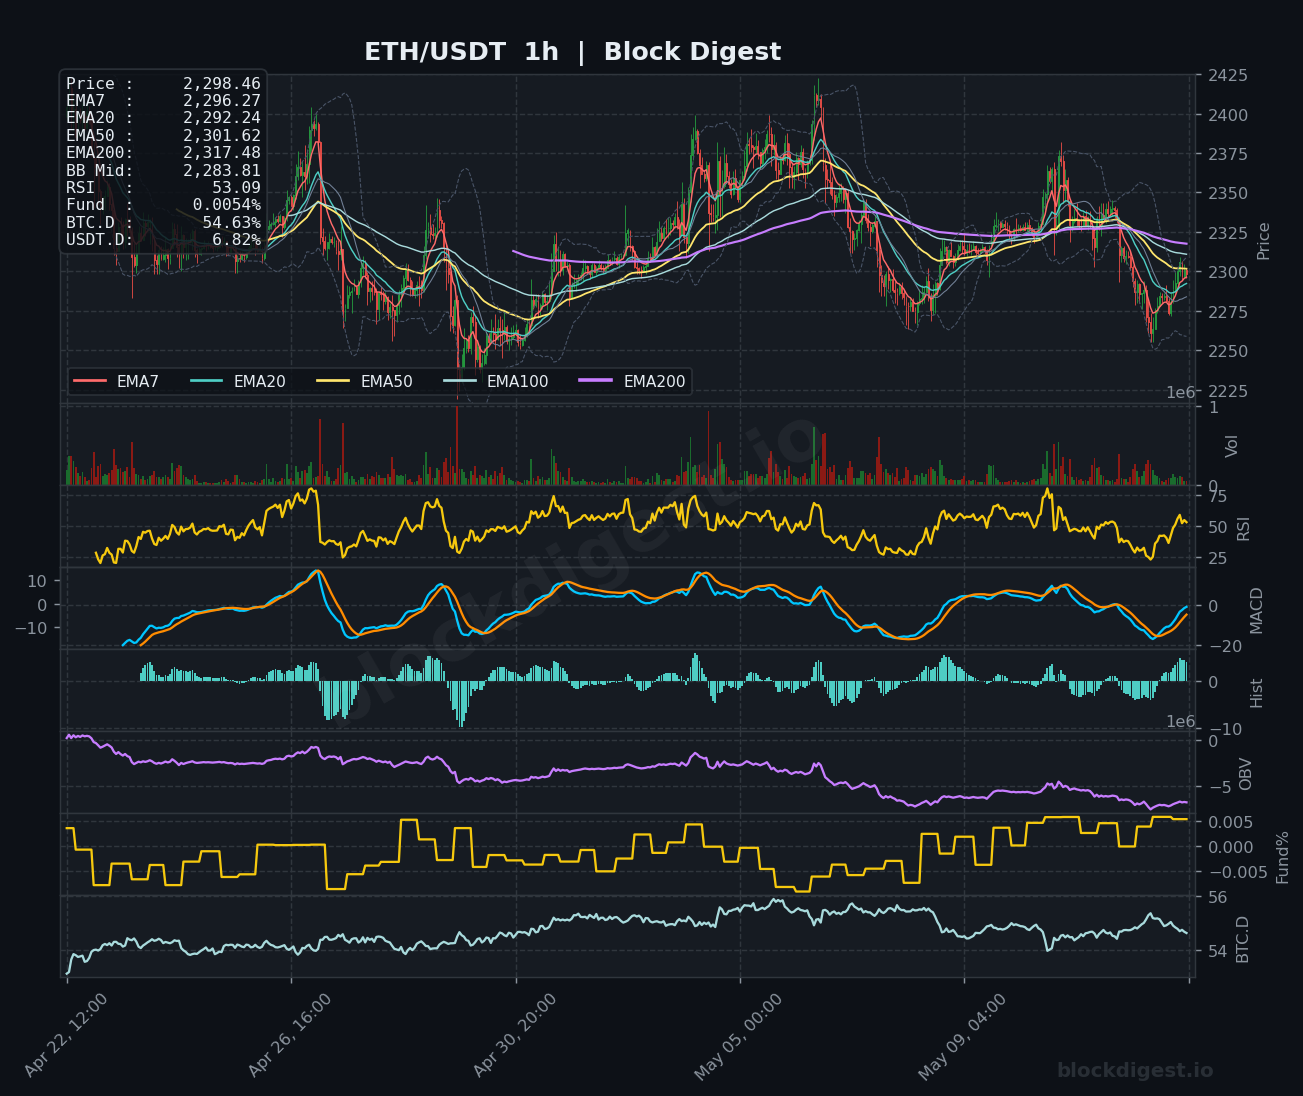
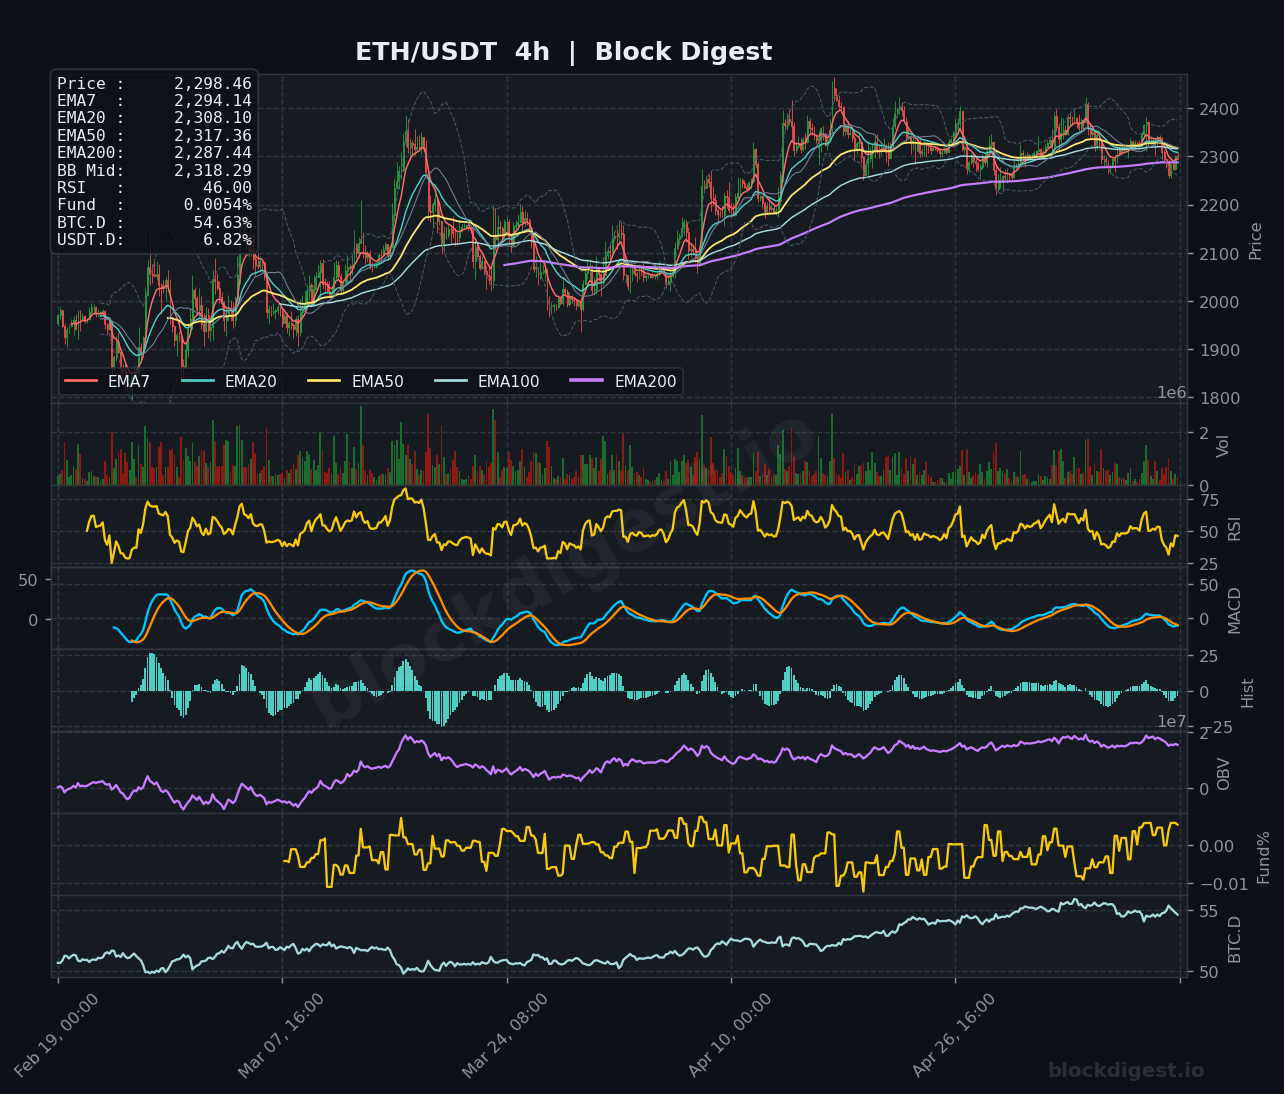
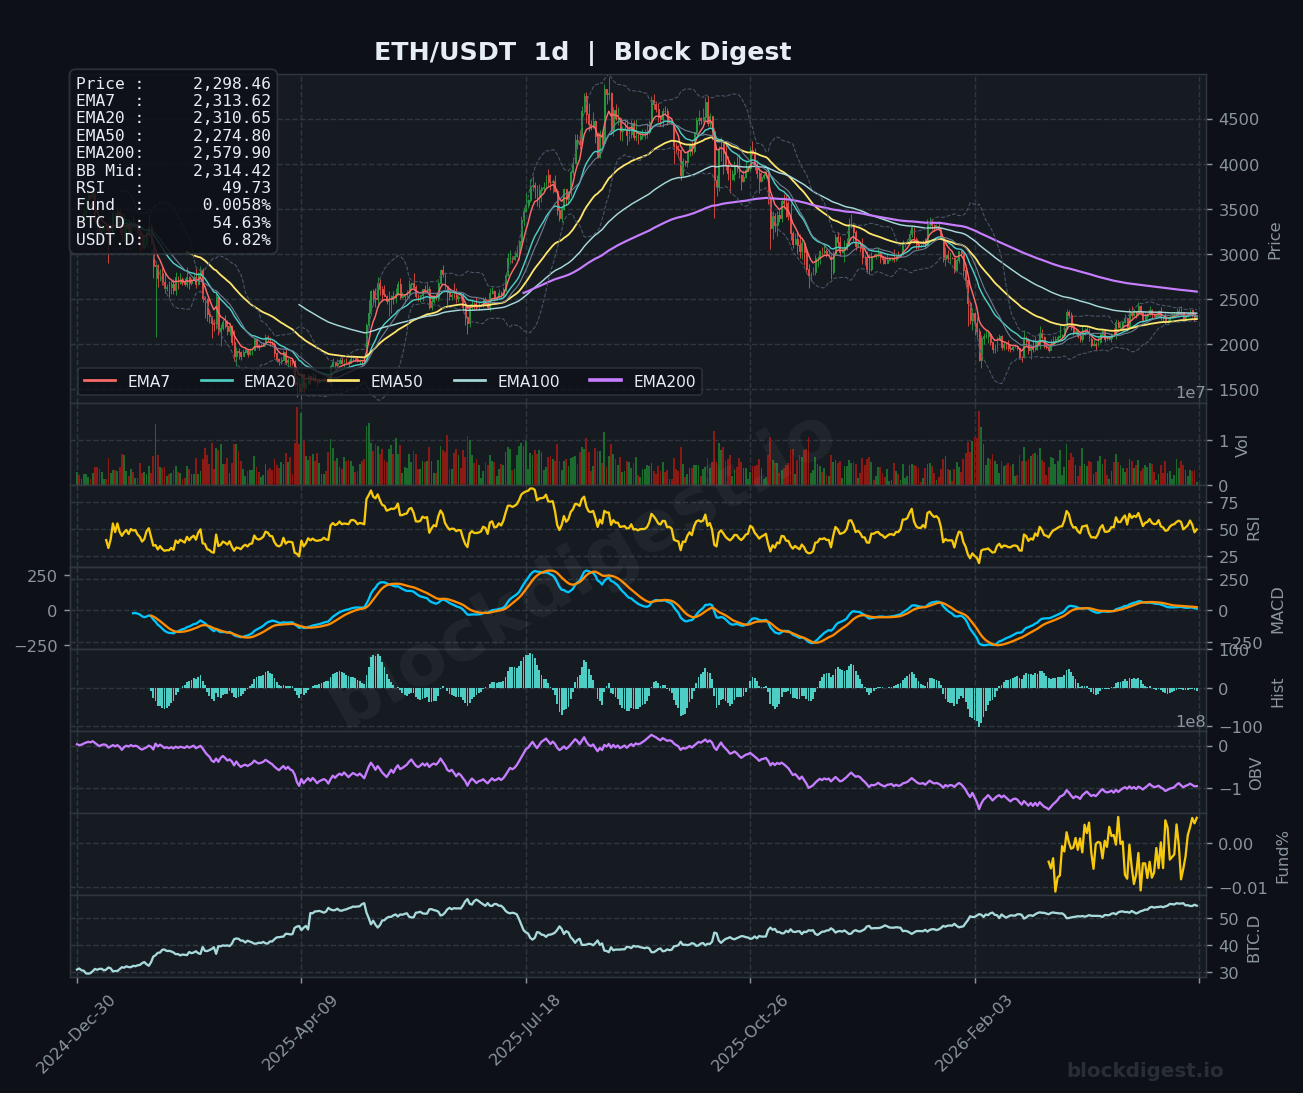
Ethereum is trading at $2,298.46, positioned below all major EMAs on the daily timeframe, signaling persistent bearish pressure despite short-term consolidation attempts. Price is currently hovering near the middle Bollinger Band at $2,314, showing compression after recent volatility. The daily chart reveals ETH trapped below the critical EMA50 ($2,274.80), EMA100, and EMA200 ($2,579.90), forming a bearish EMA stack that confirms the primary trend remains downward. This structure indicates sellers maintain control, with price struggling to reclaim meaningful support-turned-resistance levels.
Multi-Timeframe Confluence
The 1-hour chart shows price attempting to stabilize around $2,298 with EMAs beginning to flatten, suggesting diminishing downward momentum in the very short term, though price remains capped by the EMA200 at $2,317.48. On the 4-hour timeframe, ETH is testing the underside of the EMA20 ($2,308.10) and EMA50 ($2,317.36), both serving as immediate resistance zones that have consistently rejected rallies. However, a notable divergence exists between the lower timeframes showing potential stabilization and the daily chart’s firmly bearish structure, where price trades well below all moving averages with the EMA200 acting as a formidable overhead barrier near $2,580. This multi-timeframe tension suggests consolidation in a tight range is likely until a decisive breakout occurs.
Key Levels to Watch
Resistance:
- $2,317-$2,318: Confluence of 4h EMA50 and 1h EMA200, representing immediate overhead resistance where recent rallies have stalled
- $2,350-$2,375: Zone containing the 1h swing highs and previous support-turned-resistance, likely to attract significant selling pressure
- $2,420-$2,450: Major resistance area marked by the recent rejection zone and approach to the daily EMA50, critical for confirming any meaningful trend reversal
Support:
- $2,283: Bollinger Band middle on the 1h chart and recent consolidation floor, serving as immediate short-term support
- $2,250-$2,260: Recent swing low area visible across all timeframes, representing a critical demand zone that has provided buying interest
- $2,200: Psychological level and proximity to lower Bollinger Band zones, marking the next major support if current levels fail to hold
Momentum & On-Chain Signals
RSI readings present a mixed picture across timeframes: the 1h RSI at 53.09 suggests neutral momentum with slight bullish bias, while the 4h RSI at 46.00 indicates weakening bearish pressure but no confirmation of reversal, and the daily RSI at 49.73 hovers near midpoint, reflecting indecision after prolonged weakness. The MACD on the 1h timeframe shows both lines in negative territory but converging, with histogram bars shrinking, indicating diminishing bearish momentum, while the 4h and daily MACD remain bearish with both lines below zero, though daily histogram shows slight reduction in selling pressure. OBV has been trending downward across all timeframes, particularly notable on the daily chart where it continues declining, confirming persistent distribution and lack of strong accumulation despite price stabilization. Funding rates at 0.0054% remain slightly positive but subdued, suggesting long positions still slightly outnumber shorts but without conviction, indicating neutral to slightly bearish sentiment among derivatives traders.
BTC Dominance & Market Sentiment
BTC.D currently sits at 54.63%, having risen from lower levels, indicating capital rotation favoring Bitcoin over altcoins including Ethereum, which typically pressures ETH price action during risk-off periods. USDT.D at 6.82% shows elevated stablecoin dominance, suggesting defensive positioning with significant capital sitting on the sidelines rather than being deployed into risk assets. This combination of rising Bitcoin dominance and elevated stablecoin dominance creates a challenging environment for Ethereum, as it faces dual headwinds: underperformance against BTC and limited fresh capital inflows from stablecoin reserves into the broader altcoin market.
Risk Scenarios
Bullish case: A decisive close above $2,318 on the 4h timeframe with accompanying volume would confirm short-term momentum shift, potentially targeting the $2,350-$2,375 resistance zone and subsequently the psychologically important $2,400 level. Reclaiming the daily EMA50 near $2,274 (currently below spot price but rising) and establishing it as support would significantly improve the technical structure and open path toward $2,450-$2,500.
Bearish case: Failure to hold $2,283 support with declining volume would likely trigger accelerated selling toward $2,250 and potentially $2,200, especially if accompanied by continued OBV decline. A breakdown below $2,250 on increasing volume would confirm continuation of the broader downtrend, targeting the $2,150-$2,100 zone where previous demand emerged during earlier declines.
Outlook
Ethereum remains structurally bearish on higher timeframes but is showing early signs of momentum exhaustion in the very short term, creating a tactical range-bound environment between $2,250-$2,350. The immediate 24-48 hours will likely determine whether this consolidation resolves as a continuation pattern lower or marks a temporary bottom. Key triggers include a decisive break above $2,318 with volume confirmation for bullish continuation, or a breakdown below $2,283 for renewed selling pressure. The critical level that would fundamentally change the bearish thesis is a sustained reclaim of $2,400 with follow-through above $2,450, which would flip the 4h structure and challenge the daily downtrend. Until then, the path of least resistance remains sideways-to-lower, with traders advised to wait for clear directional confirmation before committing to swing positions given the current technical ambiguity between timeframes.
Disclaimer: This analysis is for informational purposes only and does not constitute financial advice. Cryptocurrency markets are highly volatile and unpredictable. All trading decisions should be made based on your own research and risk tolerance. Block Digest is not responsible for any financial losses incurred as a result of acting on this content.