ETH Daily Analysis — May 10, 2026
ETH Daily Analysis – May 10, 2026
Market Overview
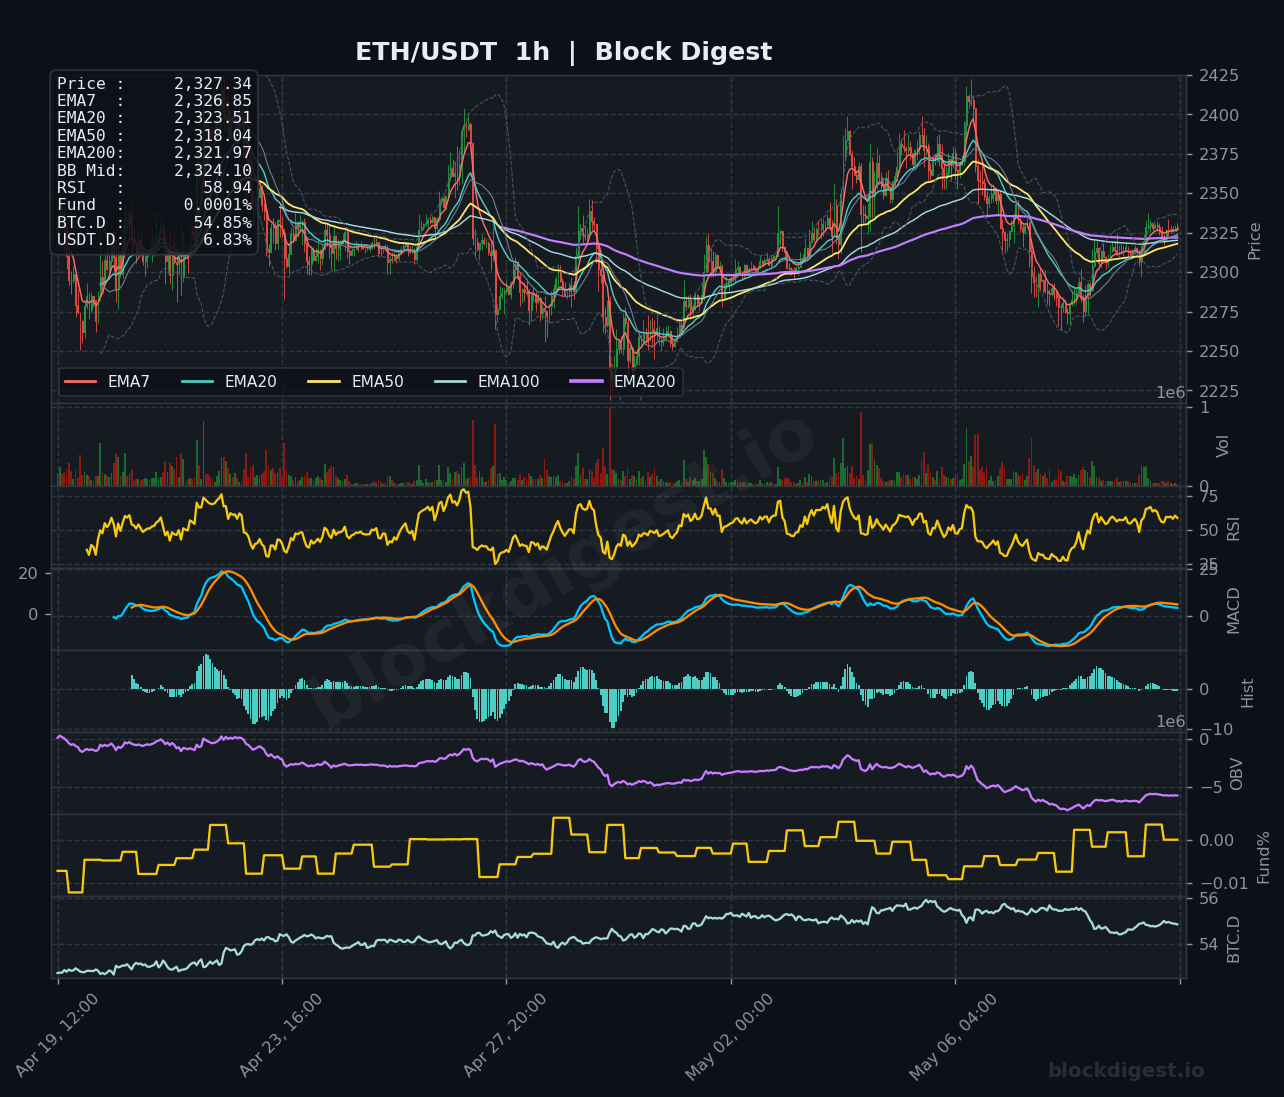
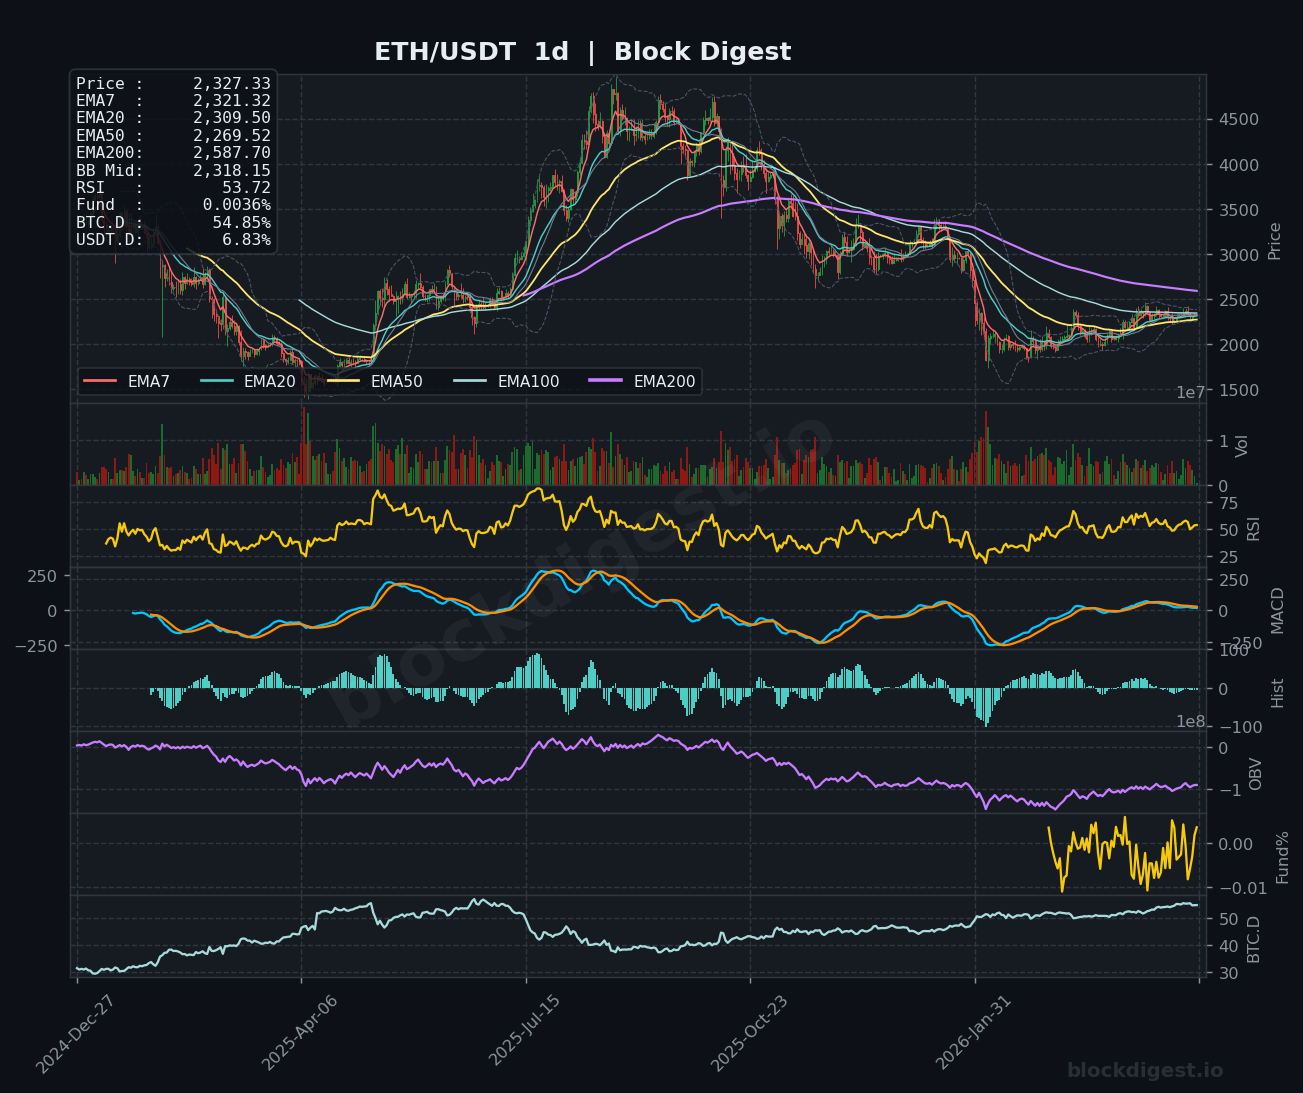
Ethereum is currently trading at $2,327.34, positioned above its 20-period EMA ($2,323.51 on 1h) but consolidating within a tight range near the middle Bollinger Band at $2,324.10. The daily timeframe reveals ETH trading below the critical EMA50 ($2,269.52) and significantly beneath the EMA200 ($2,587.70), indicating a bearish higher-timeframe structure despite recent stabilization. Price action remains compressed between $2,280-$2,400, with short-term EMAs on the 1h and 4h charts clustering tightly, suggesting an imminent volatility expansion. The overall market structure reflects consolidation within a longer-term downtrend, with bulls attempting to defend the $2,300 psychological level.
Multi-Timeframe Confluence
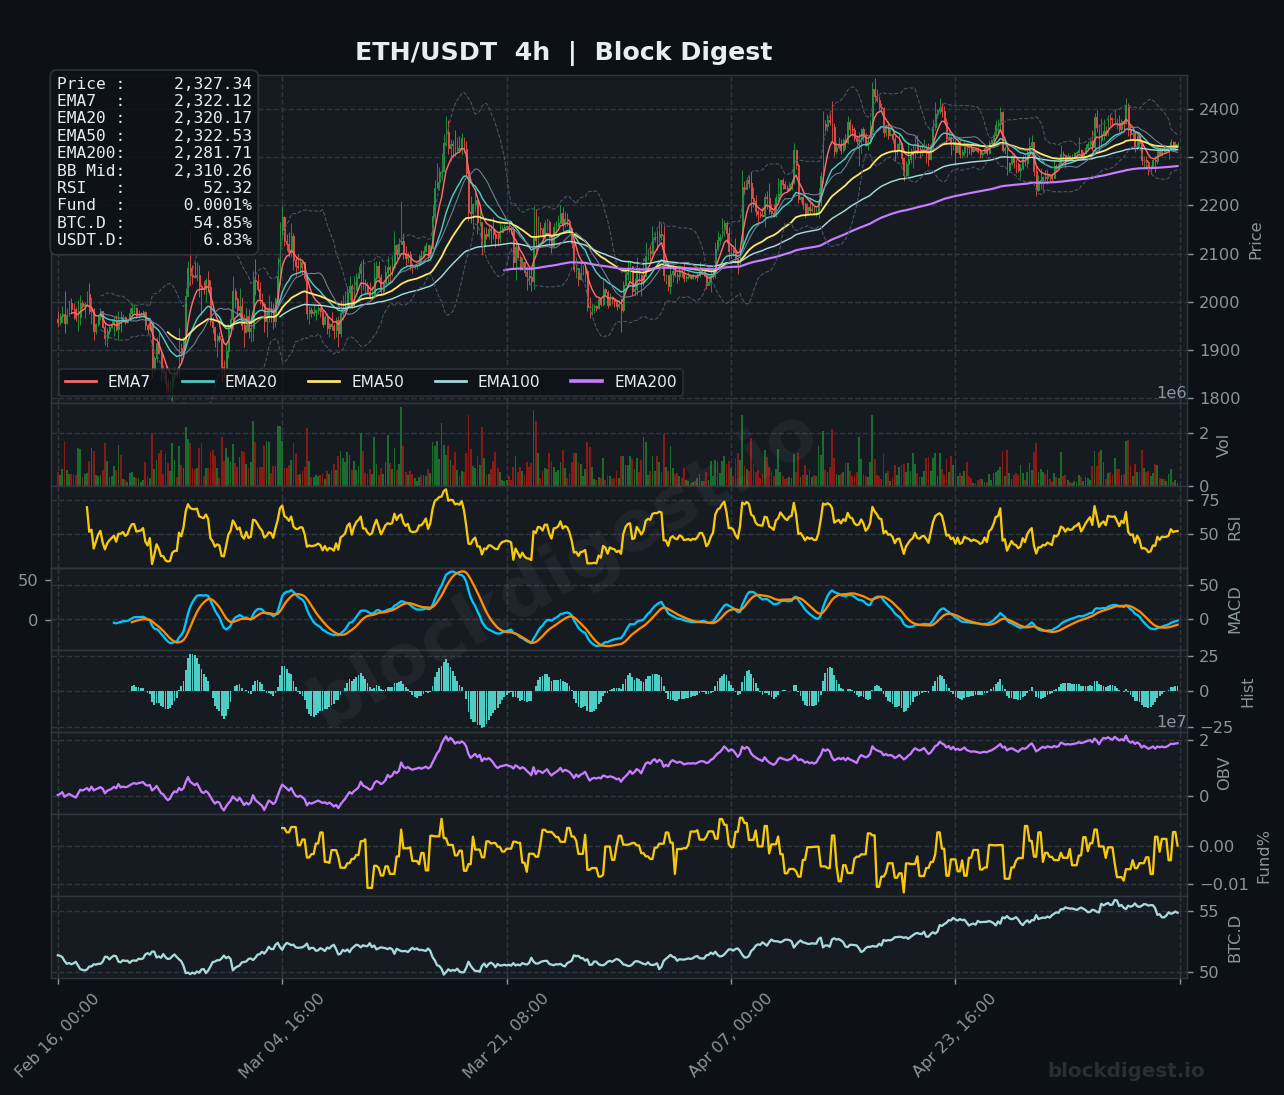
The hourly timeframe shows price coiling between the EMA7 ($2,326.85) and EMA20 ($2,323.51), with recent bullish crosses suggesting short-term upward momentum attempting to build. However, the 4h chart reveals price struggling near clustered resistance at EMA20-50 ($2,320-$2,322), with the EMA200 at $2,281.71 far below, indicating a significant recovery has occurred from recent lows. The daily timeframe confirms the intermediate bearish bias with price still trading below EMA50 and facing substantial overhead resistance at the EMA200 ($2,587.70). Critical confluence exists at the $2,320-$2,325 zone where multiple 4h EMAs converge, making this a decisive battleground for establishing short-term directional bias.
Key Levels to Watch
Resistance:
- $2,400-$2,425: Previous swing high visible on the 1h chart and upper Bollinger Band range; breaking this level would signal renewed bullish momentum and potential test of higher resistance zones
- $2,350-$2,370: Intermediate resistance zone aligning with recent rejection areas and the 4h chart’s previous consolidation ceiling
- $2,325-$2,330: Immediate overhead resistance where EMA clustering on 4h creates friction; short-term breakout confirmation level
Support:
- $2,300-$2,310: Critical psychological support zone reinforced by the BB Mid on 4h ($2,310.26) and recent accumulation activity
- $2,280-$2,285: Strong support confluence aligning with the 4h EMA200 ($2,281.71) and previous bounce zone; loss of this level would expose deeper retracement risk
- $2,250-$2,265: Major support area corresponding to recent lows and daily EMA50 ($2,269.52); breaking below would confirm bearish continuation
Momentum & On-Chain Signals
The RSI on the 1h timeframe reads 58.94, showing neutral-to-slightly-bullish momentum with room for upside expansion before entering overbought territory. The 4h RSI at 52.32 confirms balanced conditions, while the daily RSI at 53.72 suggests recovery from oversold levels but lacks conviction for sustained bullish continuation. MACD across all timeframes shows consolidation with the histogram flattening near the zero line, indicating indecision and awaiting directional catalyst. OBV trend remains relatively flat to slightly declining on the daily chart, suggesting distribution or lack of strong accumulation despite price stability. The Funding Rate at 0.0001% remains neutral, indicating balanced long-short positioning without significant leverage bias, while the extremely low rate could precede increased volatility once positioning shifts.
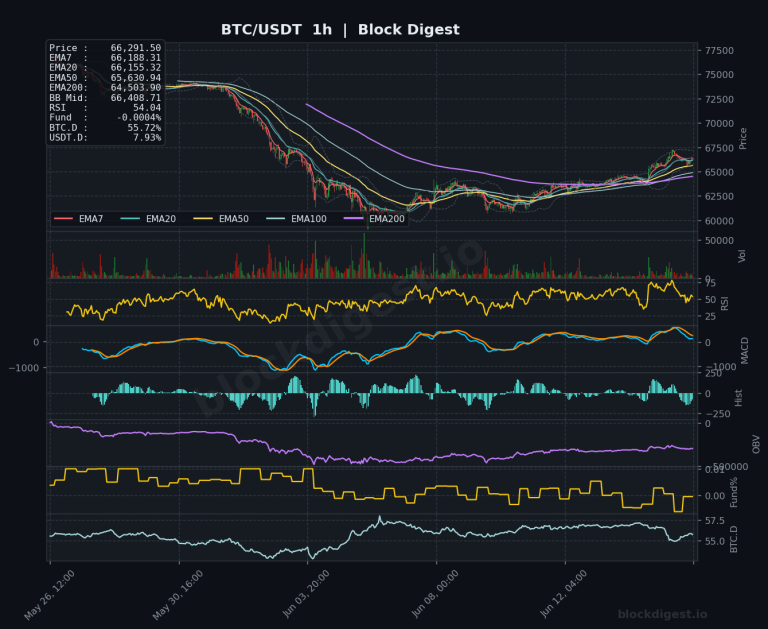
BTC Dominance & Market Sentiment
Bitcoin Dominance stands at 54.85%, reflecting elevated levels that typically pressure altcoins including ETH during risk-off periods or BTC outperformance phases. USDT Dominance at 6.83% shows moderate stablecoin allocation, suggesting neither aggressive risk-on accumulation nor panic-driven flight to safety. The elevated BTC.D combined with ETH’s underperformance relative to BTC’s recent 2.50% weekly gain indicates capital rotation favoring Bitcoin over large-cap altcoins. This dynamic creates headwinds for ETH unless broader altcoin sentiment improves or ETH-specific catalysts emerge to shift the narrative.
Risk Scenarios
Bullish case: A decisive 4h close above $2,350 with RSI breaking above 60 and volume expansion would confirm short-term trend reversal, targeting the $2,400-$2,425 resistance zone with potential extension toward $2,500 if BTC dominance peaks and rotational flows favor ETH. Sustained trading above clustered EMAs on 4h alongside improving OBV would validate accumulation.
Bearish case: Failure to reclaim $2,330 followed by a breakdown below $2,300 with increasing volume would expose the $2,280 support, with continuation risk toward $2,250-$2,265 and potentially testing the recent lows near $2,200 if daily EMA50 fails. Deteriorating momentum indicators and negative MACD crossover on 4h would confirm bearish scenario.
Outlook
ETH remains in a consolidation phase within a larger corrective structure, with neutral momentum indicators suggesting the next 24-48 hours will likely determine short-term direction. The immediate setup favors range-bound trading between $2,300-$2,350 until a clear catalyst emerges. Key triggers include a sustained break above $2,350 resistance with volume confirmation for bullish continuation, or loss of $2,300 support for bearish acceleration. Traders should monitor BTC dominance for potential rotation signals and watch for volume expansion on either breakout direction. The current neutral funding rate and balanced RSI readings suggest both scenarios remain viable, making risk management and level-based positioning essential. A decisive move outside the $2,280-$2,370 range would provide higher-probability directional trades aligned with momentum confirmation.
Disclaimer: This analysis is for informational purposes only and does not constitute financial advice. Cryptocurrency markets are highly volatile and unpredictable. All trading decisions should be made based on your own research and risk tolerance. Block Digest is not responsible for any financial losses incurred as a result of acting on this content.