ETH Daily Analysis — May 09, 2026
ETH Daily Analysis – May 09, 2026
Market Overview
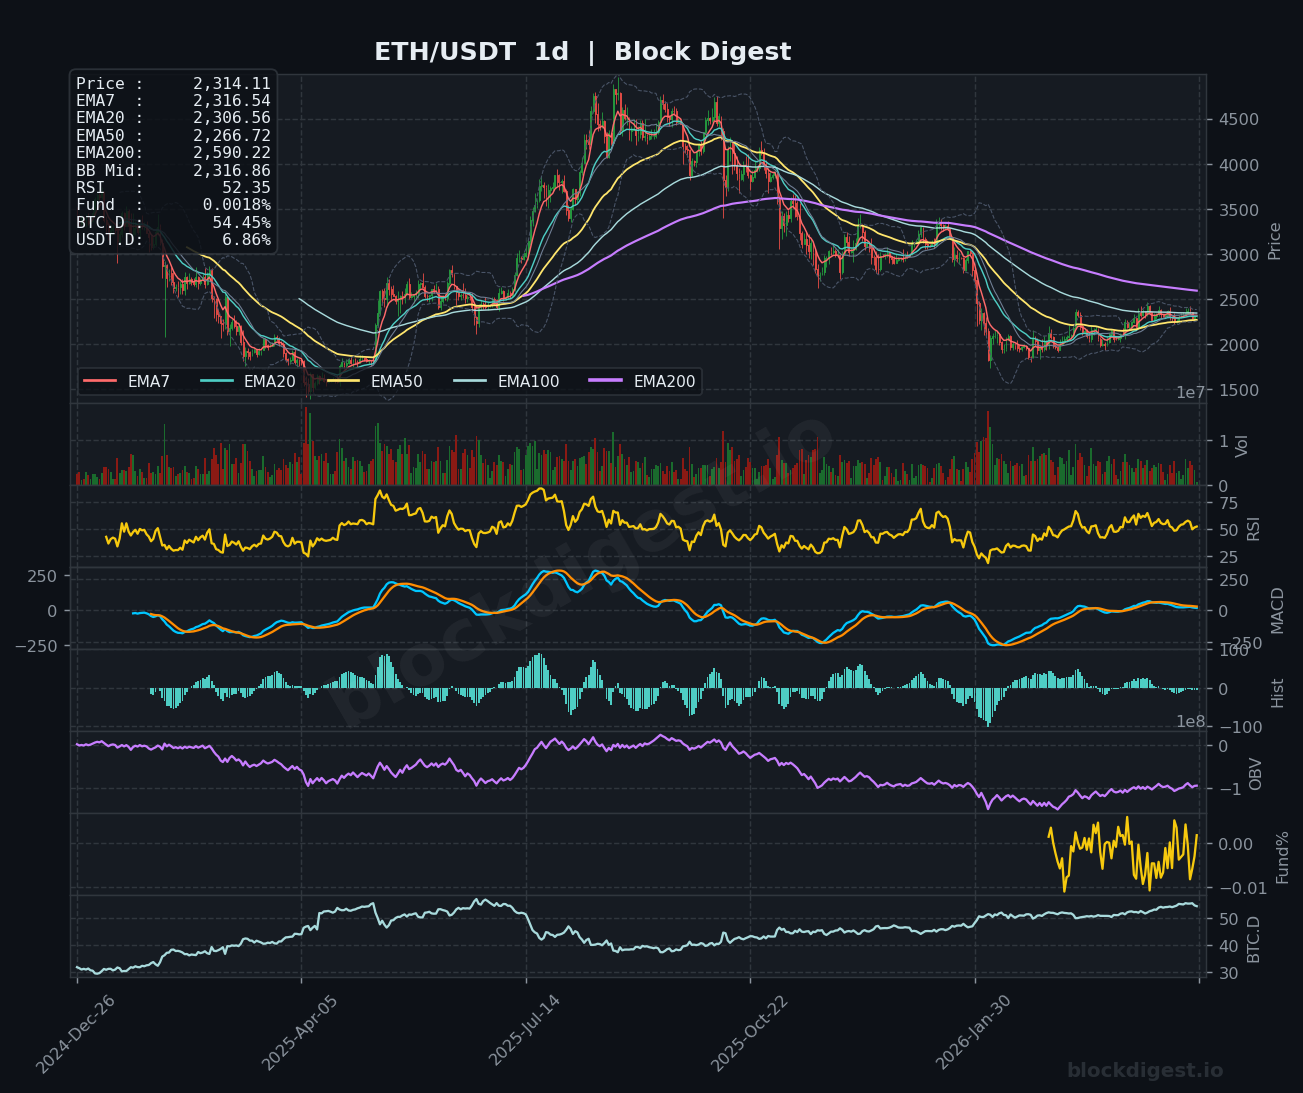
Ethereum is currently trading at $2,314.11, positioned in a consolidation phase just below its shorter-term moving averages across multiple timeframes. On the daily chart, price remains below the EMA50 ($2,266.72) and EMA200 ($2,590.22), indicating a longer-term bearish structure, though recent price action has stabilized above the $2,275 support zone. The Bollinger Band middle line sits at $2,316.86 on the daily timeframe, with price hugging this critical pivot level. ETH has recovered from the late-2025 capitulation lows near $1,800 but continues to face persistent resistance in establishing a sustained trend above the $2,400 level.
Multi-Timeframe Confluence
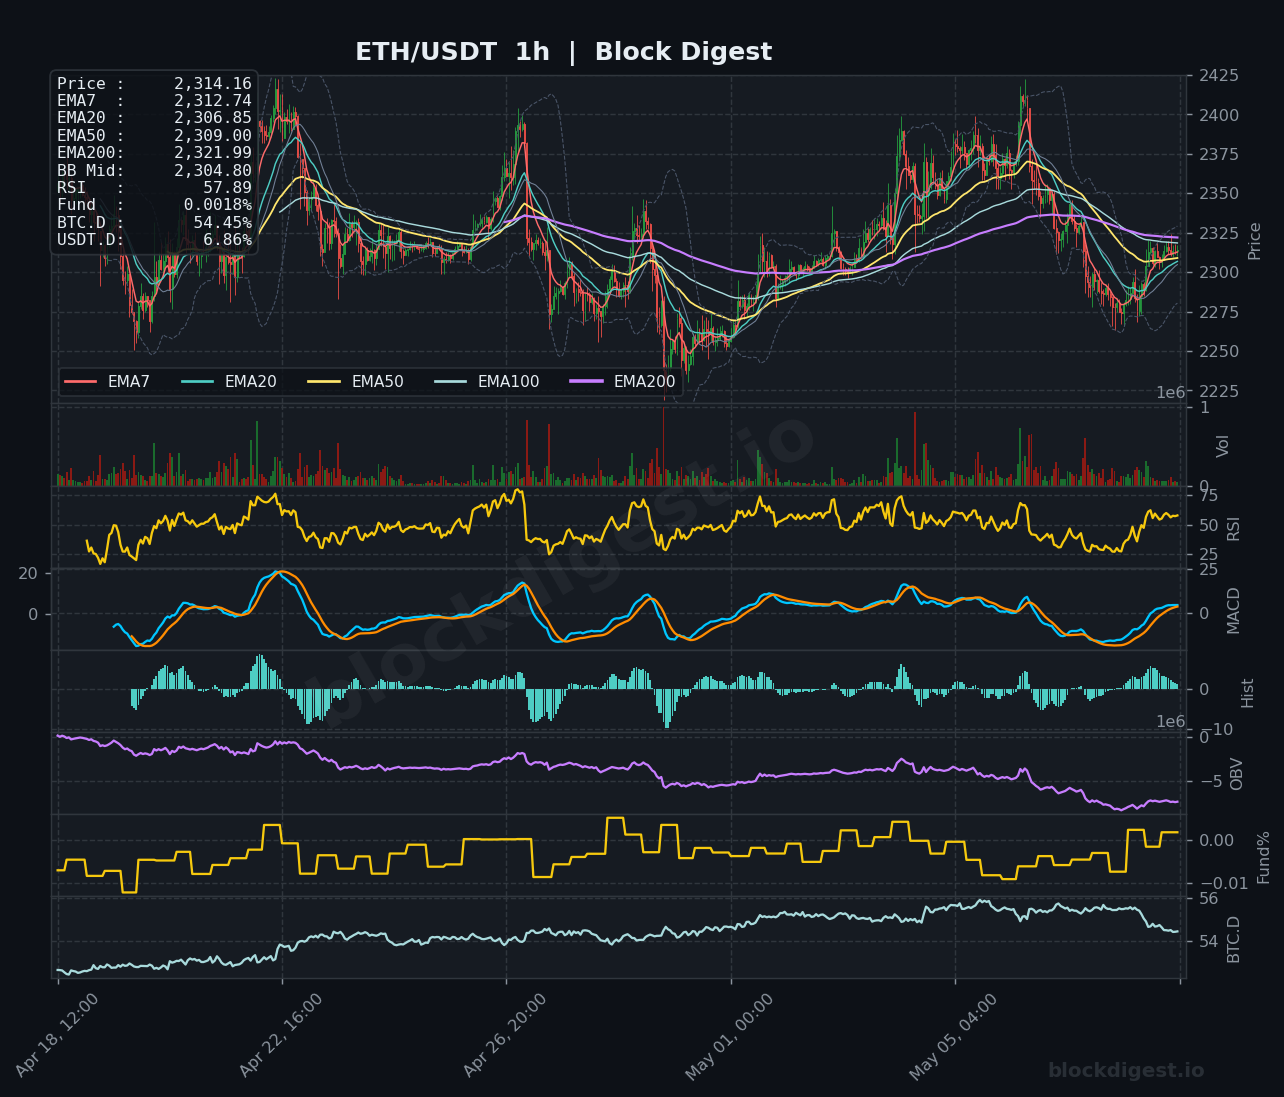
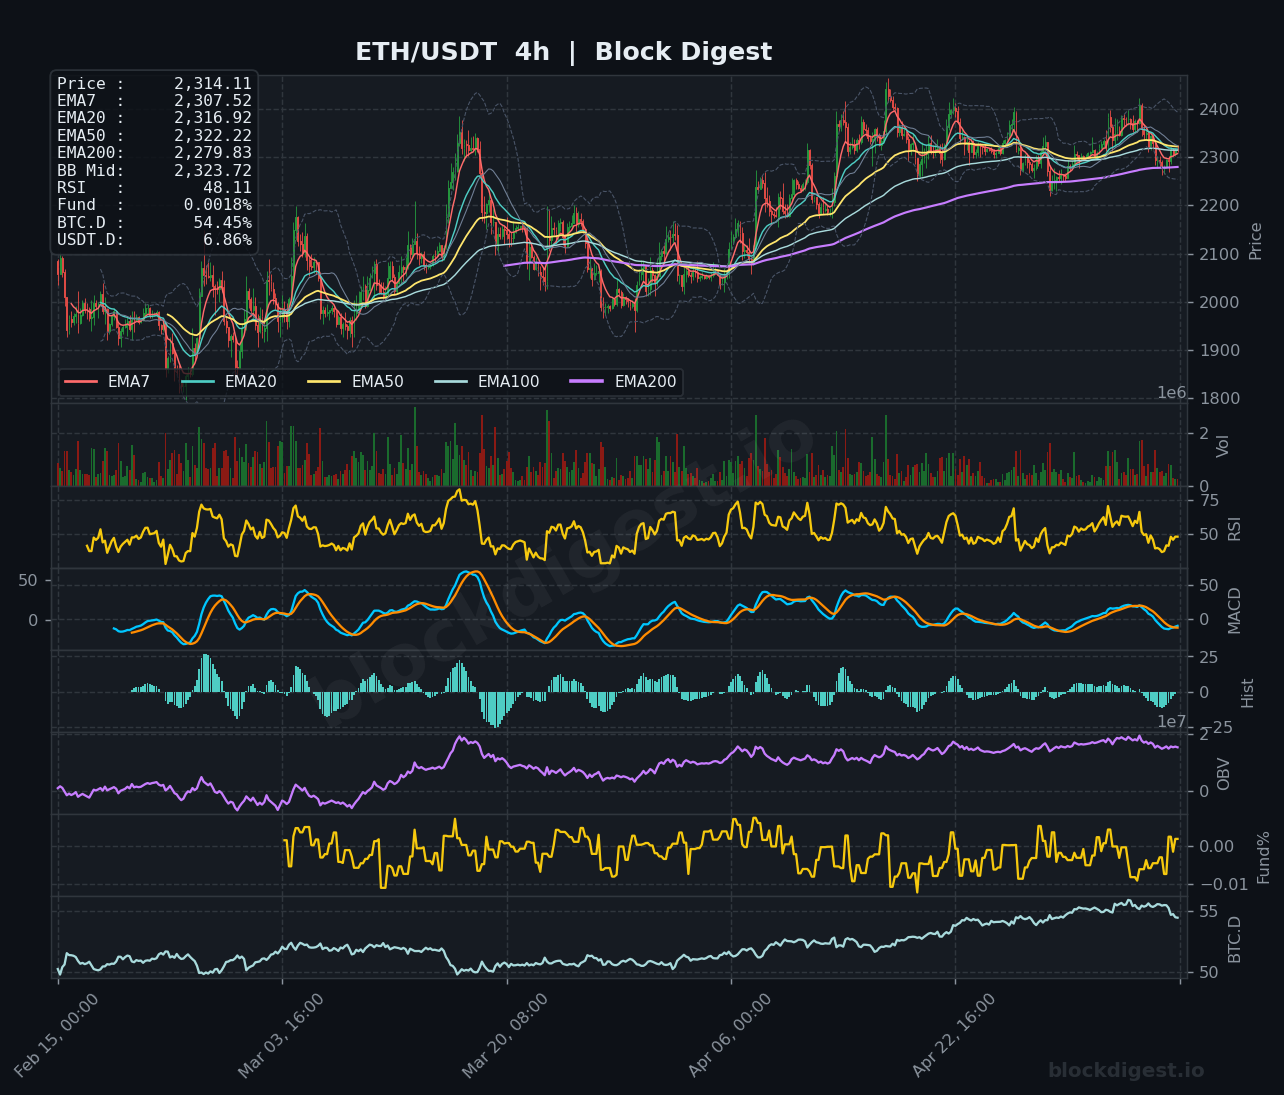
The multi-timeframe picture reveals a market in technical disagreement. On the 1-hour chart, price trades below all major EMAs with the EMA7 at $2,312.74 and EMA200 at $2,321.99, suggesting immediate bearish pressure. The 4-hour timeframe shows a similar bearish EMA stack with price below the EMA20 ($2,316.92) and struggling to reclaim the EMA50 ($2,322.22). However, the daily chart presents a more neutral structure with price attempting to hold above the EMA20 ($2,306.56) while remaining capped by the EMA50. This lack of directional alignment across timeframes indicates ongoing indecision, with the $2,300-$2,325 range serving as a critical battleground between bulls and bears.
Key Levels to Watch
Resistance:
- $2,325-$2,340: The Bollinger Band middle on the 4-hour chart ($2,323.72) converges with the EMA50 cluster, representing immediate overhead supply and the gateway to higher levels.
- $2,400-$2,425: A significant prior consolidation zone visible on the 1-hour chart where price peaked in early May before rejection; reclaiming this level would signal a return of bullish momentum.
- $2,500-$2,550: The psychological half-thousand level and the approximate location of the daily EMA50 resistance, marking the boundary between recovery and potential trend reversal.
Support:
- $2,275-$2,290: Recent swing low and the lower Bollinger Band on the 1-hour timeframe; loss of this level would suggest renewed selling pressure.
- $2,200-$2,230: A crucial demand zone that has provided support multiple times, aligning with the daily EMA7 ($2,316.54) when tested from below.
- $2,050-$2,100: The major support floor from the February-March base, representing the last line of defense before challenging the 2025 capitulation lows.
Momentum & On-Chain Signals
Momentum indicators paint a cautious picture across timeframes. The RSI on the 1-hour chart reads 57.89, showing neutral-to-slightly bullish momentum but lacking conviction for a sustained breakout. The 4-hour RSI at 48.11 indicates weakening momentum as price consolidates, while the daily RSI at 52.35 suggests equilibrium between buyers and sellers. The MACD across all timeframes shows minimal histogram strength with both lines hovering near zero, reflecting the current consolidation and lack of directional conviction. Notably, the MACD on the 4-hour chart appears to be flattening after a brief bullish crossover attempt. OBV trends show relatively stable volume distribution without significant accumulation or distribution patterns, suggesting market participants are positioned defensively. The funding rate at 0.0018% remains marginally positive, indicating a slight long bias but without excessive leverage that might trigger liquidation cascades.
BTC Dominance & Market Sentiment
Bitcoin dominance stands at 54.45%, reflecting continued capital concentration in BTC amid uncertain market conditions. This elevated dominance level typically correlates with risk-off sentiment in the broader crypto market, as capital flows prioritize Bitcoin’s relative safety over alternative assets including Ethereum. USDT dominance at 6.86% has increased from earlier levels visible on the daily chart, suggesting defensive positioning as stablecoin holdings rise—a bearish signal for risk assets. The combination of high BTC.D and rising USDT.D indicates that while Bitcoin maintains its leadership, the overall market appetite remains cautious, which could limit Ethereum’s upside potential unless broader sentiment shifts toward risk-on conditions and altcoin rotation.
Risk Scenarios
Bullish case: A decisive reclaim of the $2,325-$2,340 resistance zone accompanied by RSI breaking above 60 on the 4-hour chart would confirm renewed bullish momentum, targeting the $2,400 level and potentially the $2,500-$2,550 zone. Sustained trading above the EMA50 across all timeframes with expanding OBV would validate accumulation and set the stage for a move toward challenging the EMA200 at $2,590.
Bearish case: Failure to hold the $2,275-$2,290 support with RSI dropping below 45 on the 4-hour chart would signal weakness, opening the path toward $2,200-$2,230 and potentially the $2,050-$2,100 major support zone. A breakdown below $2,200 with increasing volume and bearish MACD crossovers would confirm distribution and could accelerate selling toward retesting the 2025 lows.
Outlook
Ethereum remains range-bound in a consolidation pattern with no clear directional bias as of May 09, 2026. The immediate focus is on whether bulls can reclaim and hold above $2,325-$2,340 or if bears will reassert control by breaking the $2,275 support floor. Given the neutral momentum indicators, elevated BTC dominance, and rising stablecoin dominance, the path of least resistance appears sideways-to-slightly-lower in the near term. Traders should watch for a decisive break outside the $2,275-$2,340 range on increased volume to signal the next directional move. The critical trigger for a bullish thesis reversal would be a confirmed daily close above $2,400, while a breakdown below $2,230 would necessitate defensive positioning.
Disclaimer: This analysis is for informational purposes only and does not constitute financial advice. Cryptocurrency markets are highly volatile and unpredictable. All trading decisions should be made based on your own research and risk tolerance. Block Digest is not responsible for any financial losses incurred as a result of acting on this content.