BTC Daily Analysis — May 09, 2026
BTC Daily Analysis – May 09, 2026
Market Overview
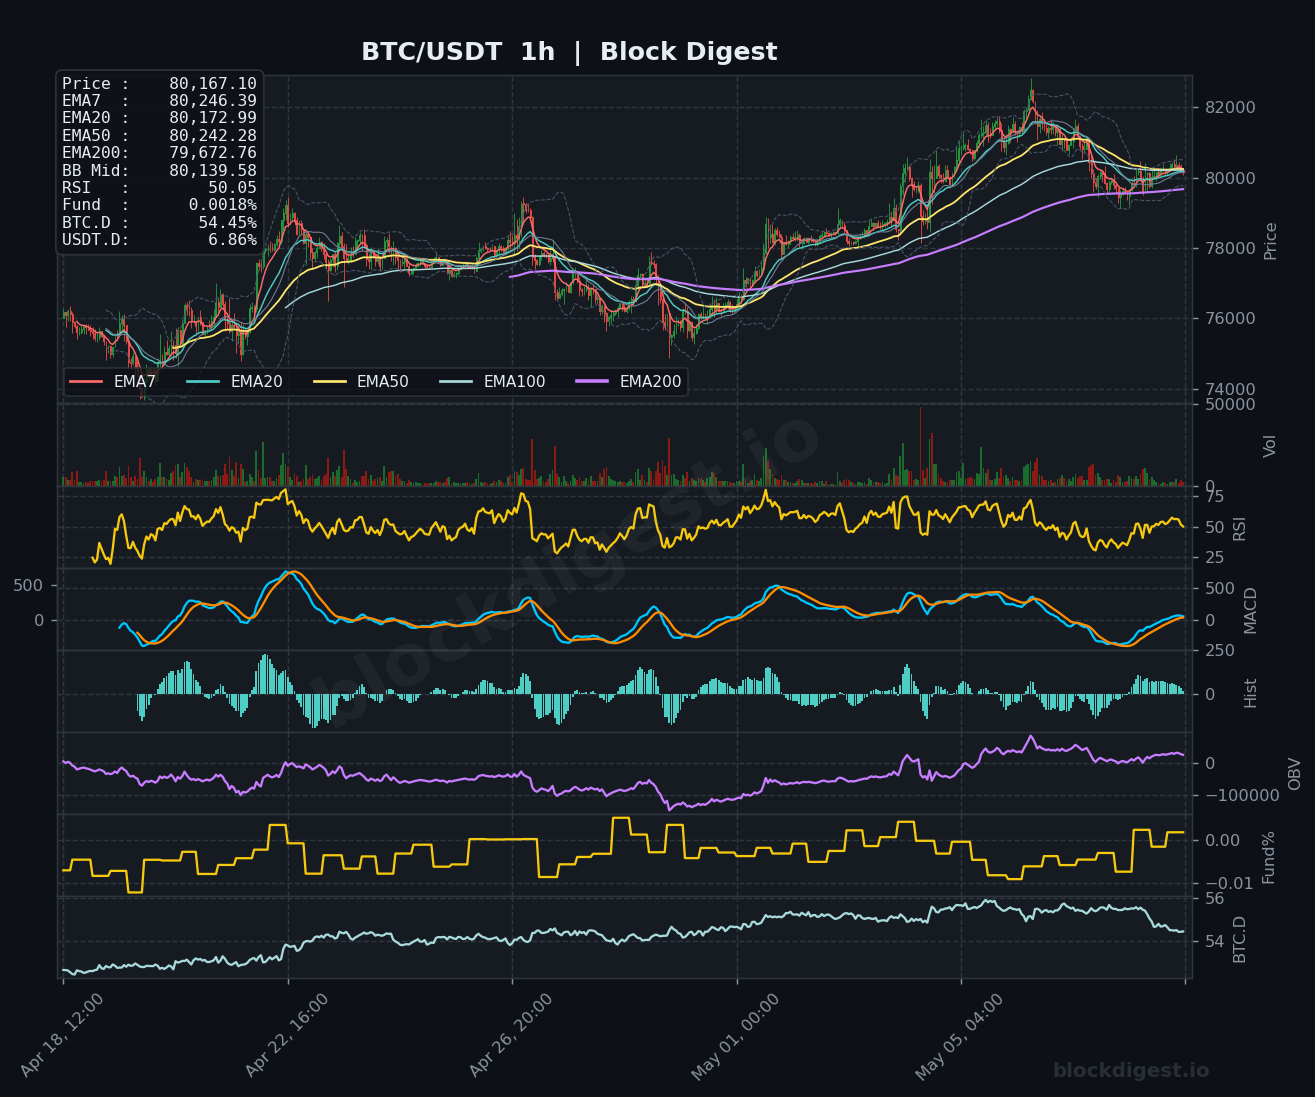
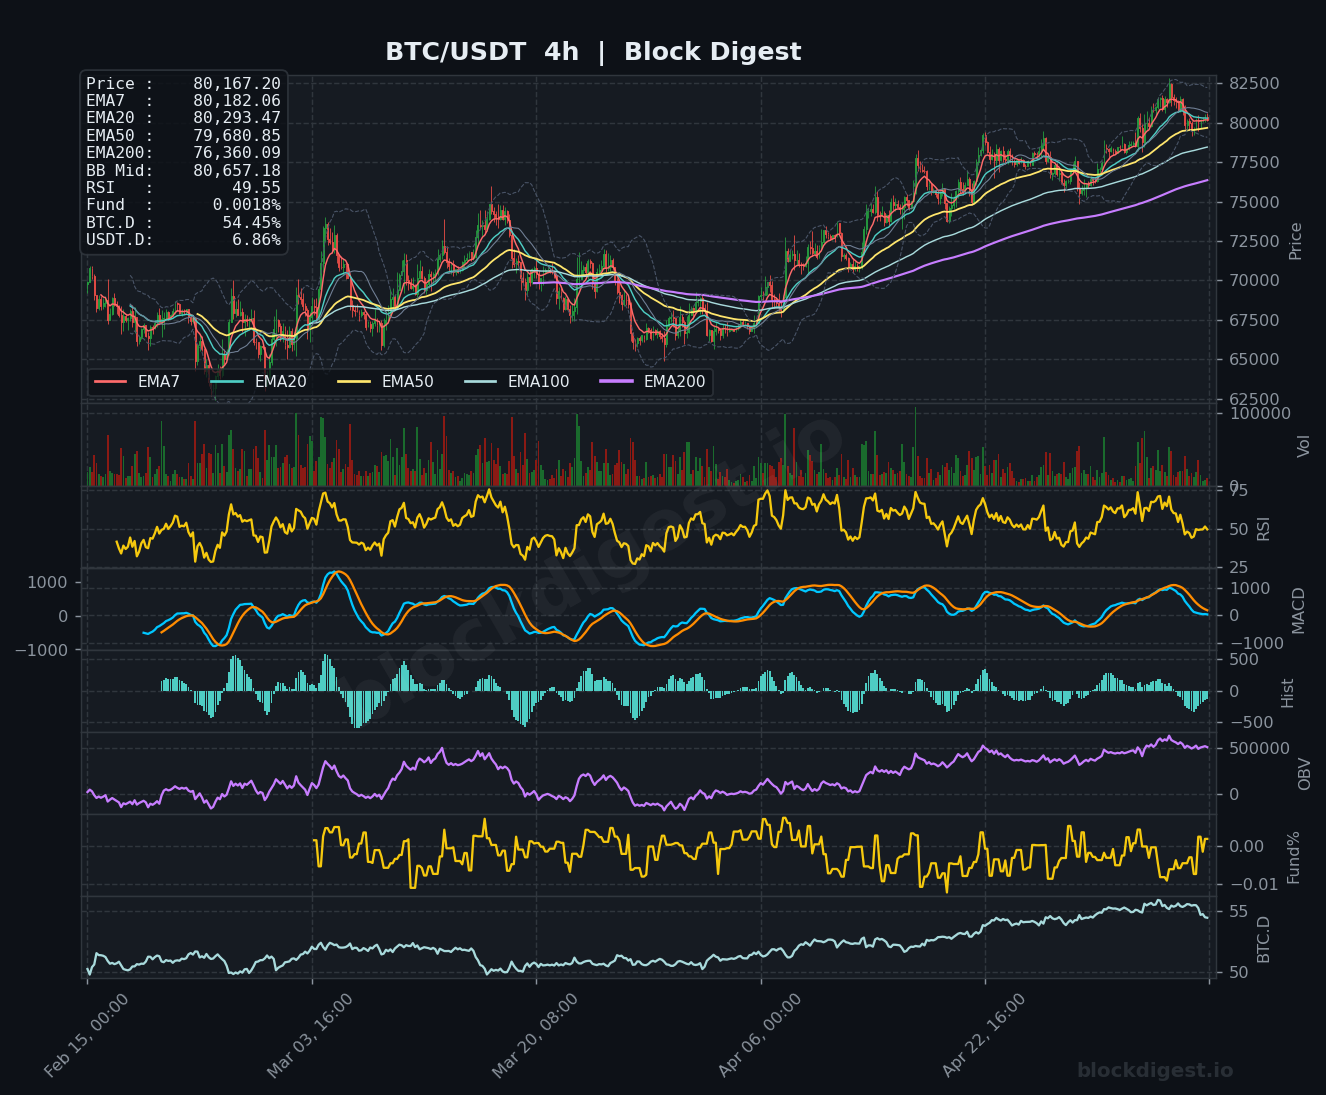
Bitcoin is currently trading at $80,167.20, positioned in a critical technical zone as it consolidates below shorter-term EMAs while attempting to establish support above the key $80,000 psychological level. The daily timeframe reveals price trading below the EMA7 ($79,863.23) but still above the EMA20 ($78,123.48), suggesting short-term weakness within a broader consolidation phase. Price is trading near the upper Bollinger Band on the 1h timeframe ($80,139.58) while remaining compressed within tighter ranges on the 4h chart, indicating indecision after recent volatility. The daily structure shows BTC recovering from a significant drawdown, with price action now testing whether bulls can reclaim momentum or whether this represents a lower high formation.
Multi-Timeframe Confluence
The three timeframes present a mixed picture with critical divergences that warrant caution. The 1h chart shows price slightly below most shorter EMAs (EMA7: $80,246.39, EMA20: $80,172.99), indicating immediate bearish pressure, while the 4h timeframe exhibits similar positioning with price below the EMA7 ($80,182.06) and EMA20 ($80,293.47), suggesting the short-term trend has lost upward momentum. However, the daily timeframe provides a more constructive view with price still above the EMA20 and approaching the EMA50 ($75,502.62), which has served as dynamic support during the recovery phase. The lack of alignment between faster EMAs across timeframes suggests choppy conditions, though the $79,680-$80,300 range appears as a critical confluence zone where multiple EMA levels from the 4h chart converge, making this area decisive for near-term direction.
Key Levels to Watch
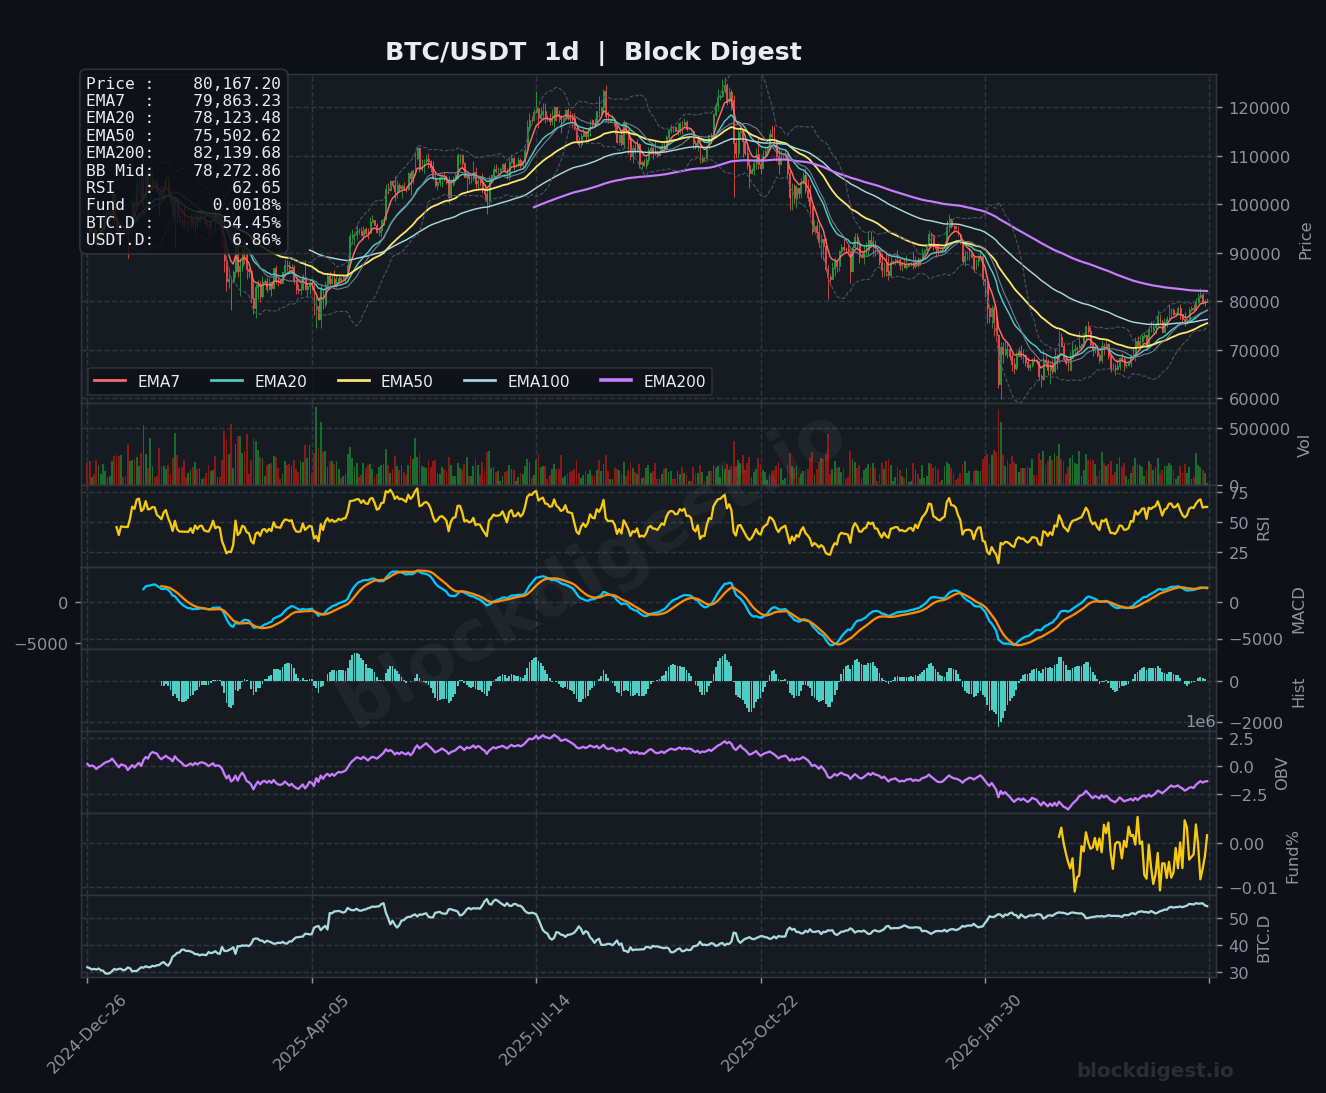
Resistance:
- $80,650-$80,700: Bollinger Band mid-point on the 4h chart and previous local highs; a breakout above this level would signal renewed bullish momentum
- $82,140: The EMA200 on the daily chart and recent swing high that marked the apex of the recovery rally; reclaiming this level would confirm higher-high formation
- $82,500: The peak from early May representing a major resistance zone and psychological barrier that rejected price aggressively
Support:
- $79,680-$79,860: Critical confluence zone combining the daily EMA7, 4h EMA50, and recent consolidation lows; this represents the immediate defense line for bulls
- $78,120-$78,270: The daily EMA20 and daily Bollinger Band mid-point ($78,272.86), serving as a major support area that has held during recent tests
- $76,360: The 4h EMA200 and structural support from the previous recovery phase; losing this level would signal a deeper retracement toward $75,500
Momentum & On-Chain Signals
RSI readings present a neutral-to-bearish setup across timeframes, with the 1h RSI at 50.05 (neutral), 4h RSI at 49.55 (slight bearish bias), and daily RSI at 62.65 (moderately bullish but declining from overbought territory). This divergence suggests waning momentum on lower timeframes while the daily still retains some upside potential. The MACD on the 1h and 4h charts shows bearish crossovers with histograms trending negative, indicating short-term selling pressure, while the daily MACD histogram remains positive but appears to be flattening. OBV trends show declining accumulation across all timeframes, with particularly weak volume support on recent price advances—suggesting distribution rather than conviction buying. The funding rate at 0.0018% (neutral-to-slightly-positive) indicates minimal leverage positioning, which could mean limited cascade risk but also suggests lack of strong directional conviction from traders.
BTC Dominance & Market Sentiment
BTC dominance stands at 54.45%, maintaining relatively elevated levels that signal Bitcoin’s defensive posture within the broader crypto market. This elevated dominance typically indicates risk-off behavior where capital flows into BTC as a safe haven rather than rotating into altcoins, suggesting cautious market sentiment despite recent institutional interest. USDT dominance at 6.86% remains elevated compared to bull market norms, confirming that significant capital remains on the sidelines in stablecoins rather than deployed in risk assets. This combination suggests market participants are positioning defensively, waiting for clearer directional signals before committing capital aggressively, which aligns with the consolidation pattern observed in price action.
Risk Scenarios
Bullish case: A decisive 4h close above $80,650 with accompanying volume expansion would trigger bullish continuation, targeting the $82,140 EMA200 resistance and potentially the $82,500 swing high. Confirmation would require RSI reclaiming 60+ on the 4h chart and MACD generating a bullish crossover, with a sustained funding rate above 0.01% indicating leveraged long positioning supporting the move.
Bearish case: Failure to hold the $79,680-$79,860 confluence support would likely trigger accelerated selling toward the daily EMA20 at $78,120, with further breakdown risk extending to $76,360. This scenario would be confirmed by 4h RSI dropping below 40, MACD histogram expanding negatively, and OBV showing continued distribution patterns, signaling that the recent recovery rally is losing structural integrity.
Outlook
Bitcoin remains at a critical inflection point where the next 24-48 hours will determine whether the recovery maintains momentum or rolls over into deeper consolidation. The immediate bias leans neutral-to-slightly-bearish given the short-term EMA compression, weakening momentum indicators, and declining OBV across timeframes. Key triggers to monitor include the $79,680 support level—breaking below would shift the bias decisively bearish—and the $80,650 resistance, which needs to be reclaimed with volume to revive bullish prospects. The $79,680-$80,650 range defines the current battleground, and a break in either direction should provide the next significant directional move. Until then, range-bound choppy action is the most likely scenario, with traders advised to wait for clear breakout confirmation before establishing larger directional positions.
Disclaimer: This analysis is for informational purposes only and does not constitute financial advice. Cryptocurrency markets are highly volatile and unpredictable. All trading decisions should be made based on your own research and risk tolerance. Block Digest is not responsible for any financial losses incurred as a result of acting on this content.