Weekly Market Context
TRON led the covered coins against BTC over the completed seven-day window, while its confirmed daily swing structure remains bearish. The recent relative gain has not yet established a daily uptrend.
Within BlockDigest’s fixed six-coin basket, 0 of 6 available daily structures are bullish, 6 bearish and 0 neutral. These classifications describe confirmed swing sequences. They do not measure the entire altcoin market or predict the next week’s returns.
Daily and weekly swing trends oppose one another for SOL, DOGE, LTC. The shorter-term direction therefore conflicts with the higher-timeframe backdrop.
The trailing seven-day comparison runs from the daily close ending 2026-10-12 to the daily close ending 2026-10-19 UTC. It is a completed historical window, separate from the forward scenario window.
Weekly Snapshot Table
Daily prices and indicators below use the completed candle ending 2026-10-19 00:00 UTC. The latest completed four-hour closes and their period-end times are reported in the individual coin sections.
| Coin | Last daily close (USDT) | Trailing 7D | Perpetual ratio vs BTC, 7D | Daily RSI | Structural bias |
|---|---|---|---|---|---|
| SOL | 104.07 | -6.50% | -4.62% | 38.88 | bearish |
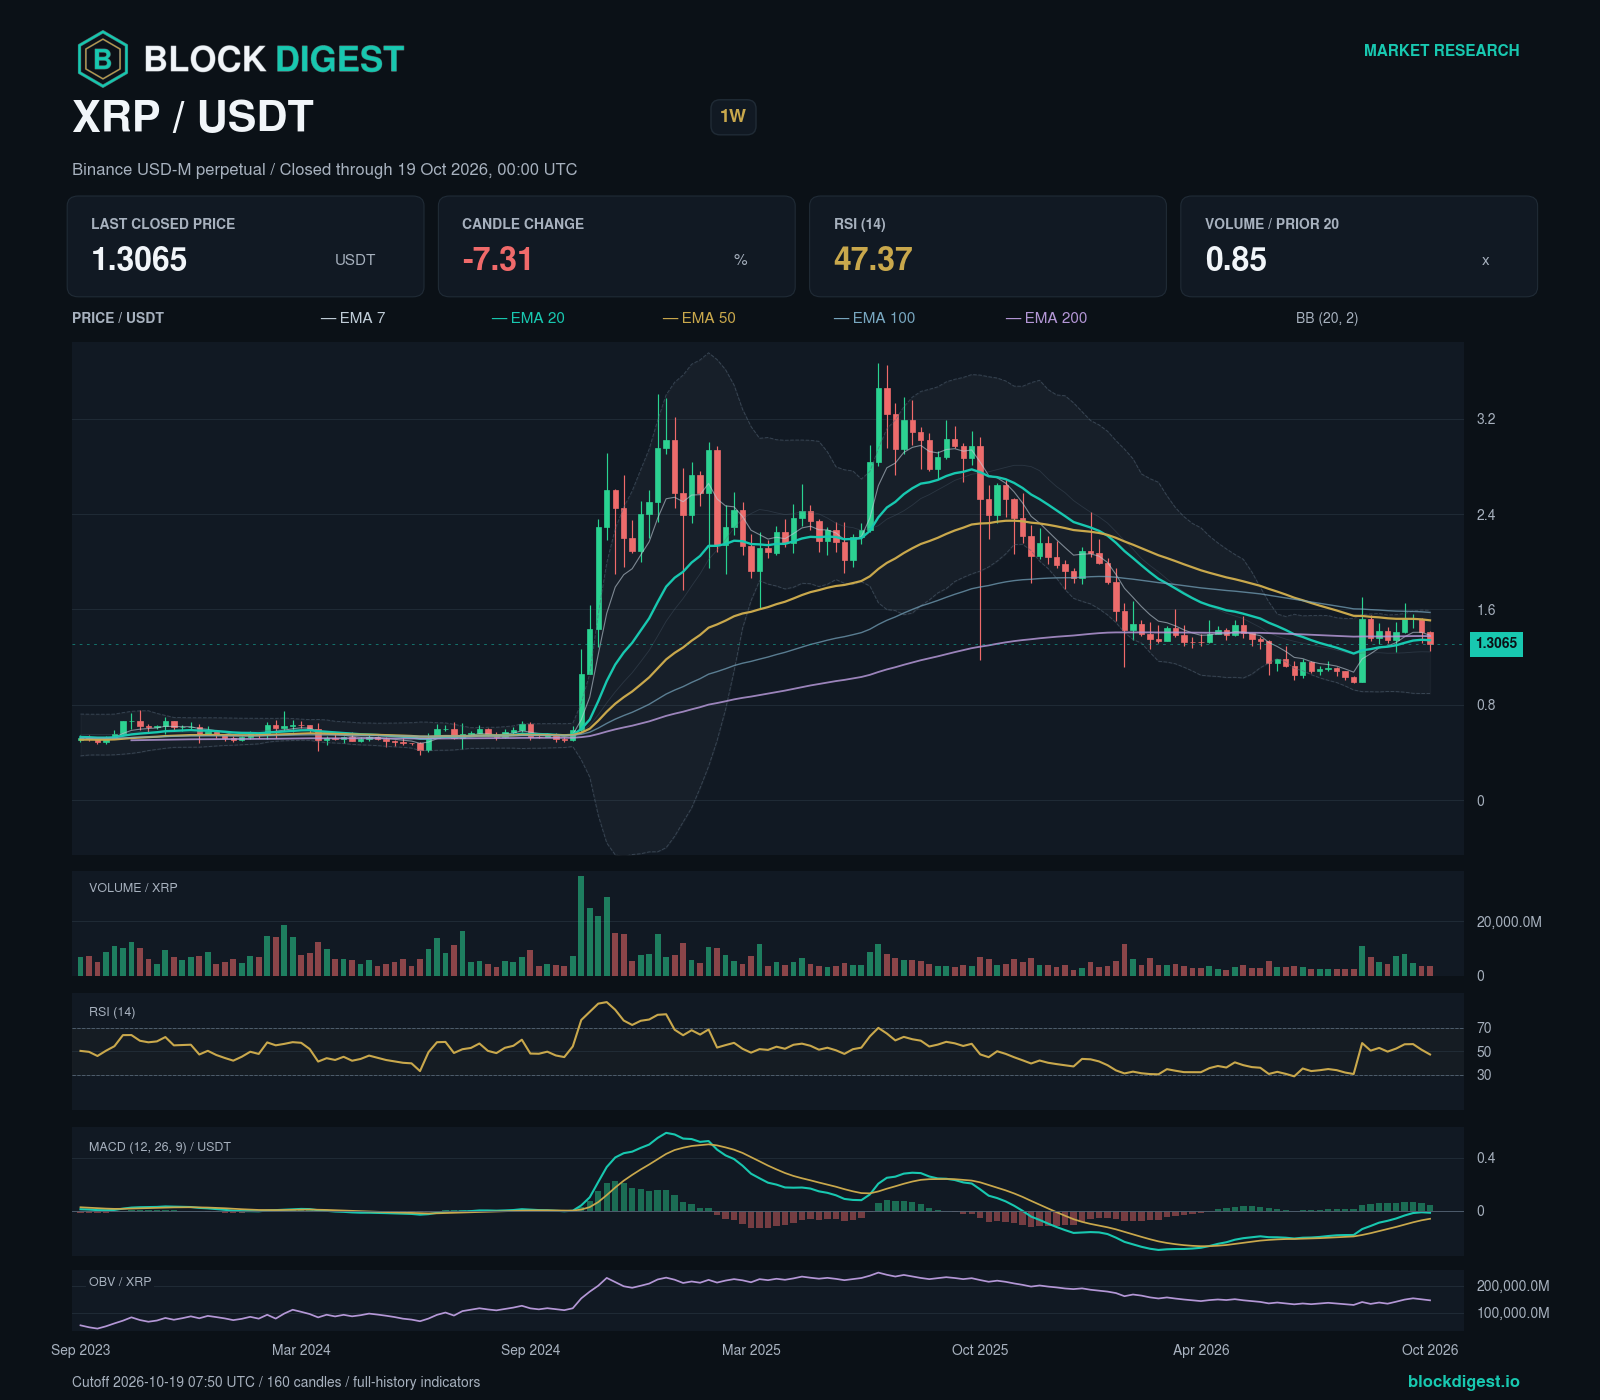
| XRP | 1.3065 | -7.31% | -5.45% | 37.10 | bearish |
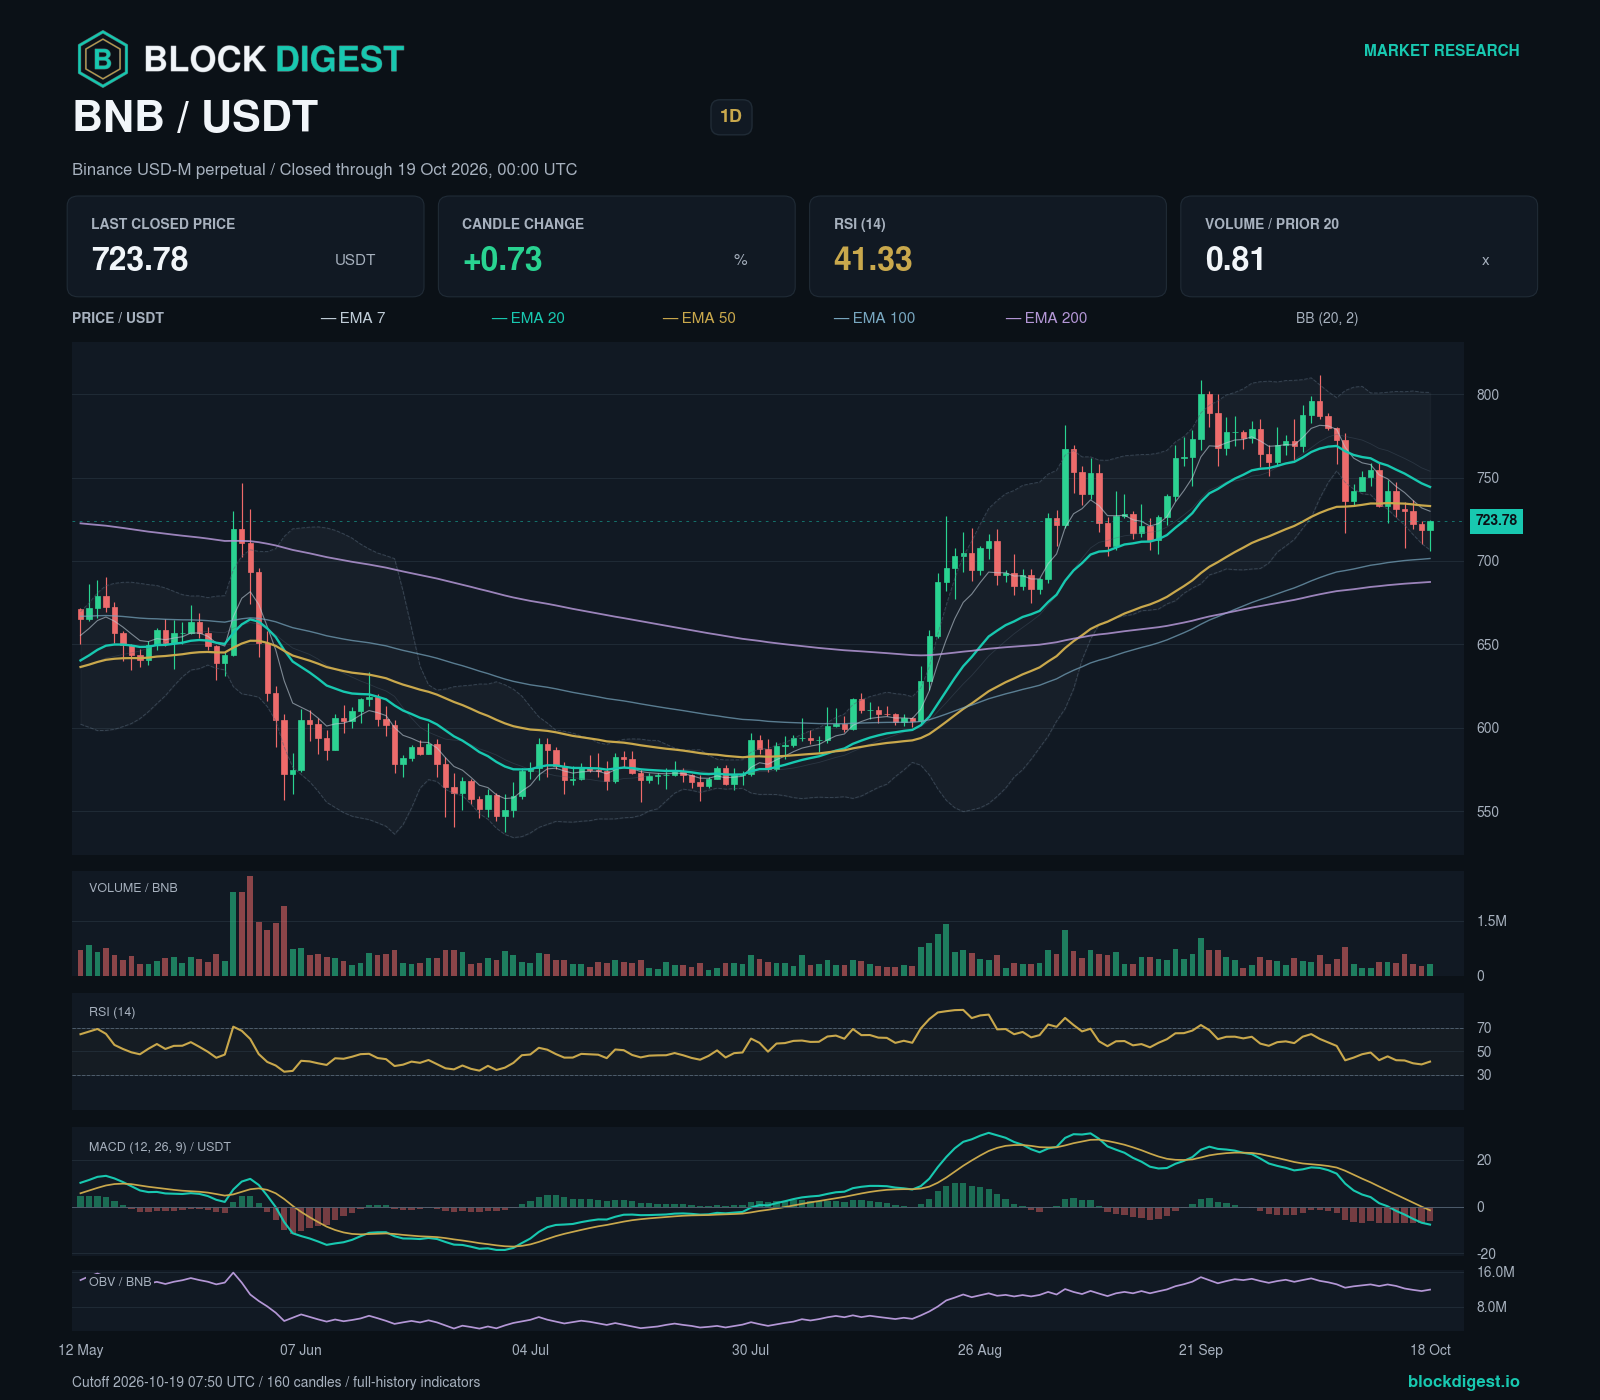
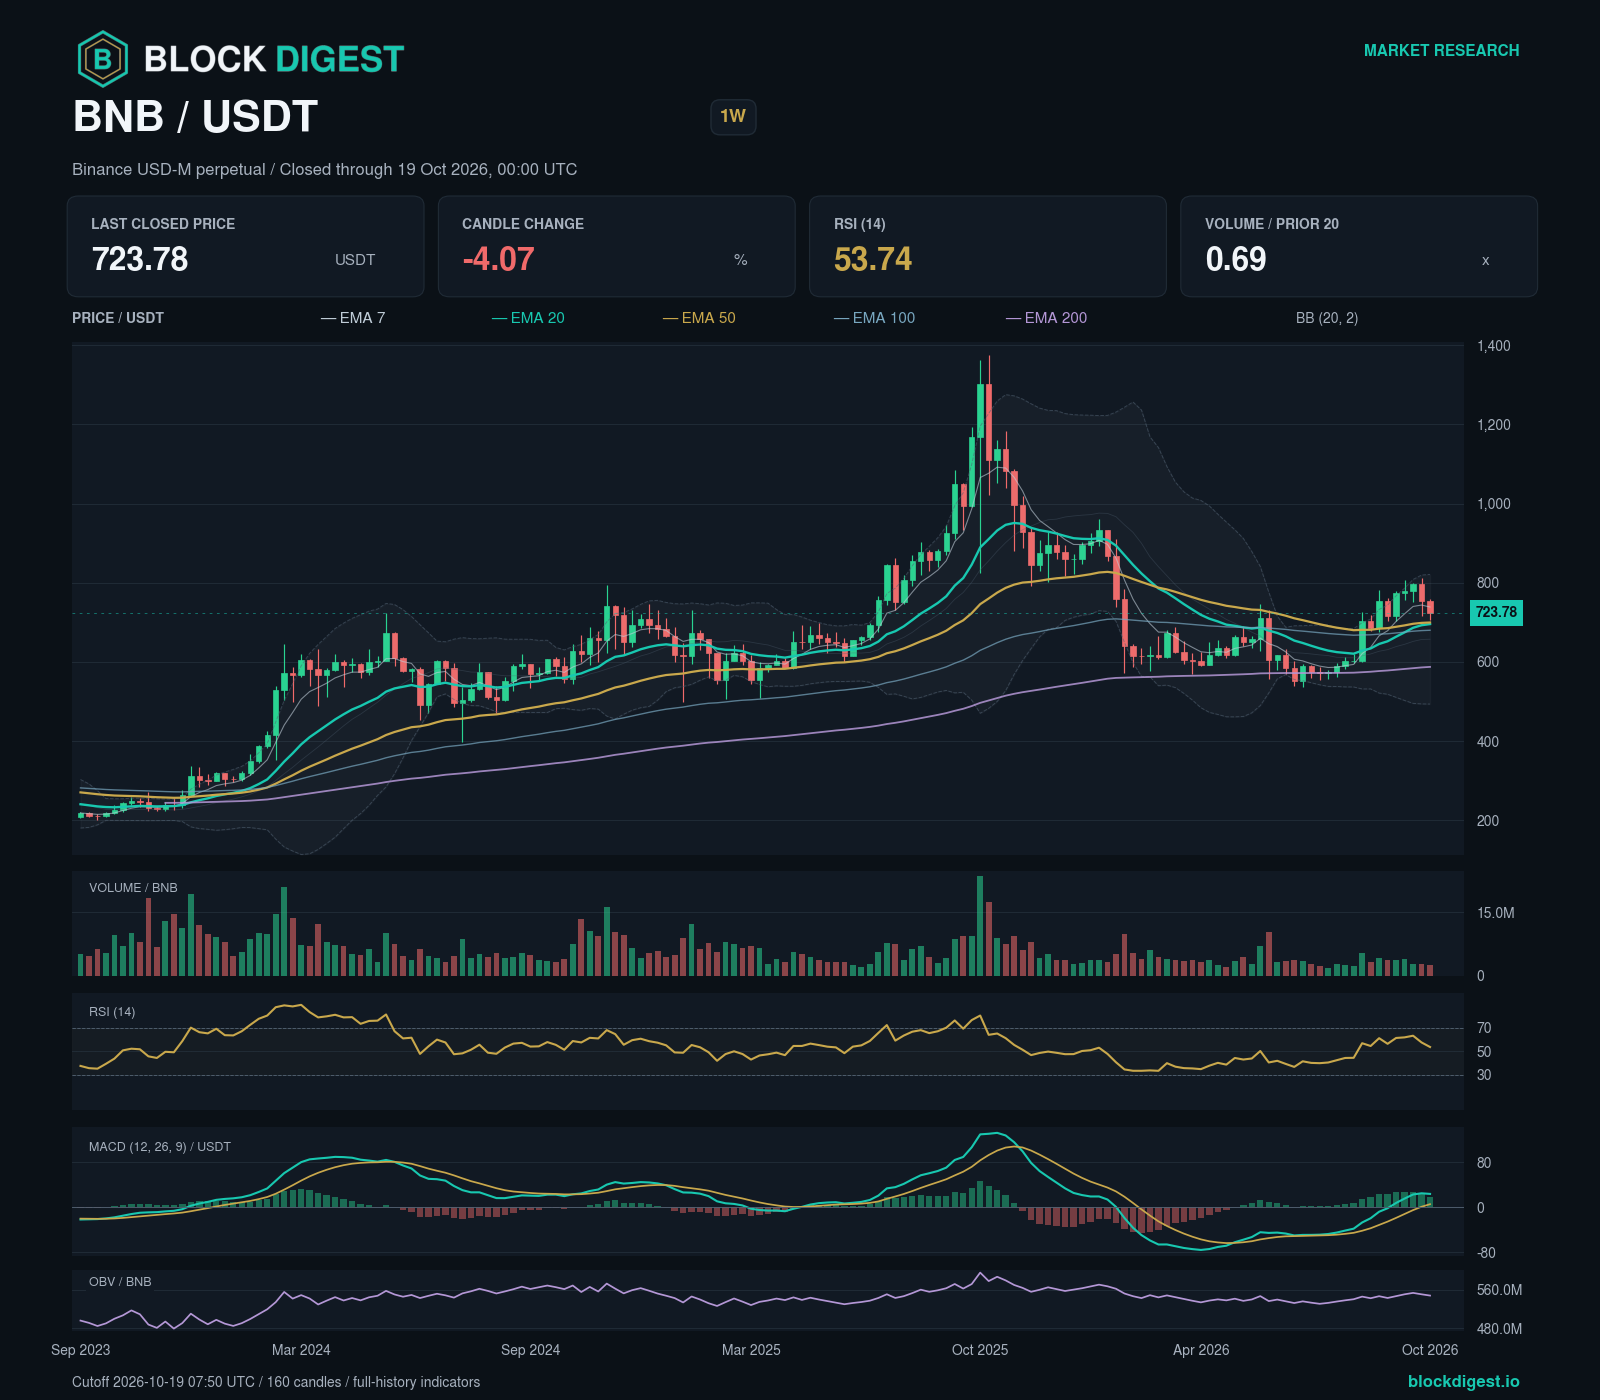
| BNB | 723.78 | -4.07% | -2.14% | 41.33 | bearish |
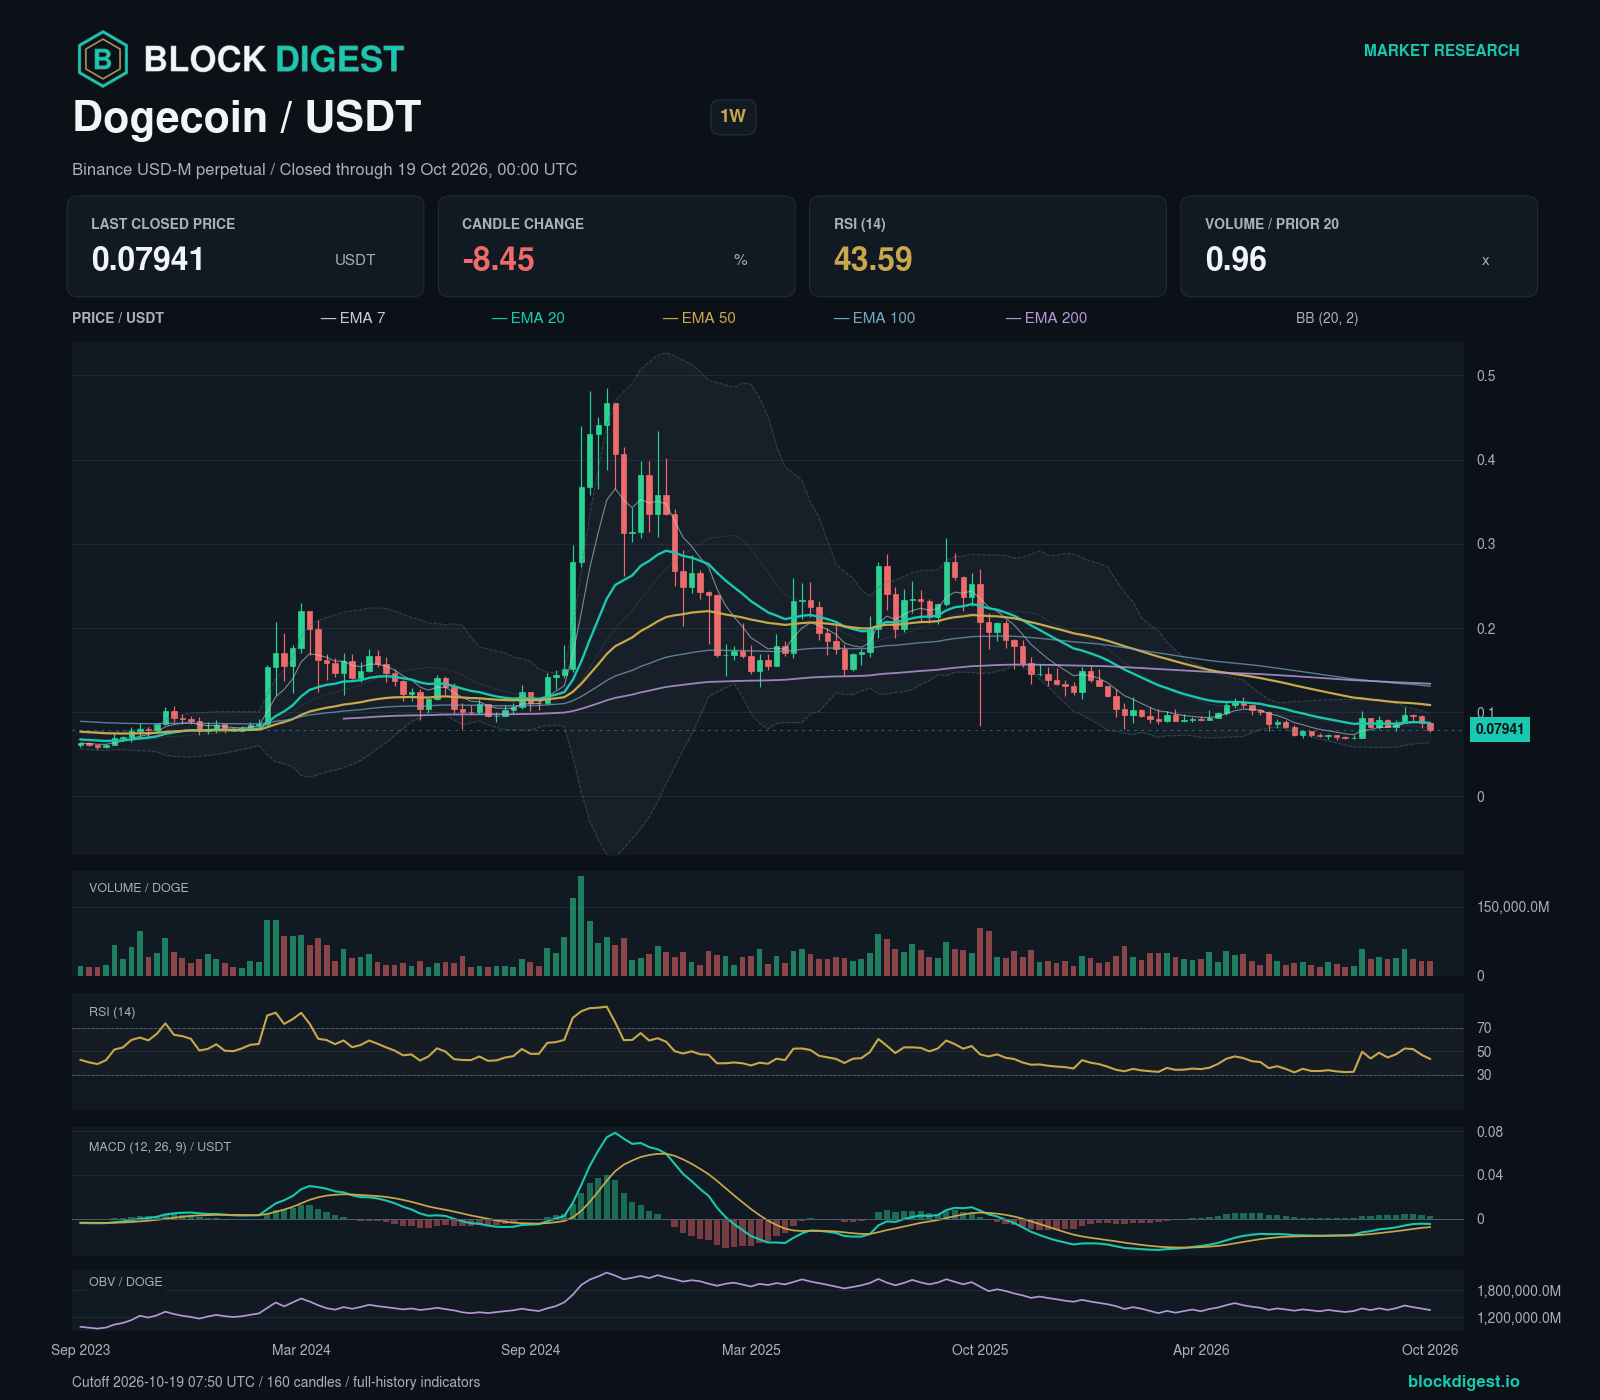
| DOGE | 0.07941 | -8.45% | -6.62% | 35.59 | bearish |
| LTC | 59.08 | -8.56% | -6.73% | 40.47 | bearish |
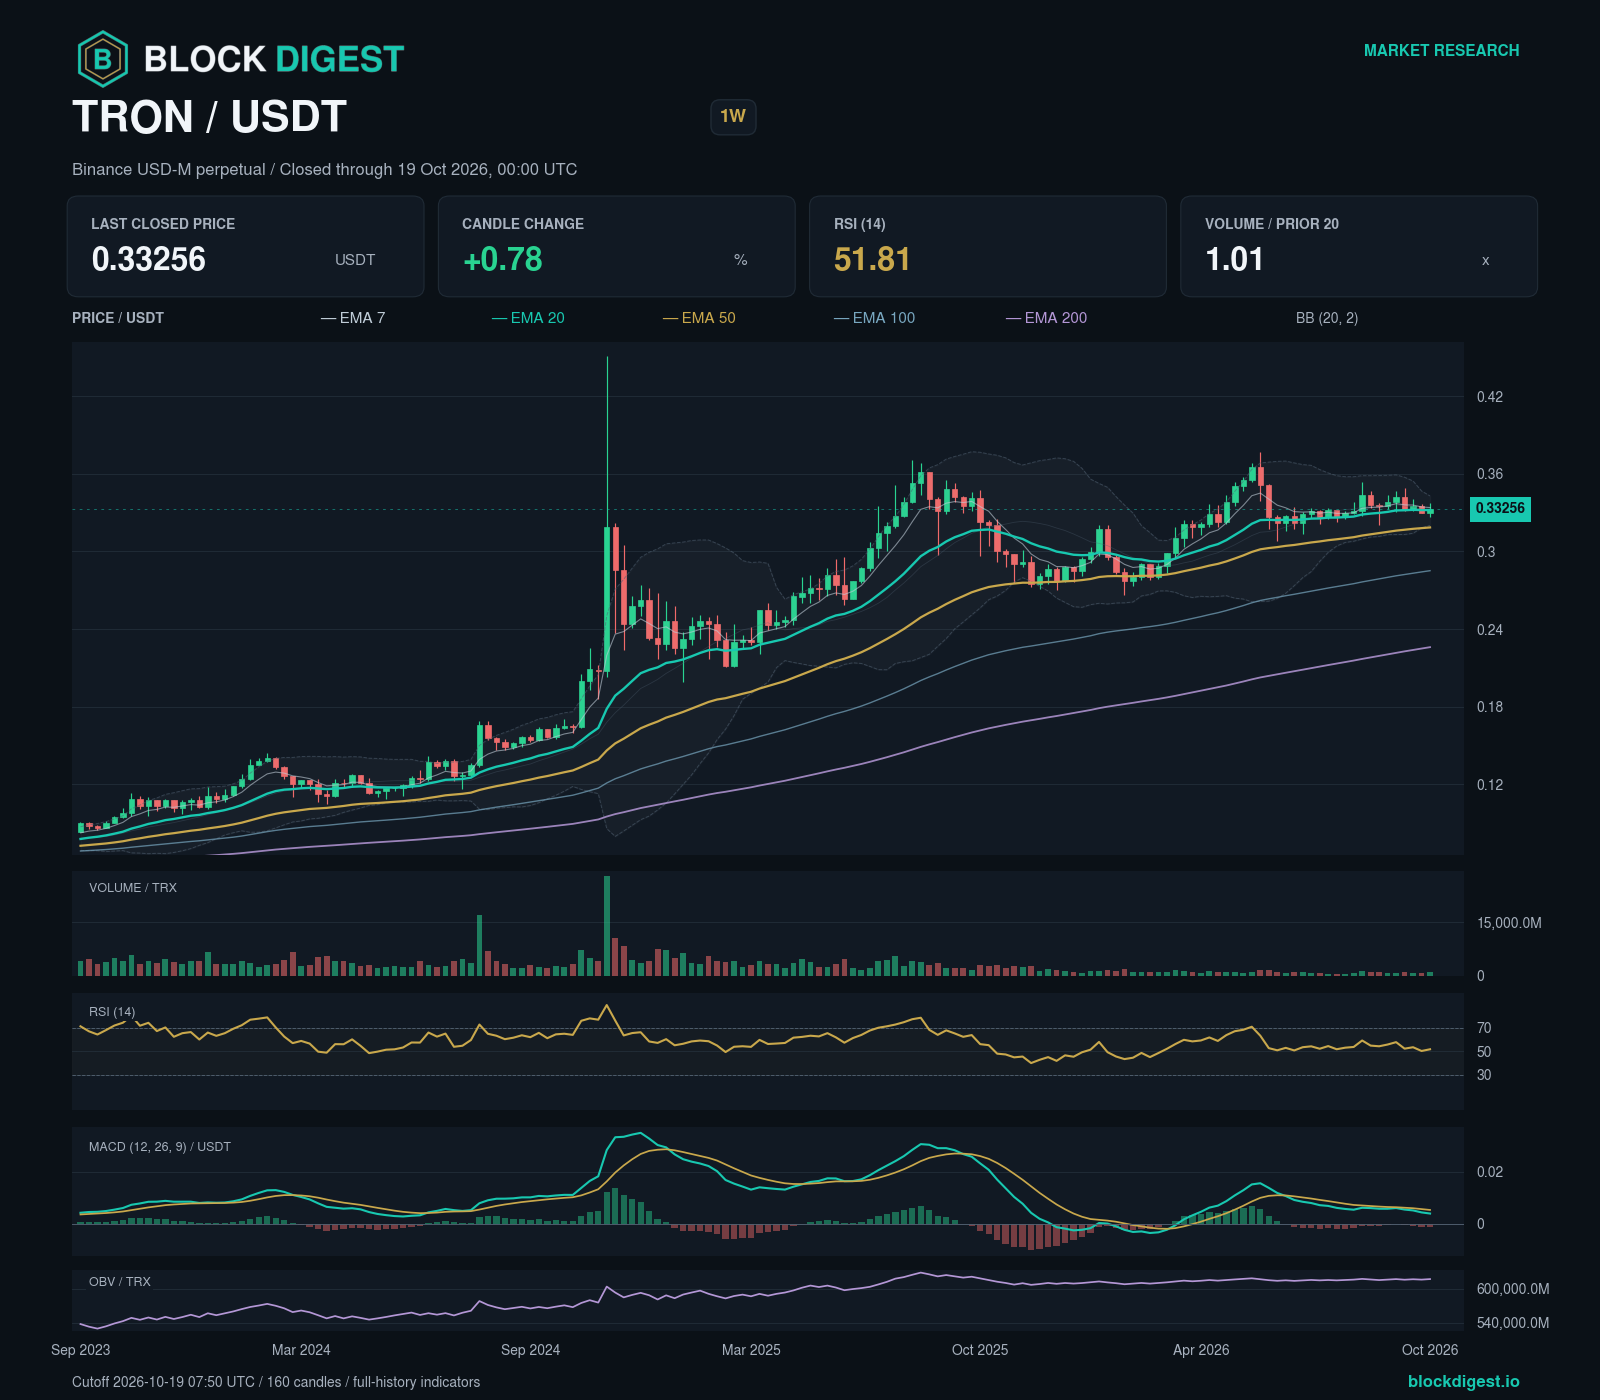
| TRX | 0.33256 | +0.78% | +2.80% | 47.31 | bearish |
The BTC comparison is the change in the ratio of synchronized USDT perpetual-futures closes. It is neither a spot Alt/BTC quote nor a measure of capital flows. No dominance-based rotation conclusion is made.
Solana (SOL)
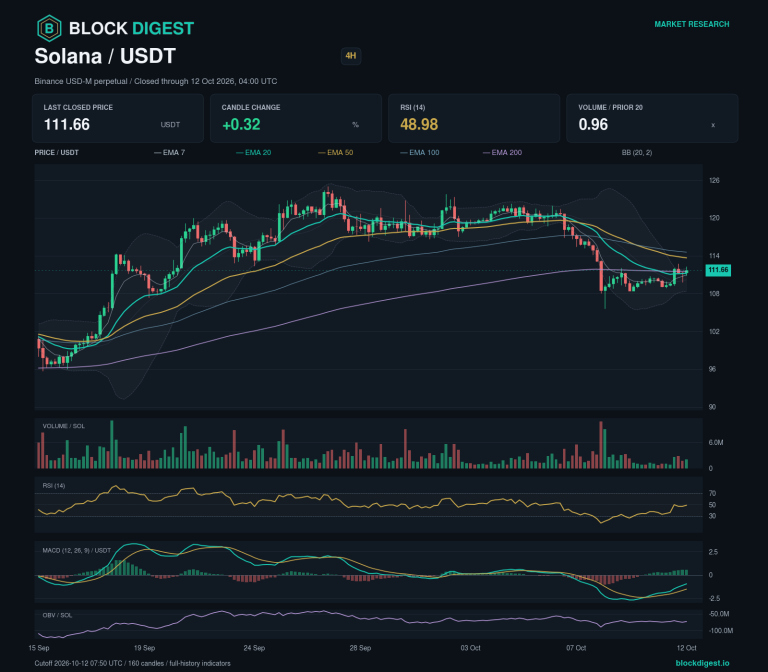
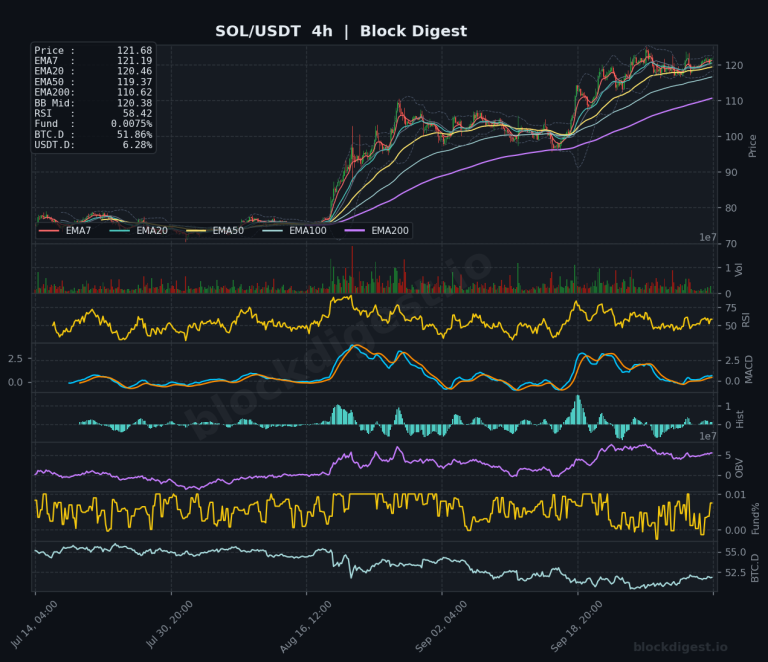
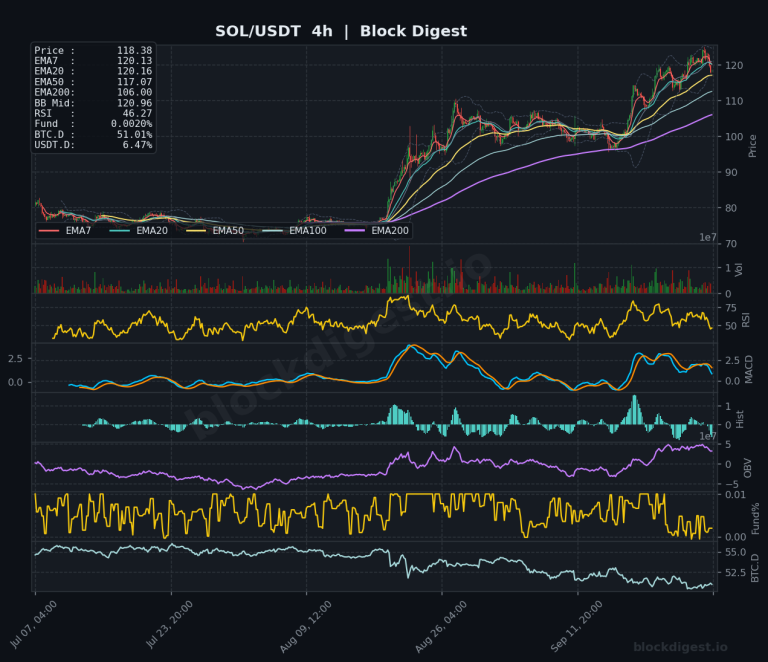
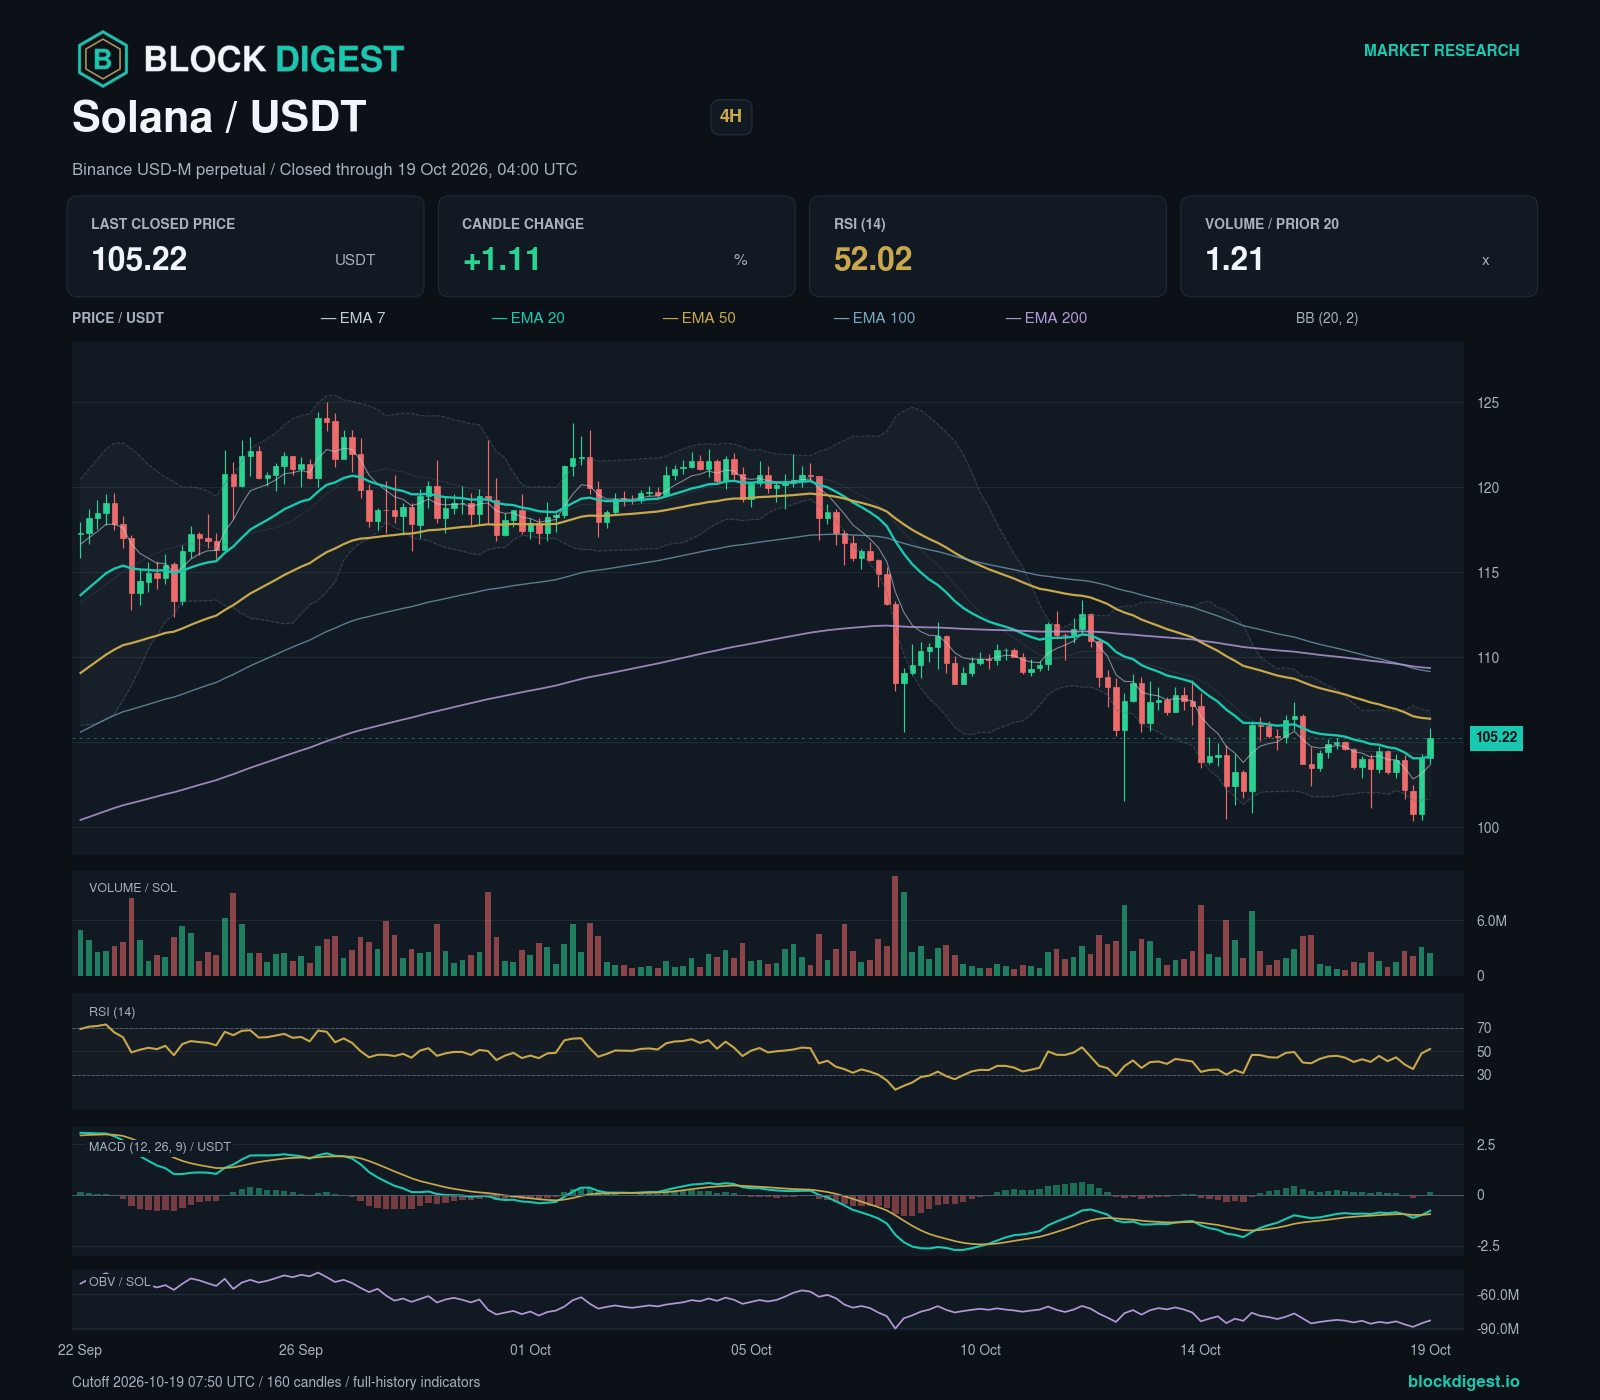
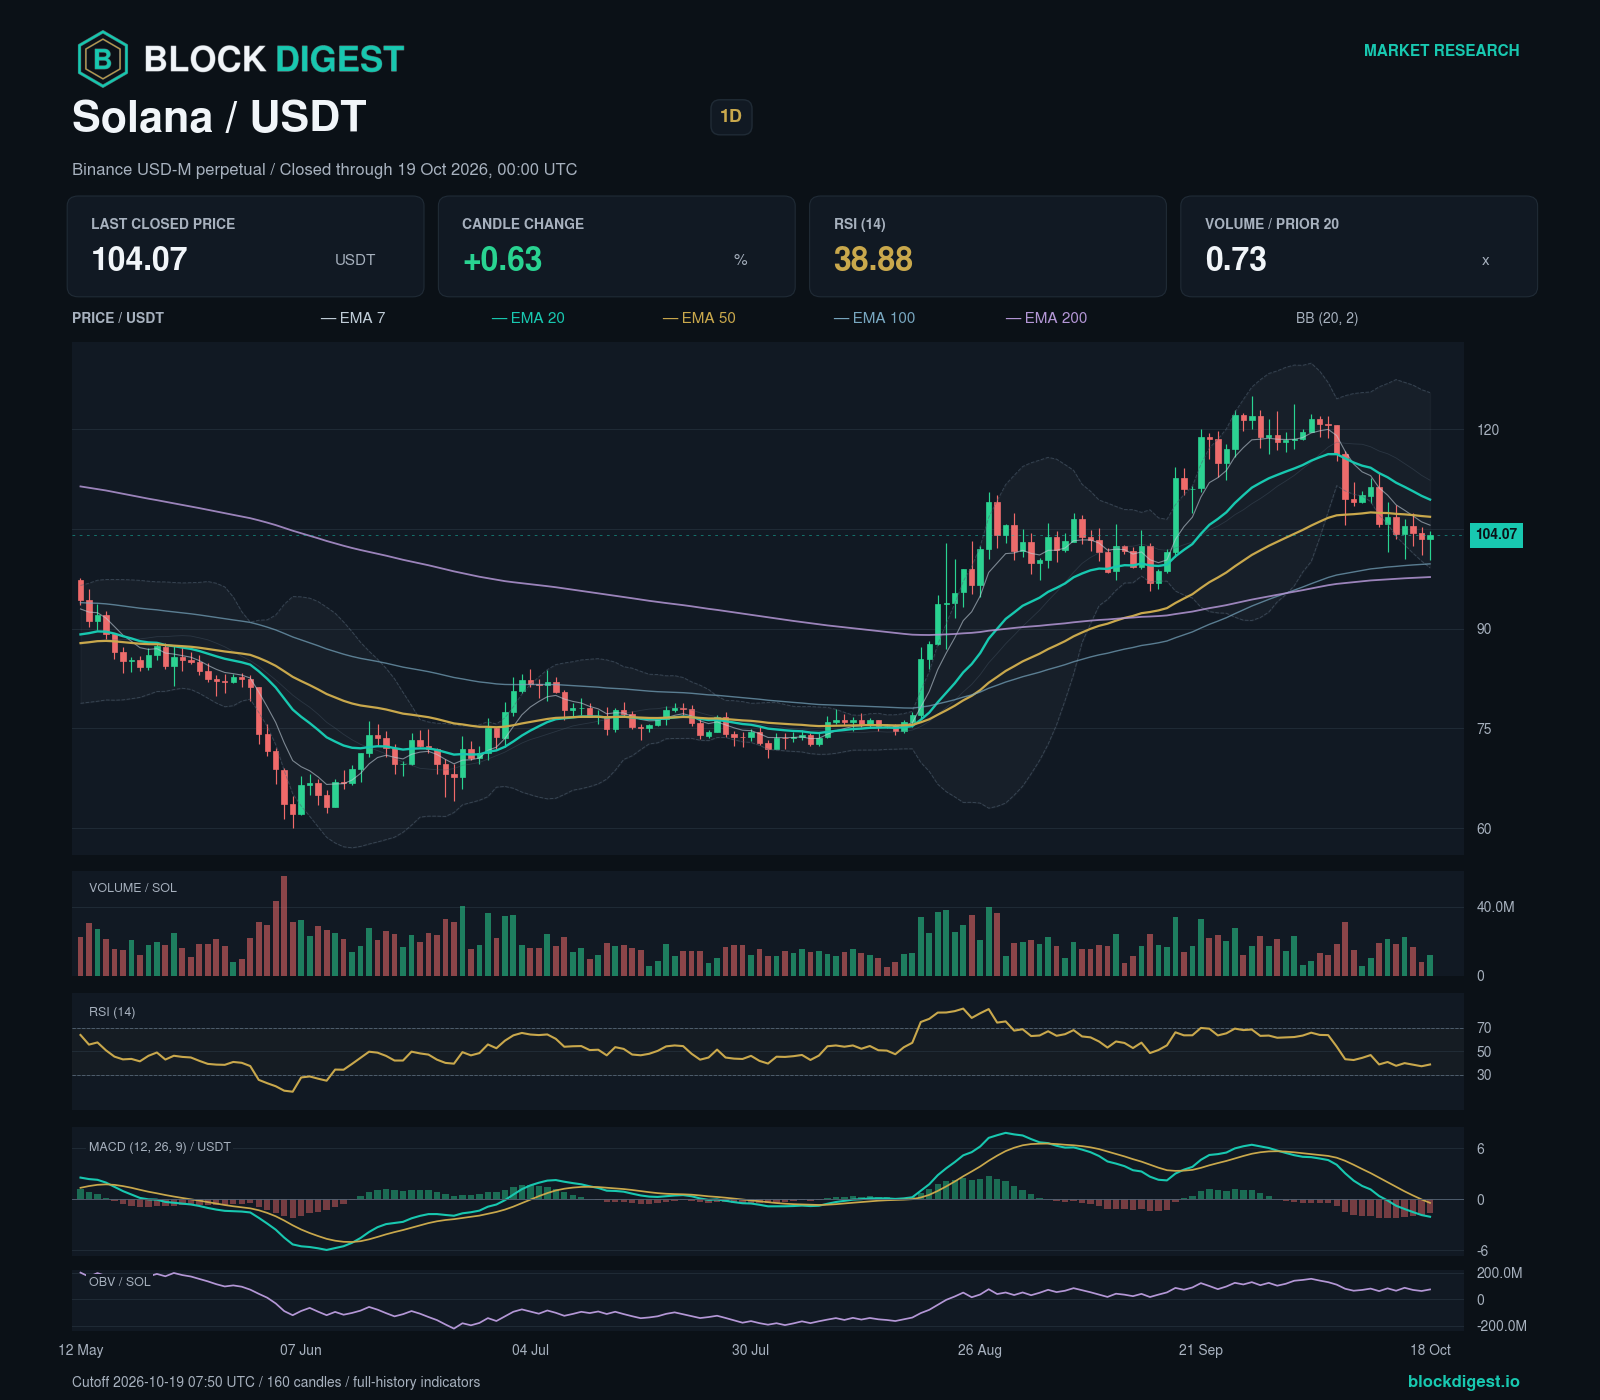
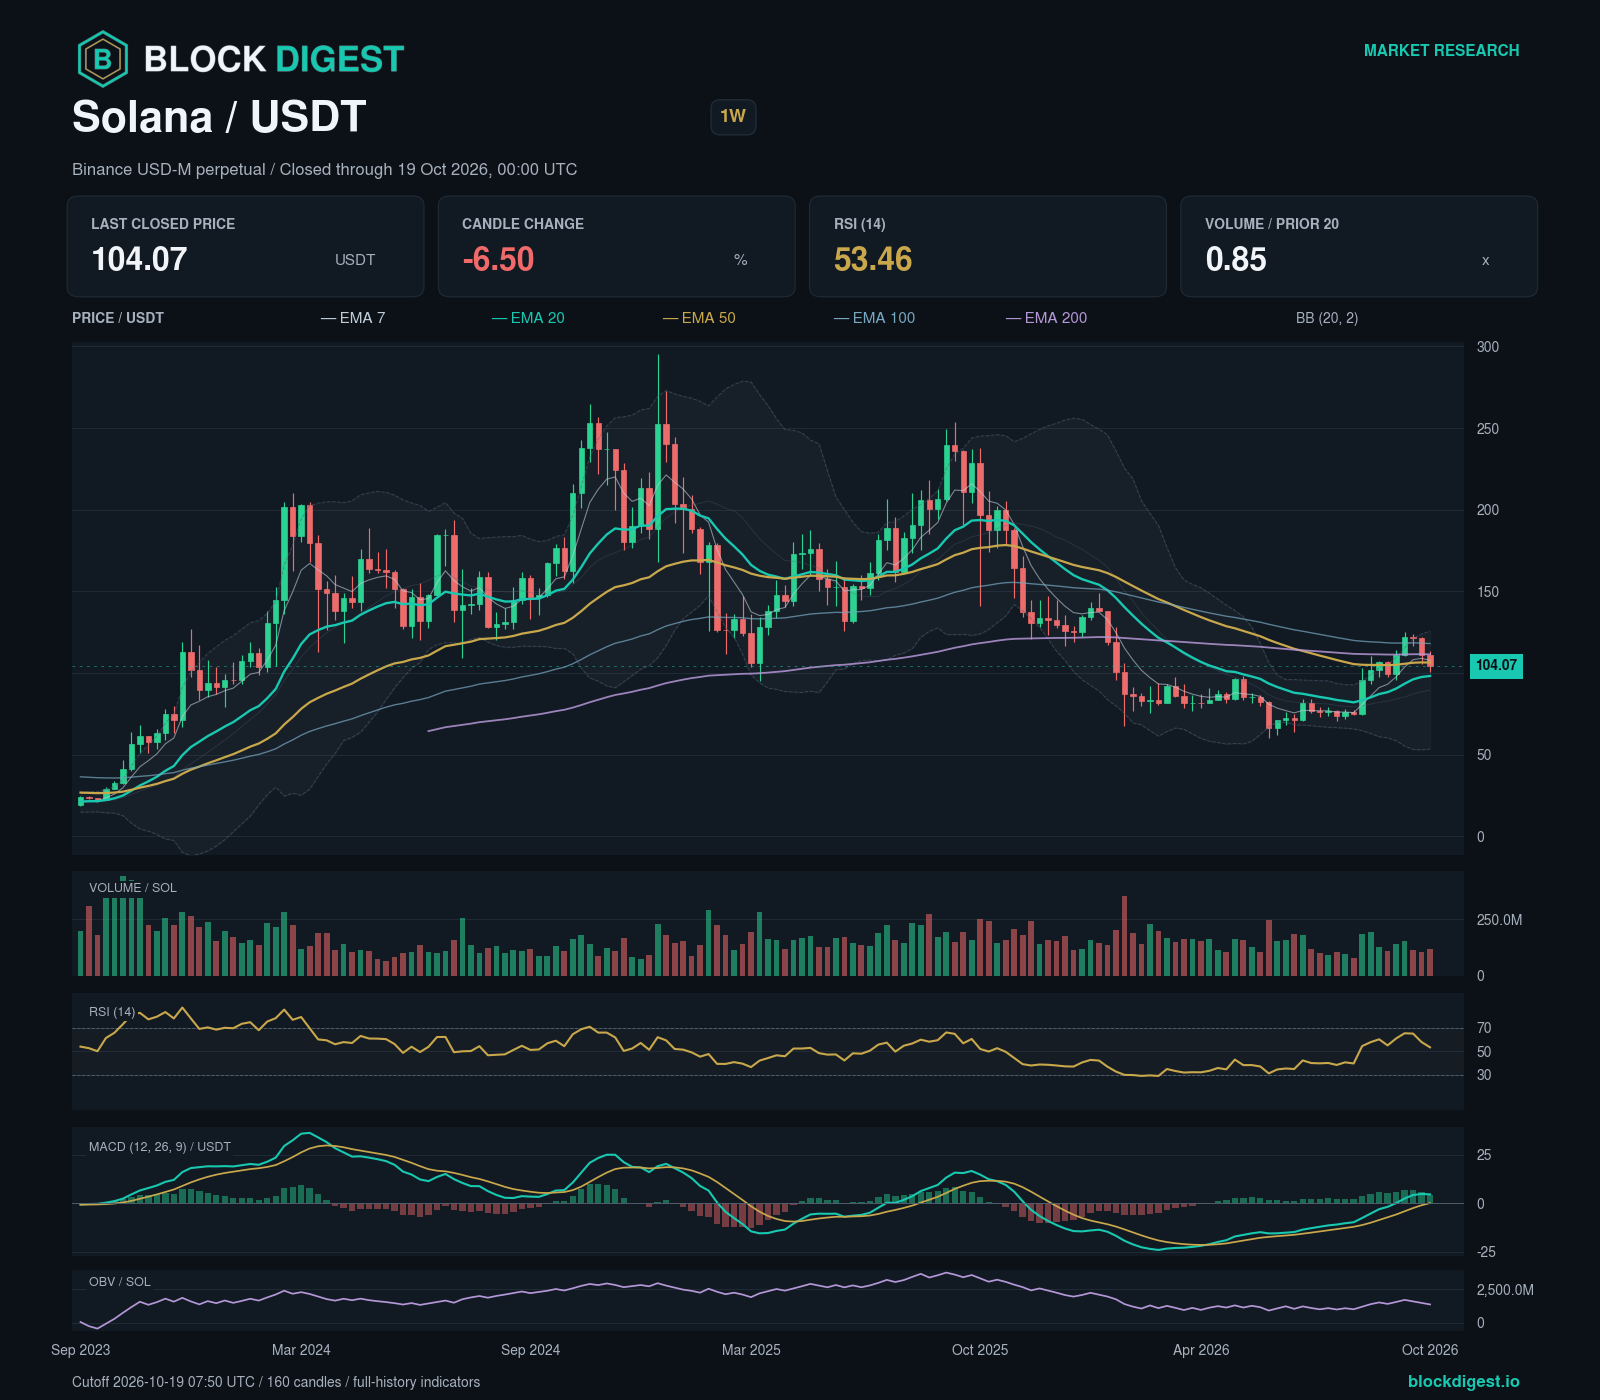
Solana’s daily chart shows lower confirmed swing highs and lower swing lows, giving a bearish structural assessment. The weekly chart shows higher confirmed swing highs and higher swing lows; the four-hour chart shows a close above the latest high of its previous lower-high, lower-low sequence, without a confirmed higher-high, higher-low sequence yet.
The latest completed four-hour candle closed at 105.22 USDT, for the period ending 2026-10-19 04:00 UTC.
Daily RSI is 38.88; the MACD histogram is -1.6315107 USDT. The negative histogram is narrowing toward zero, consistent with an easing of downward momentum. Daily volume was 0.73 times its preceding 20-day baseline. OBV fell over three daily bars. The volatility regime is normal.
Bullish scenario: A completed daily candle closing above 108.12267 USDT after the cutoff confirms the condition; a completed daily candle closing below 99.587327 USDT invalidates it. The next mapped zones are 109.83733 USDT–111.36267 USDT; 111.62733 USDT–113.15267 USDT.
Bearish scenario: A completed daily candle closing below 99.587327 USDT after the cutoff confirms the condition; a completed daily candle closing above 108.12267 USDT invalidates it. The next mapped zones are 97.597327 USDT–99.122673 USDT; 94.957327 USDT–96.482673 USDT.
Confidence in the directional assessment is low because the daily and weekly swing trends point in opposite directions and downward momentum is easing.
XRP (XRP)
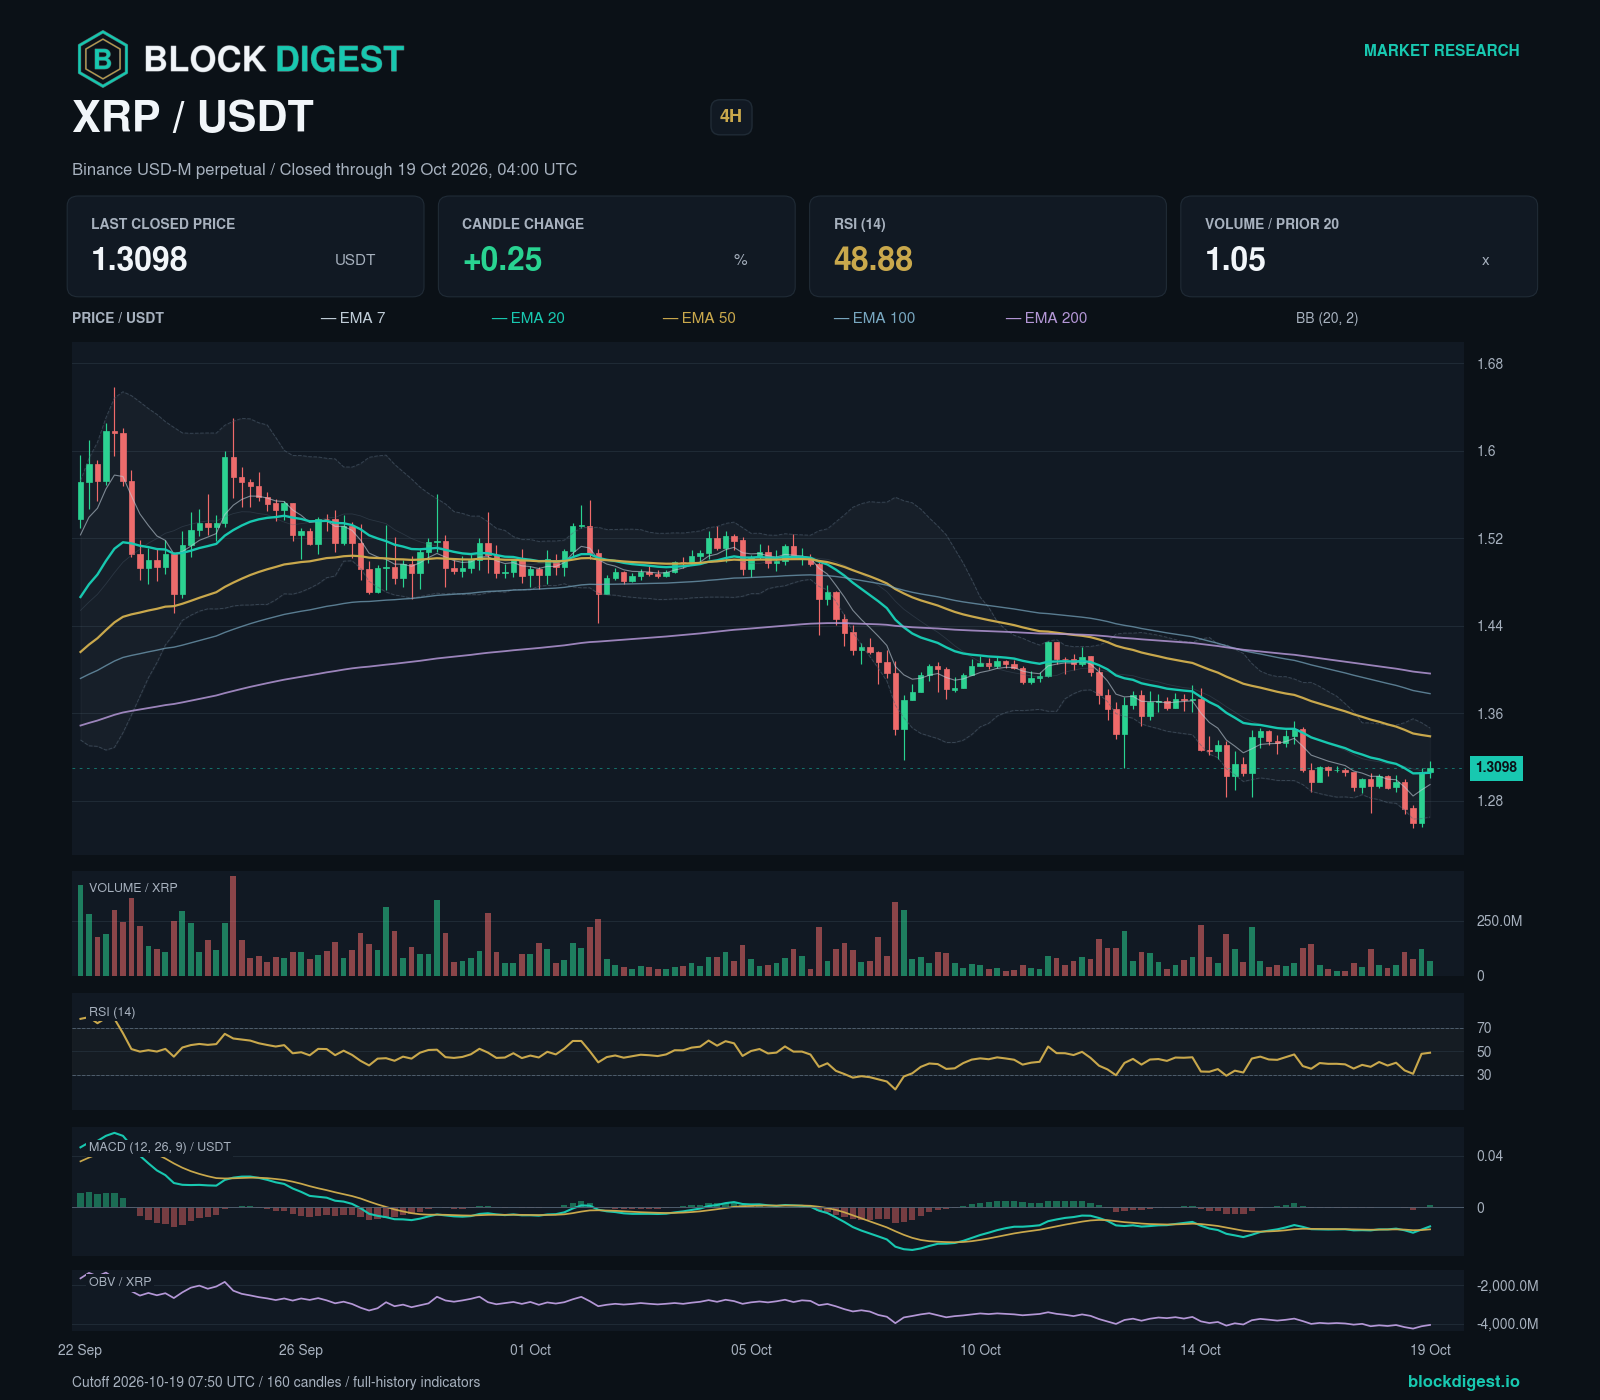
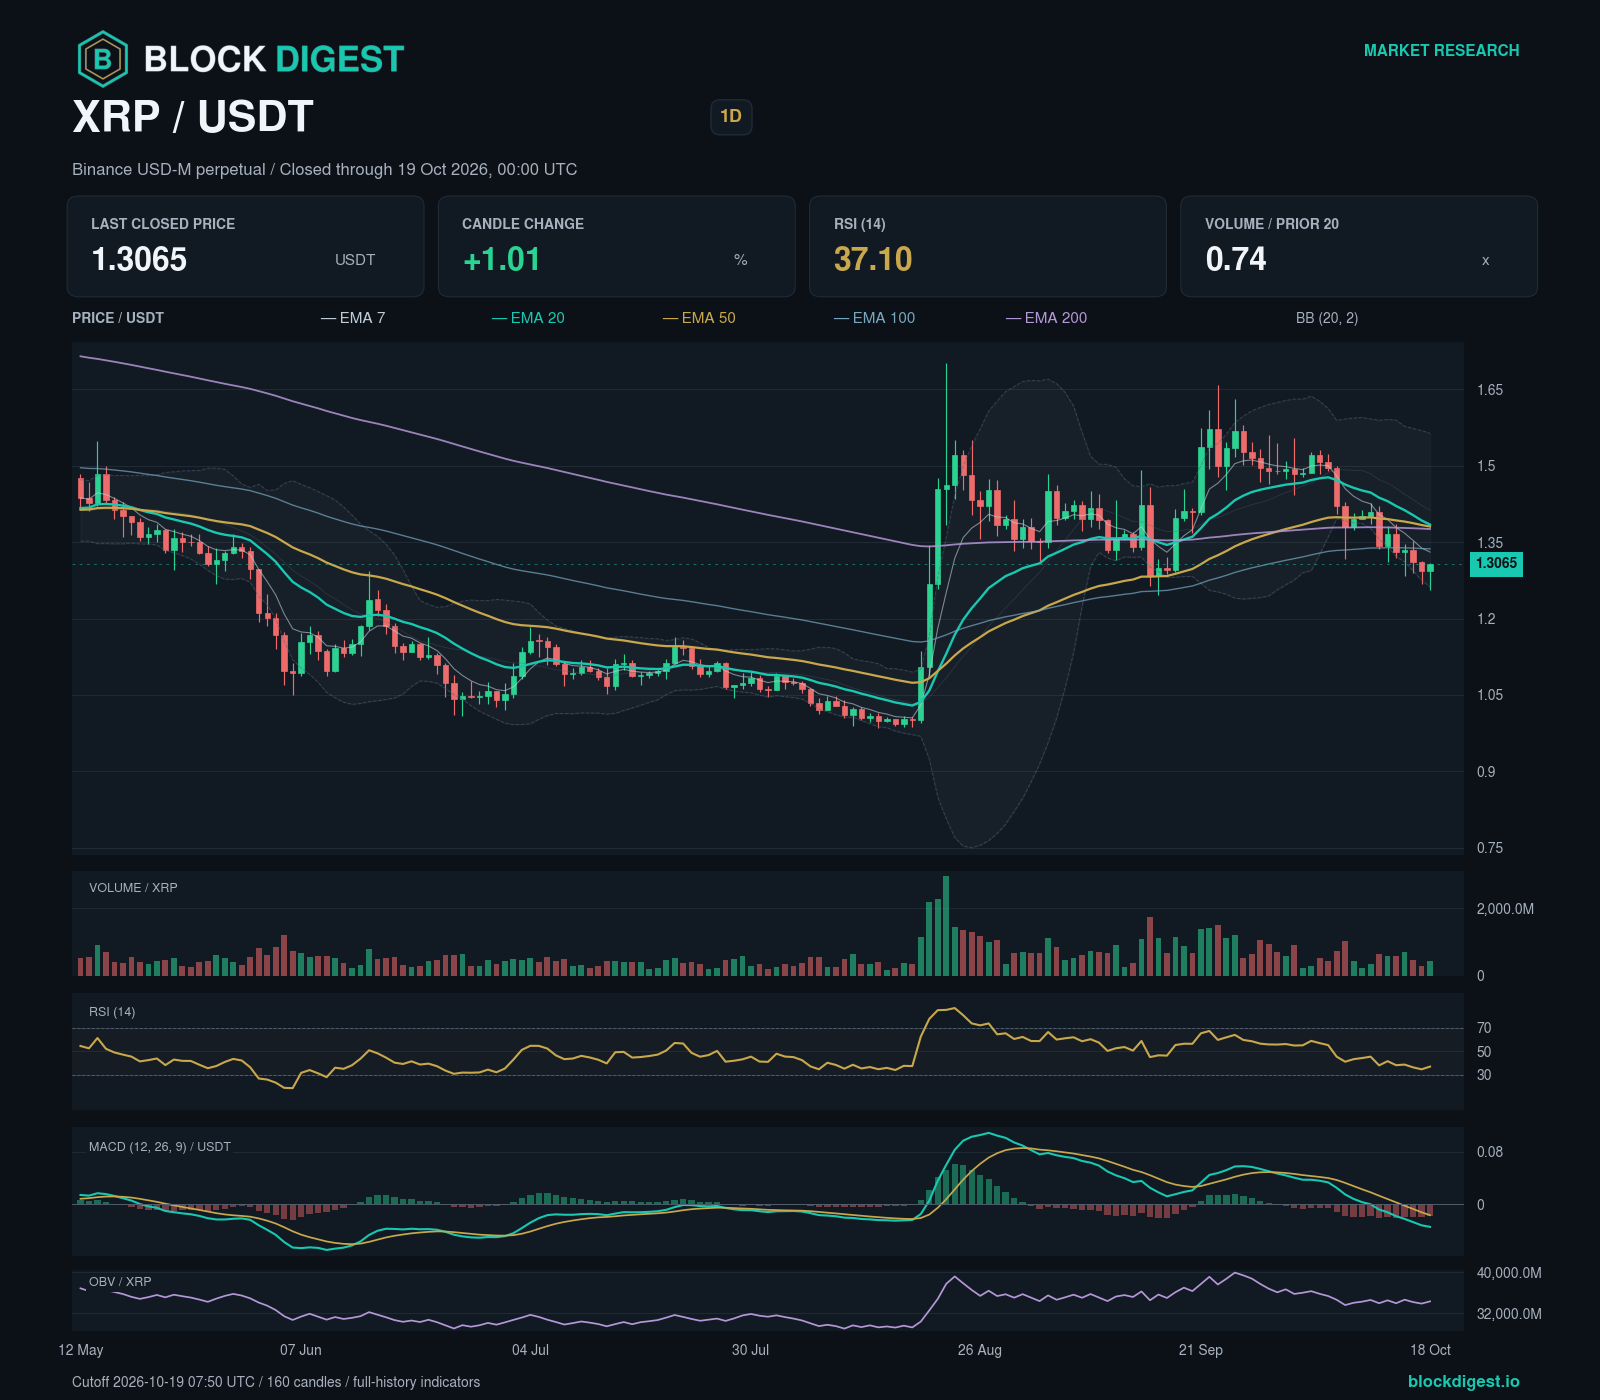
XRP’s daily chart shows lower confirmed swing highs and lower swing lows, giving a bearish structural assessment. The weekly chart shows a mixed sequence of confirmed swing highs and lows; the four-hour chart shows lower confirmed swing highs and lower swing lows.
The latest completed four-hour candle closed at 1.3098 USDT, for the period ending 2026-10-19 04:00 UTC.
Daily RSI is 37.10; the MACD histogram is -0.017821821 USDT. The negative histogram is narrowing toward zero, consistent with an easing of downward momentum. Daily volume was 0.74 times its preceding 20-day baseline. OBV fell over three daily bars. The volatility regime is normal.
Bullish scenario: A completed daily candle closing above 1.3822668 USDT after the cutoff confirms the condition; a completed daily candle closing below 1.2358332 USDT invalidates it. The next mapped zones are 1.4110332 USDT–1.4358668 USDT; 1.4543332 USDT–1.4740668 USDT.
Bearish scenario: A completed daily candle closing below 1.2358332 USDT after the cutoff confirms the condition; a completed daily candle closing above 1.3822668 USDT invalidates it. The next mapped zones are 1.1075332 USDT–1.1272668 USDT; 1.0391332 USDT–1.0588668 USDT.
Confidence in the directional assessment is low because the daily and weekly swing structures have yet to confirm the same trend and downward momentum is easing.
BNB (BNB)
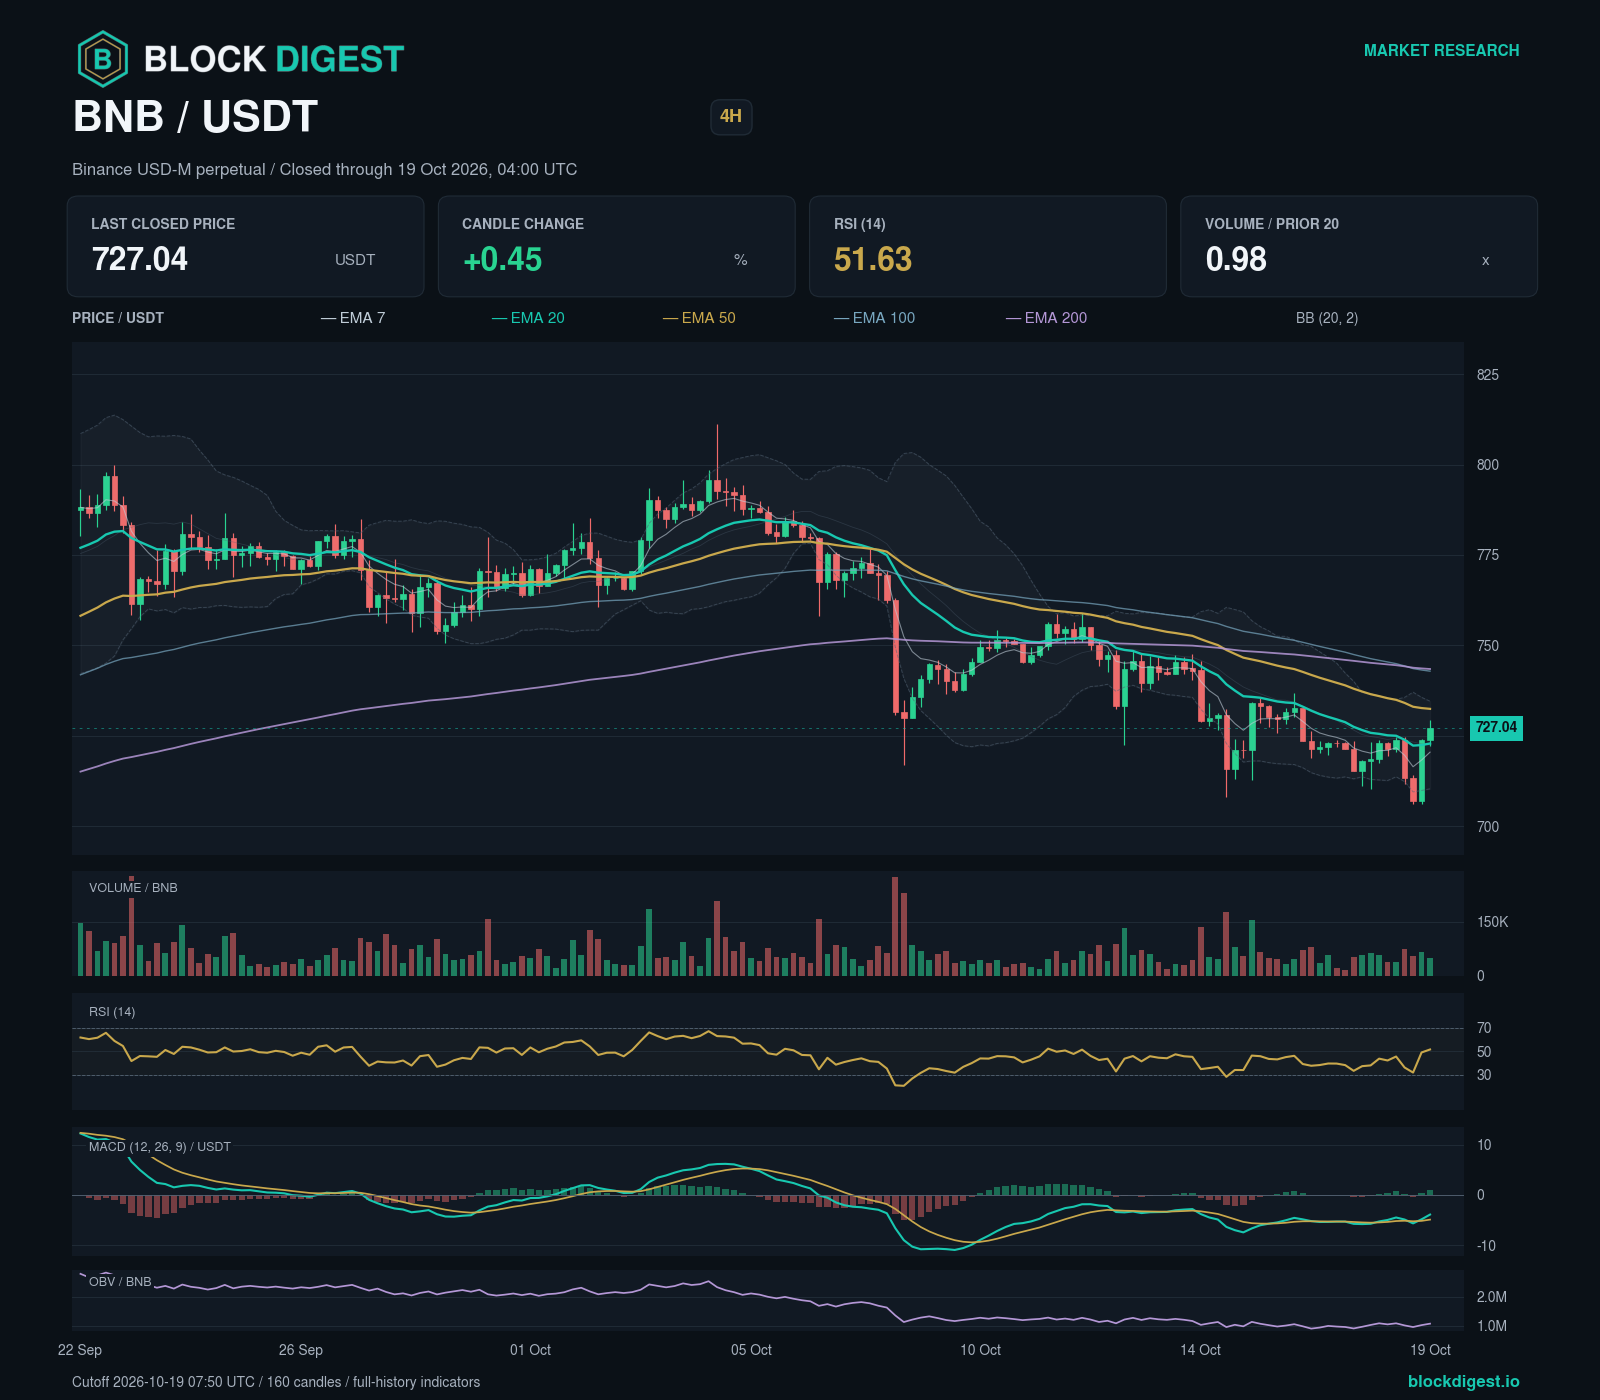
BNB’s daily chart shows lower confirmed swing highs and lower swing lows, giving a bearish structural assessment. The weekly chart shows a mixed sequence of confirmed swing highs and lows; the four-hour chart shows a close above the latest confirmed swing high within a still-unresolved swing sequence.
The latest completed four-hour candle closed at 727.04 USDT, for the period ending 2026-10-19 04:00 UTC.
Daily RSI is 41.33; the MACD histogram is -6.1422664 USDT. The negative histogram is narrowing toward zero, consistent with an easing of downward momentum. Daily volume was 0.81 times its preceding 20-day baseline. OBV fell over three daily bars. The volatility regime is normal.
Bullish scenario: A completed daily candle closing above 749.87552 USDT after the cutoff confirms the condition; a completed daily candle closing below 713.56448 USDT invalidates it. The trigger lies within the structural zone at 747.46448 USDT–754.03552 USDT. A qualifying close can still be inside this zone, leaving its upper boundary at 754.03552 USDT uncleared. The next mapped zones are 753.60448 USDT–762.12552 USDT; 778.15448 USDT–784.72552 USDT.
Bearish scenario: A completed daily candle closing below 713.56448 USDT after the cutoff confirms the condition; a completed daily candle closing above 749.87552 USDT invalidates it. The next mapped zones are 704.71448 USDT–711.28552 USDT; 694.71448 USDT–701.28552 USDT.
Confidence in the directional assessment is low because the daily and weekly swing structures have yet to confirm the same trend and downward momentum is easing.
Dogecoin (DOGE)
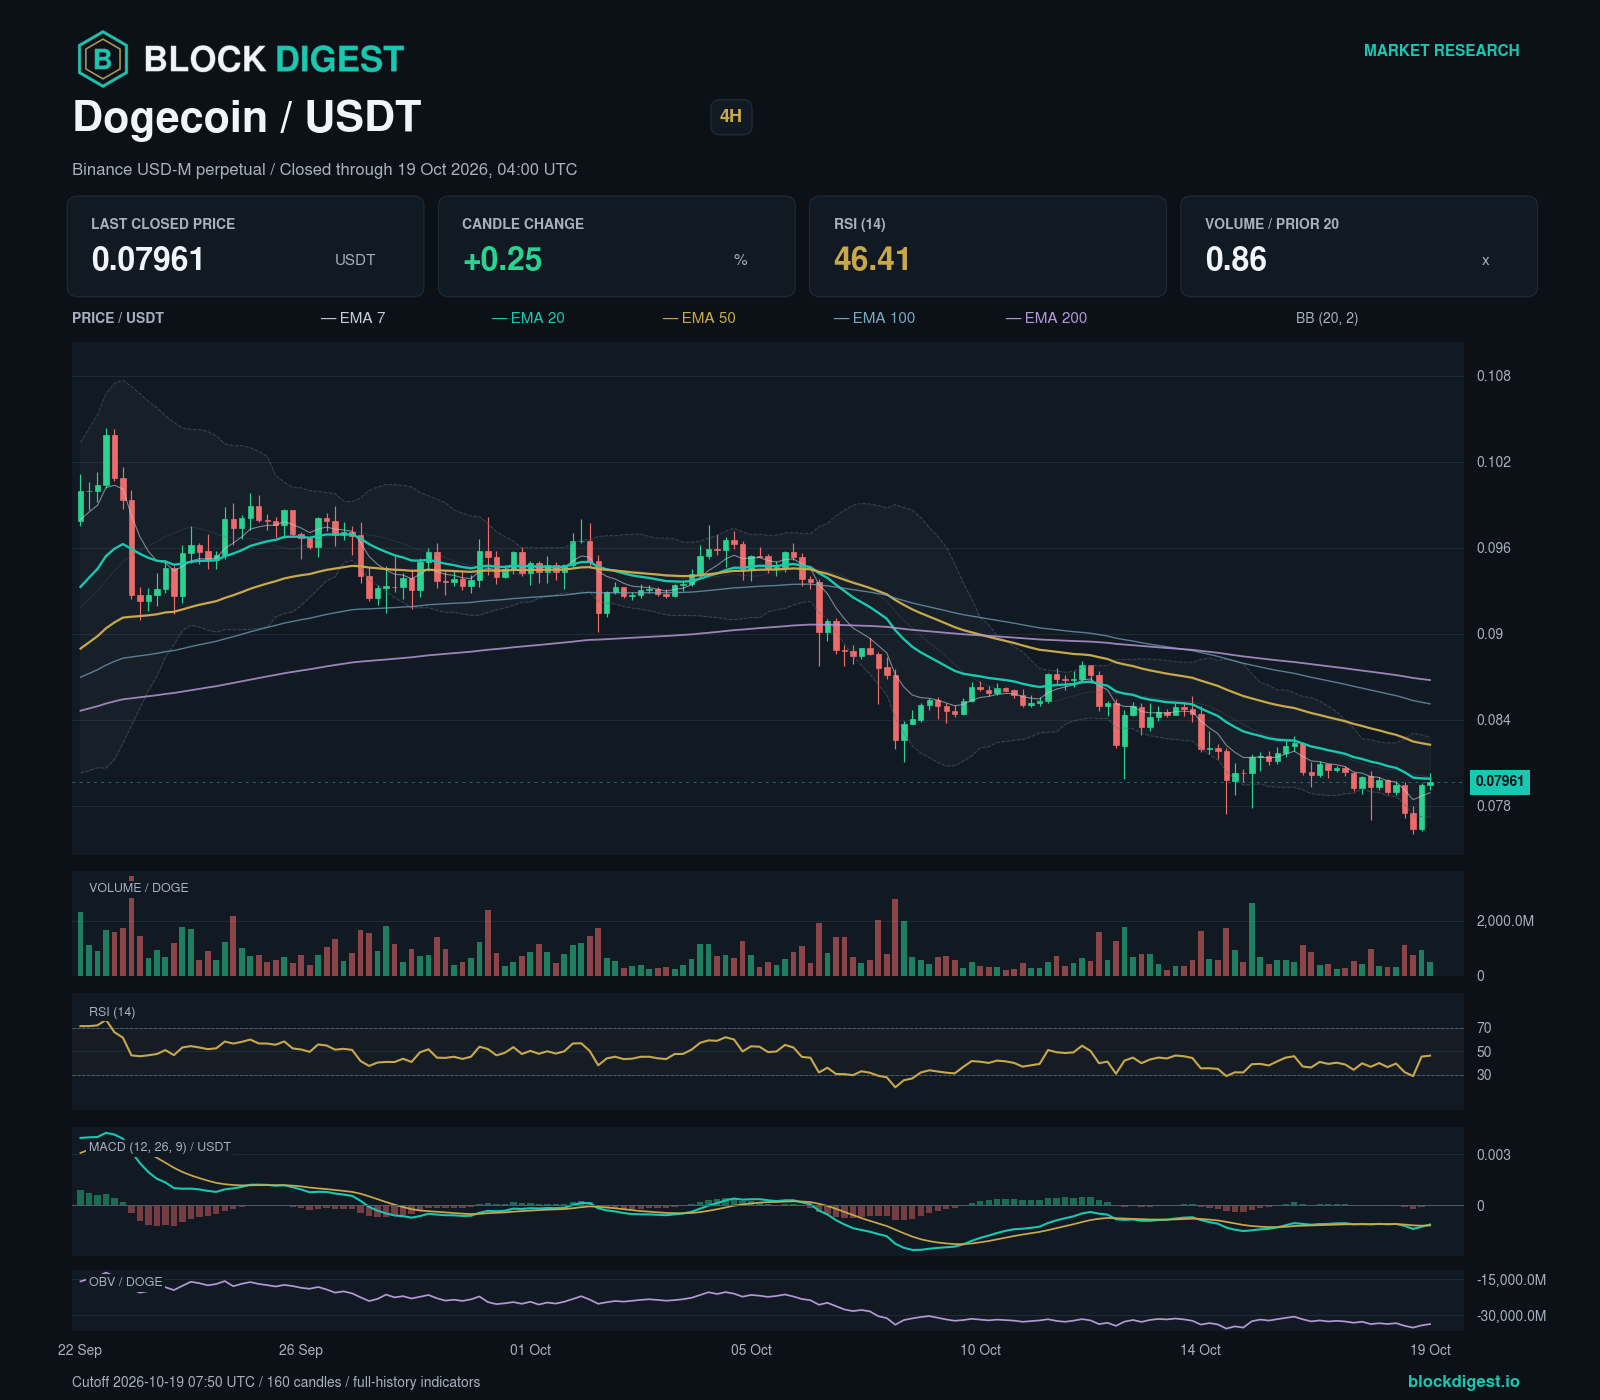
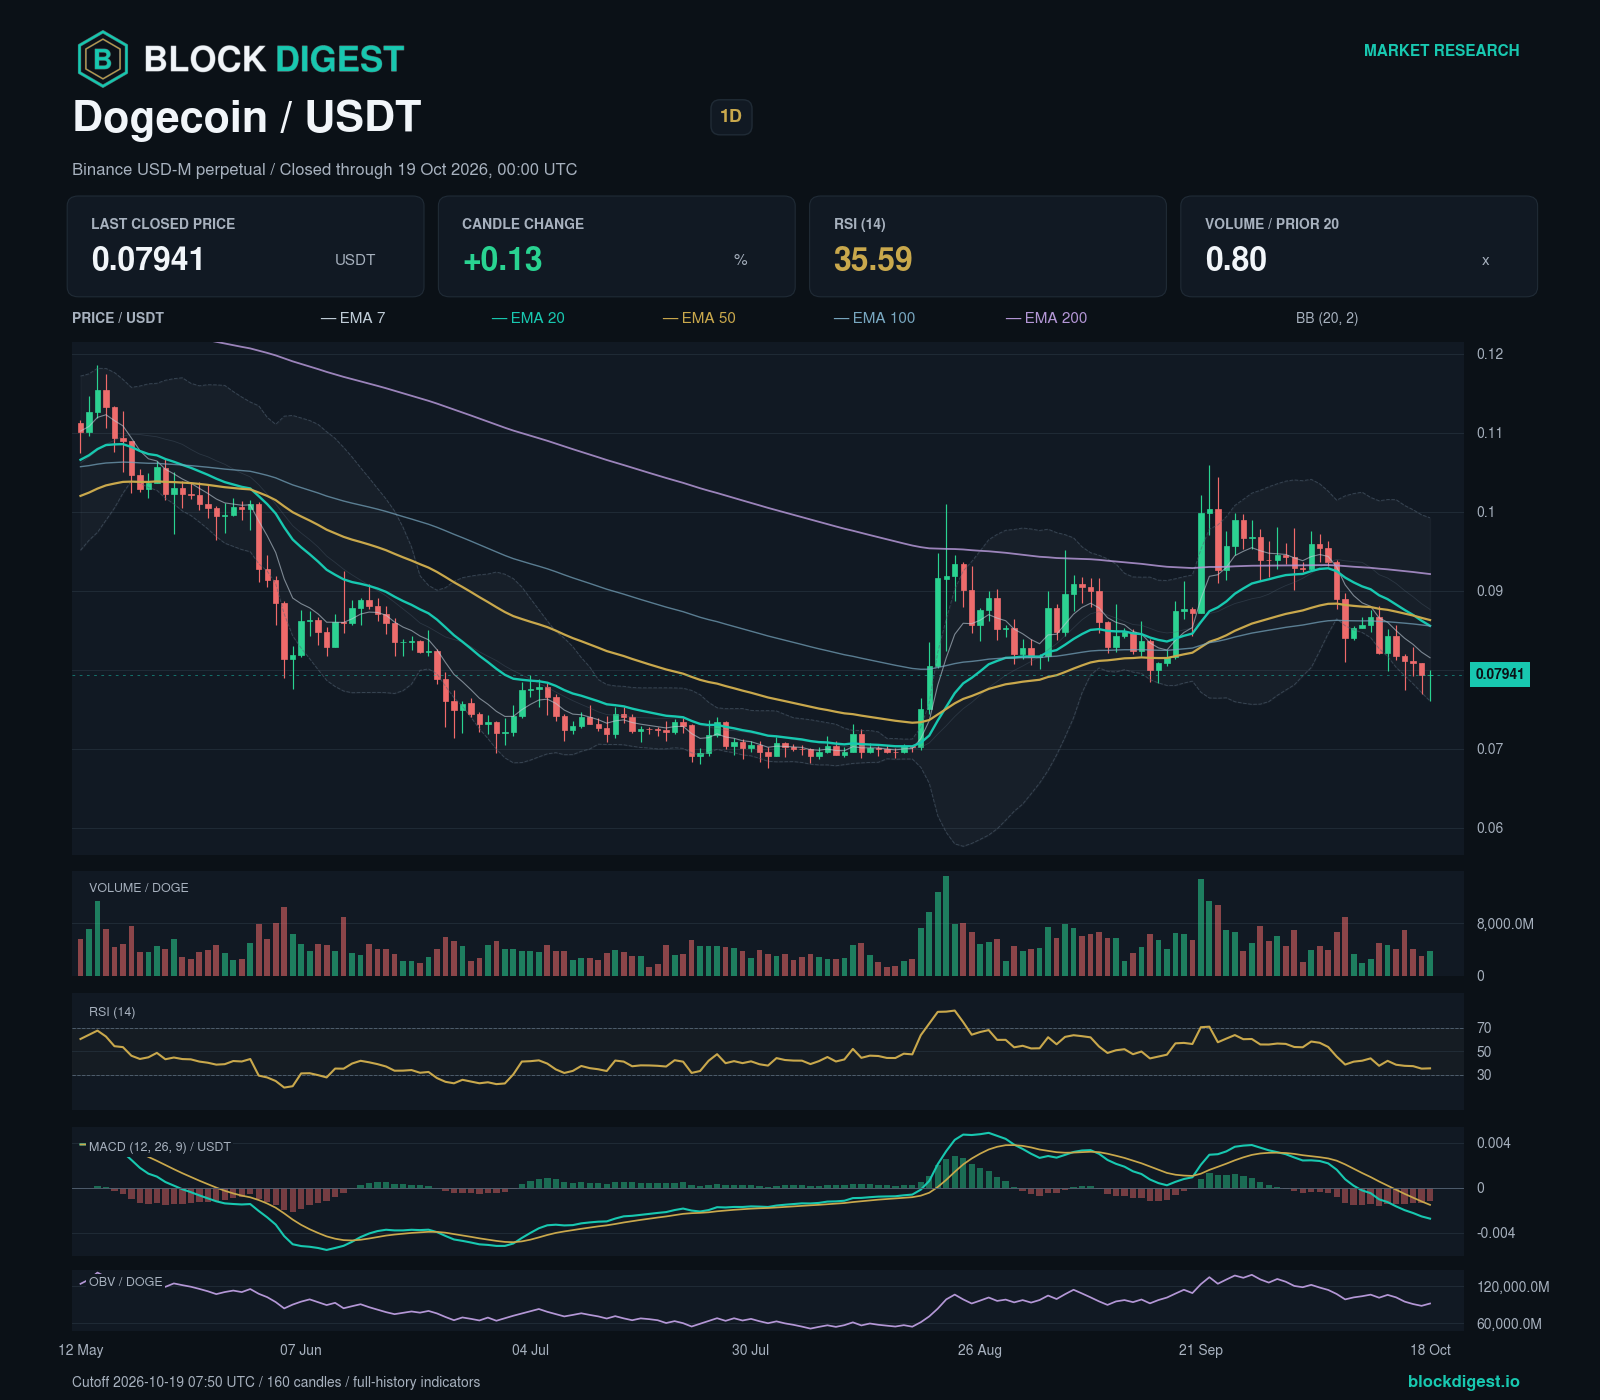
Dogecoin’s daily chart shows lower confirmed swing highs and lower swing lows, giving a bearish structural assessment. The weekly chart shows higher confirmed swing highs and higher swing lows; the four-hour chart shows lower confirmed swing highs and lower swing lows.
The latest completed four-hour candle closed at 0.07961 USDT, for the period ending 2026-10-19 04:00 UTC.
Daily RSI is 35.59; the MACD histogram is -0.0012287897 USDT. The negative histogram is narrowing toward zero, consistent with an easing of downward momentum. Daily volume was 0.80 times its preceding 20-day baseline. OBV fell over three daily bars. The volatility regime is normal.
Bullish scenario: A completed daily candle closing above 0.08 USDT after the cutoff confirms the condition; a completed daily candle closing below 0.07691909 USDT invalidates it. This is a break above the last completed daily high. The reference is an observed candle extreme, not a confirmed swing pivot. The trigger lies within the structural zone at 0.07921909 USDT–0.08078091 USDT. A qualifying close can still be inside this zone, leaving its upper boundary at 0.08078091 USDT uncleared. The next mapped zones are 0.08032909 USDT–0.08171091 USDT; 0.08299909 USDT–0.08438091 USDT.
Bearish scenario: A completed daily candle closing below 0.07691909 USDT after the cutoff confirms the condition; a completed daily candle closing above 0.08 USDT invalidates it. The next mapped zones are 0.07534909 USDT–0.07673091 USDT; 0.07246909 USDT–0.07385091 USDT.
Confidence in the directional assessment is low because the daily and weekly swing trends point in opposite directions and downward momentum is easing.
Litecoin (LTC)
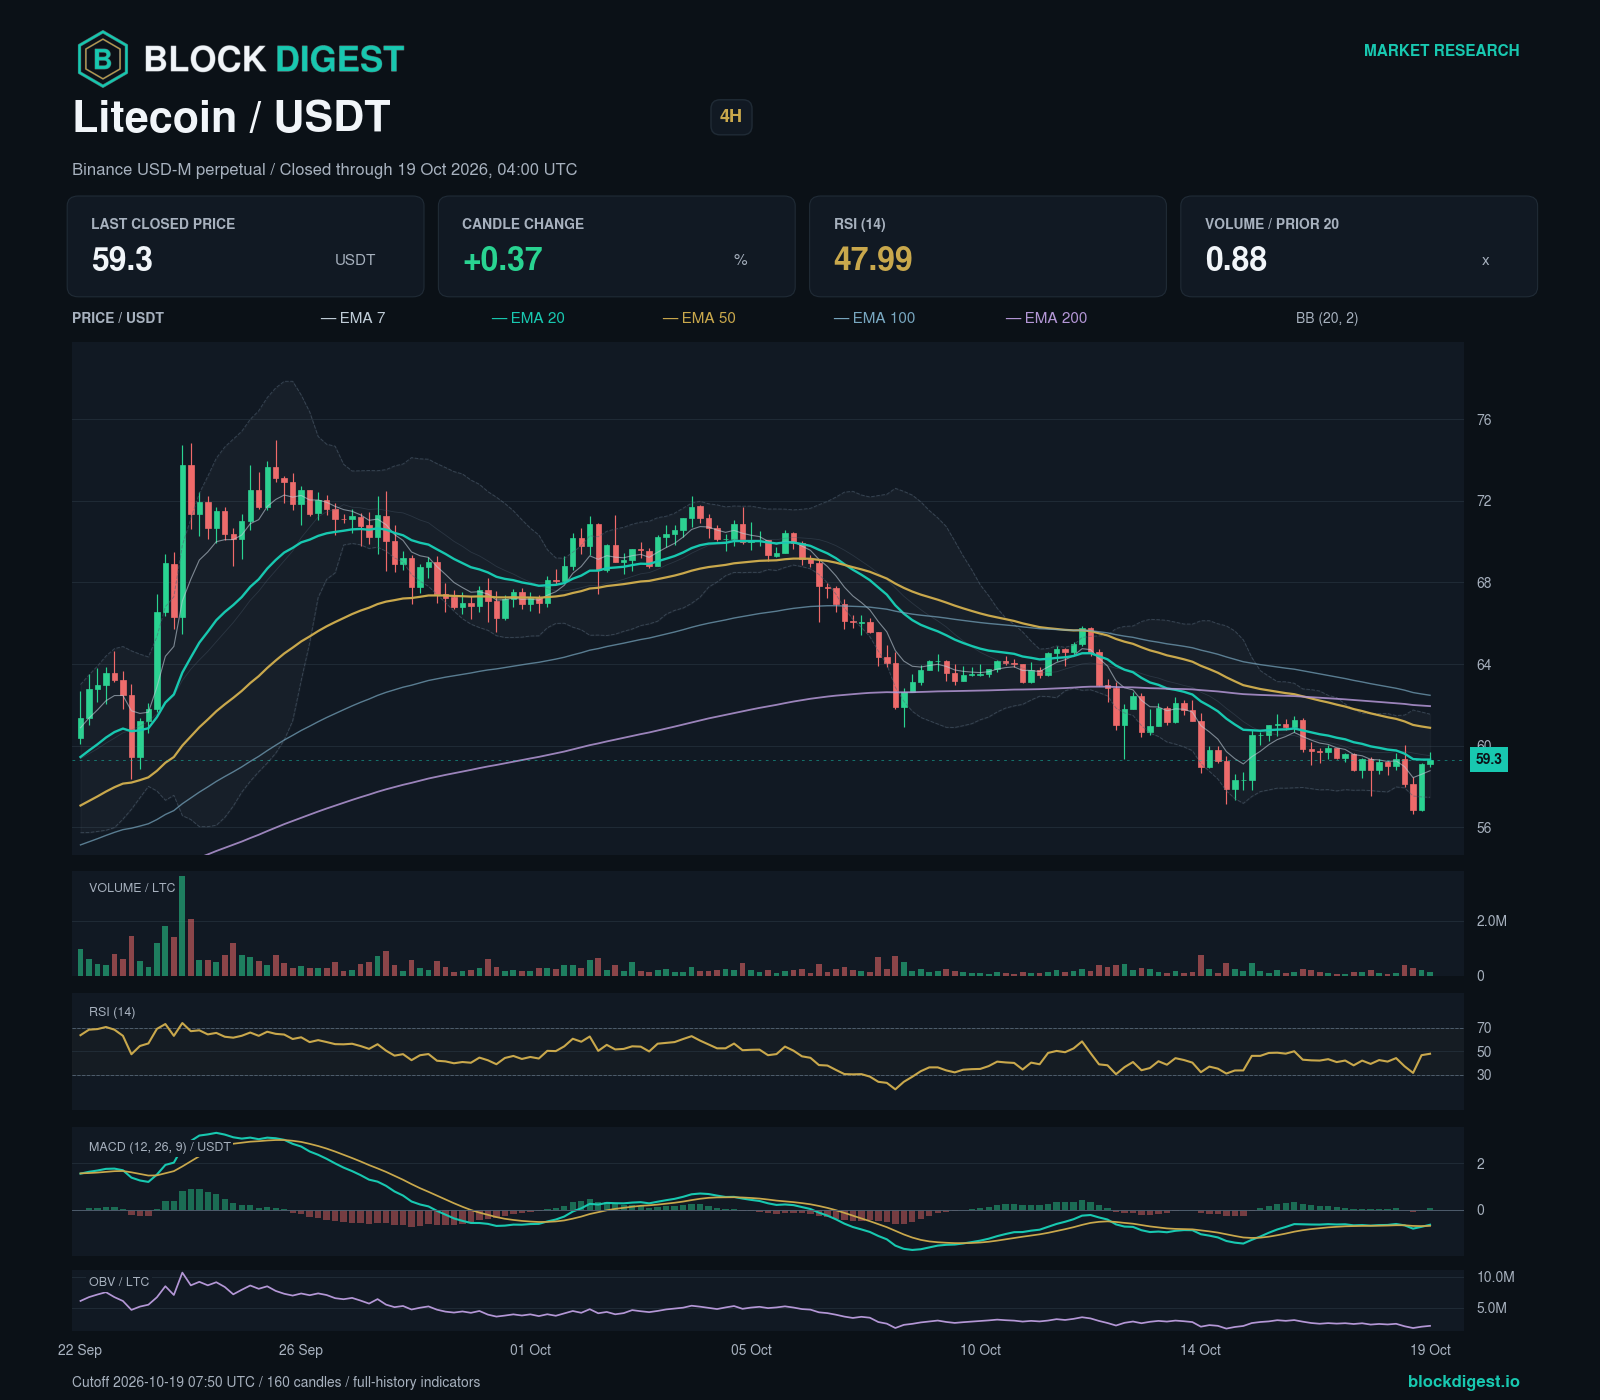
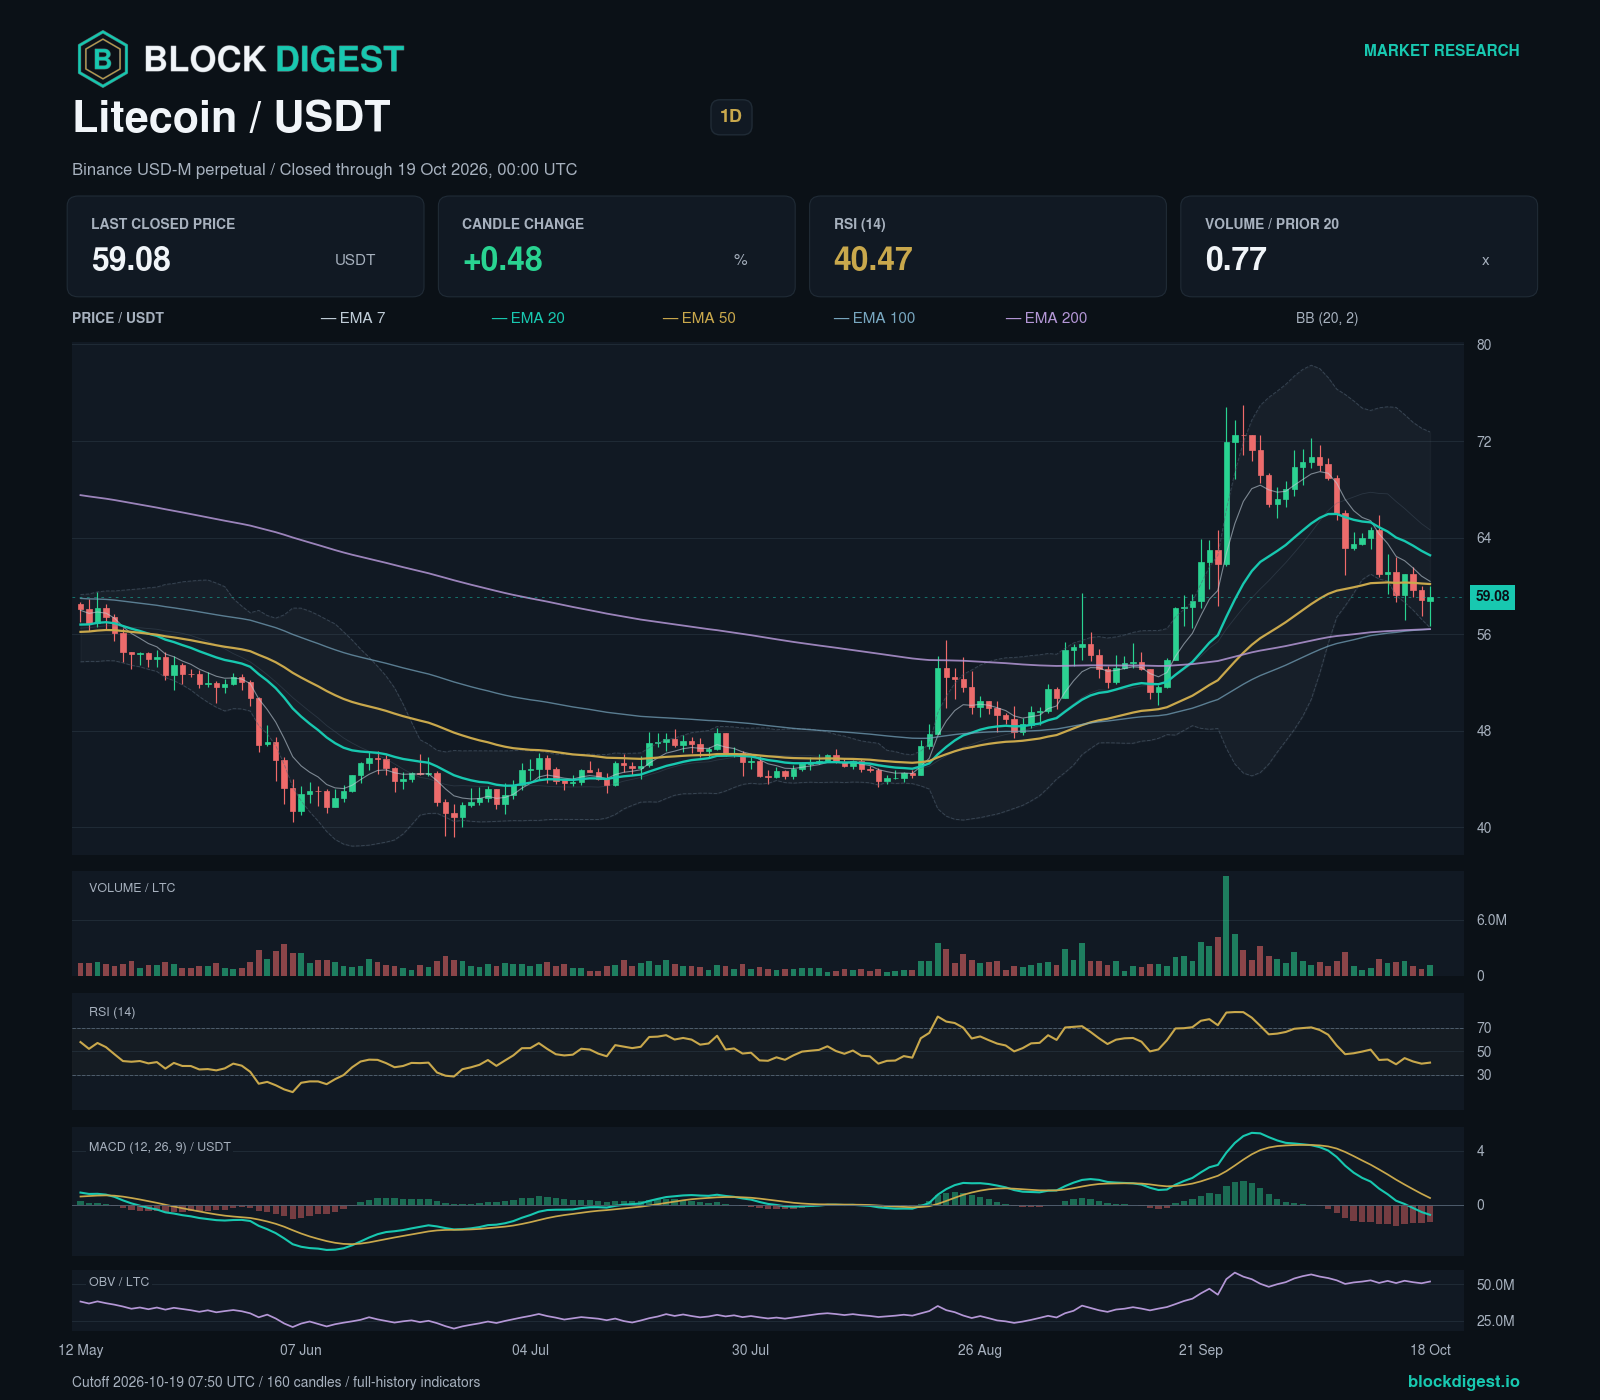
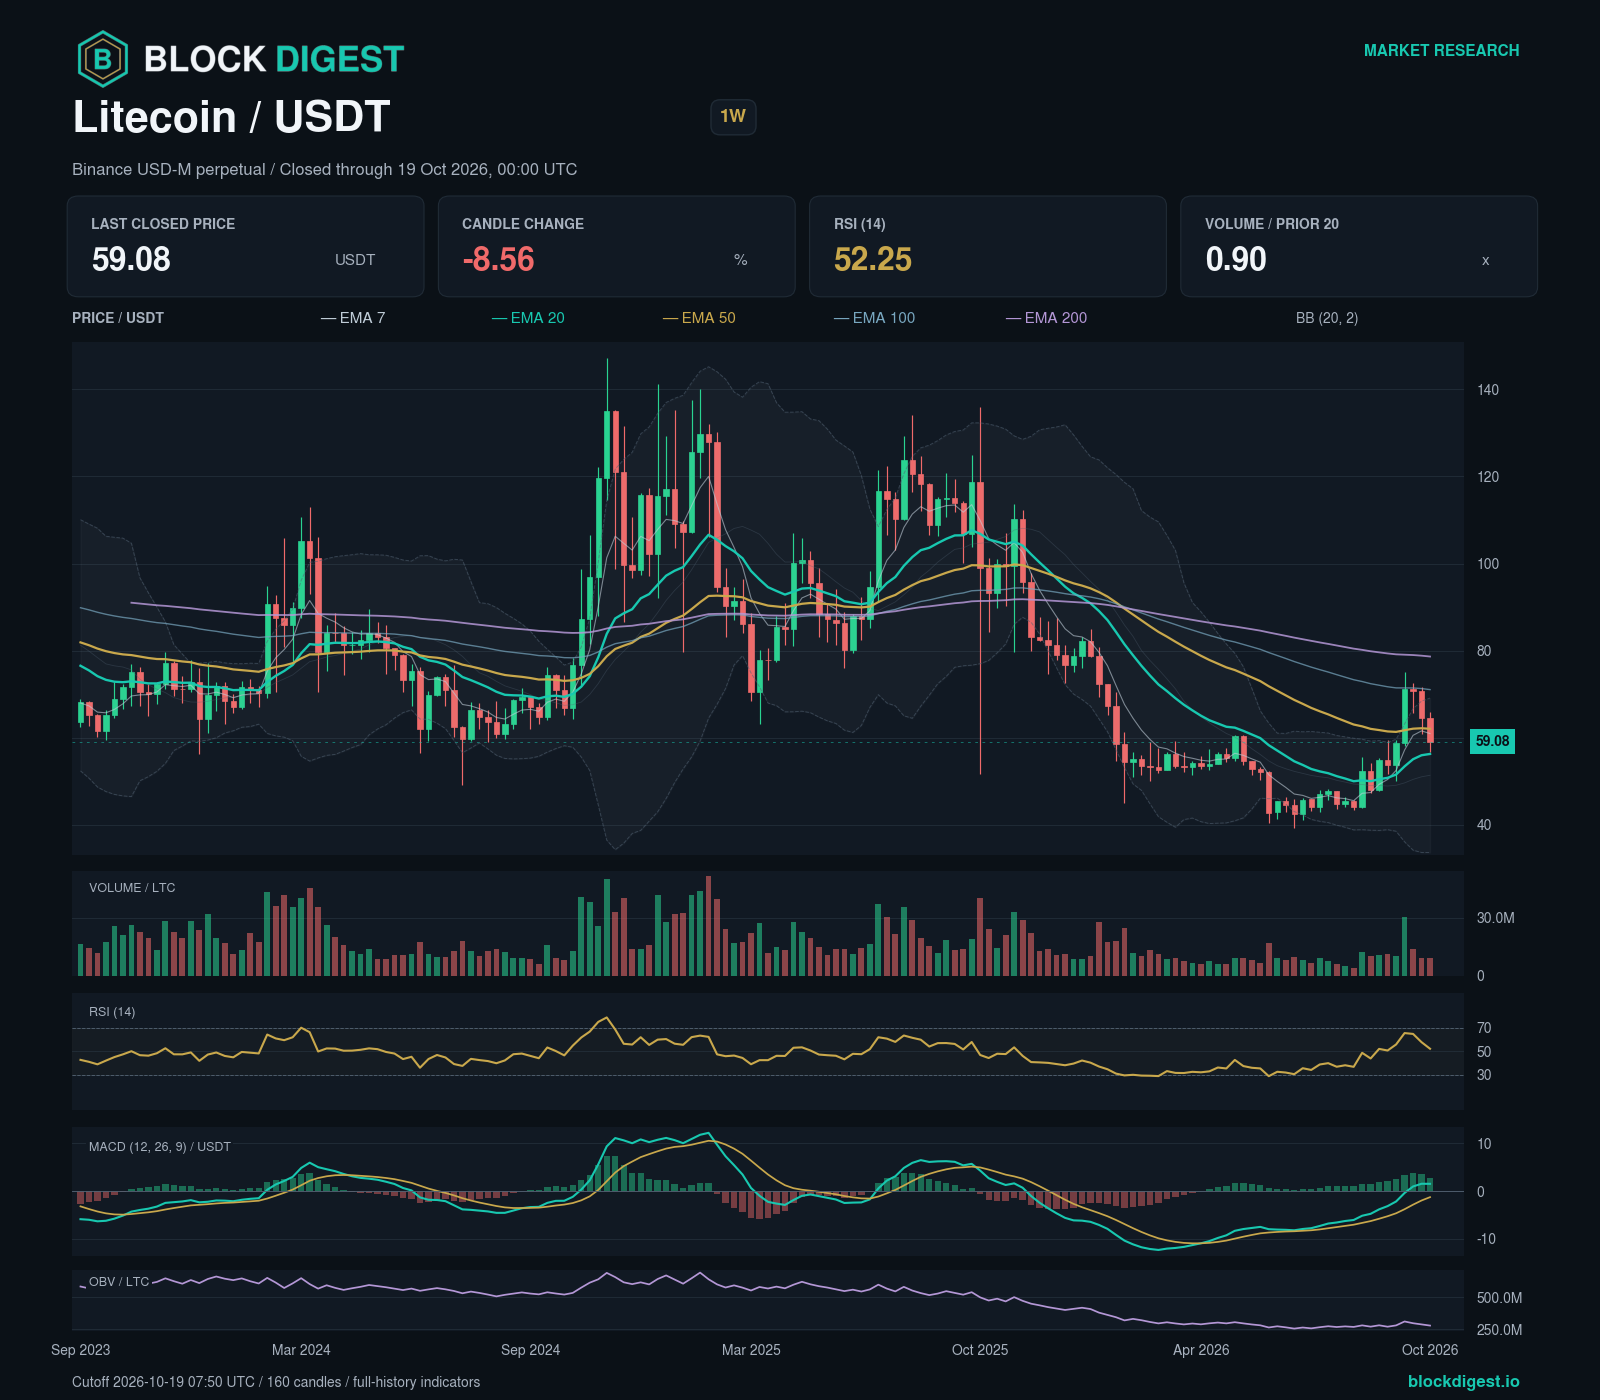
Litecoin’s daily chart shows lower confirmed swing highs and lower swing lows, giving a bearish structural assessment. The weekly chart shows higher confirmed swing highs and higher swing lows; the four-hour chart shows lower confirmed swing highs and lower swing lows.
The latest completed four-hour candle closed at 59.30 USDT, for the period ending 2026-10-19 04:00 UTC.
Daily RSI is 40.47; the MACD histogram is -1.2432558 USDT. The negative histogram is narrowing toward zero, consistent with an easing of downward momentum. Daily volume was 0.77 times its preceding 20-day baseline. OBV fell over three daily bars. The volatility regime is normal.
Bullish scenario: A completed daily candle closing above 60.01 USDT after the cutoff confirms the condition; a completed daily candle closing below 56.675002 USDT invalidates it. This is a break above the last completed daily high. The reference is an observed candle extreme, not a confirmed swing pivot. The next mapped zones are 60.085002 USDT–61.394998 USDT; 65.115002 USDT–66.324998 USDT.
Bearish scenario: A completed daily candle closing below 56.675002 USDT after the cutoff confirms the condition; a completed daily candle closing above 60.01 USDT invalidates it. The trigger lies within the structural zone at 56.185002 USDT–57.134998 USDT. A qualifying close can still be inside this zone, leaving its lower boundary at 56.185002 USDT uncleared. The next mapped zones are 54.765002 USDT–55.964998 USDT; 50.885002 USDT–52.054998 USDT.
Confidence in the directional assessment is low because the daily and weekly swing trends point in opposite directions and downward momentum is easing.
TRON (TRX)
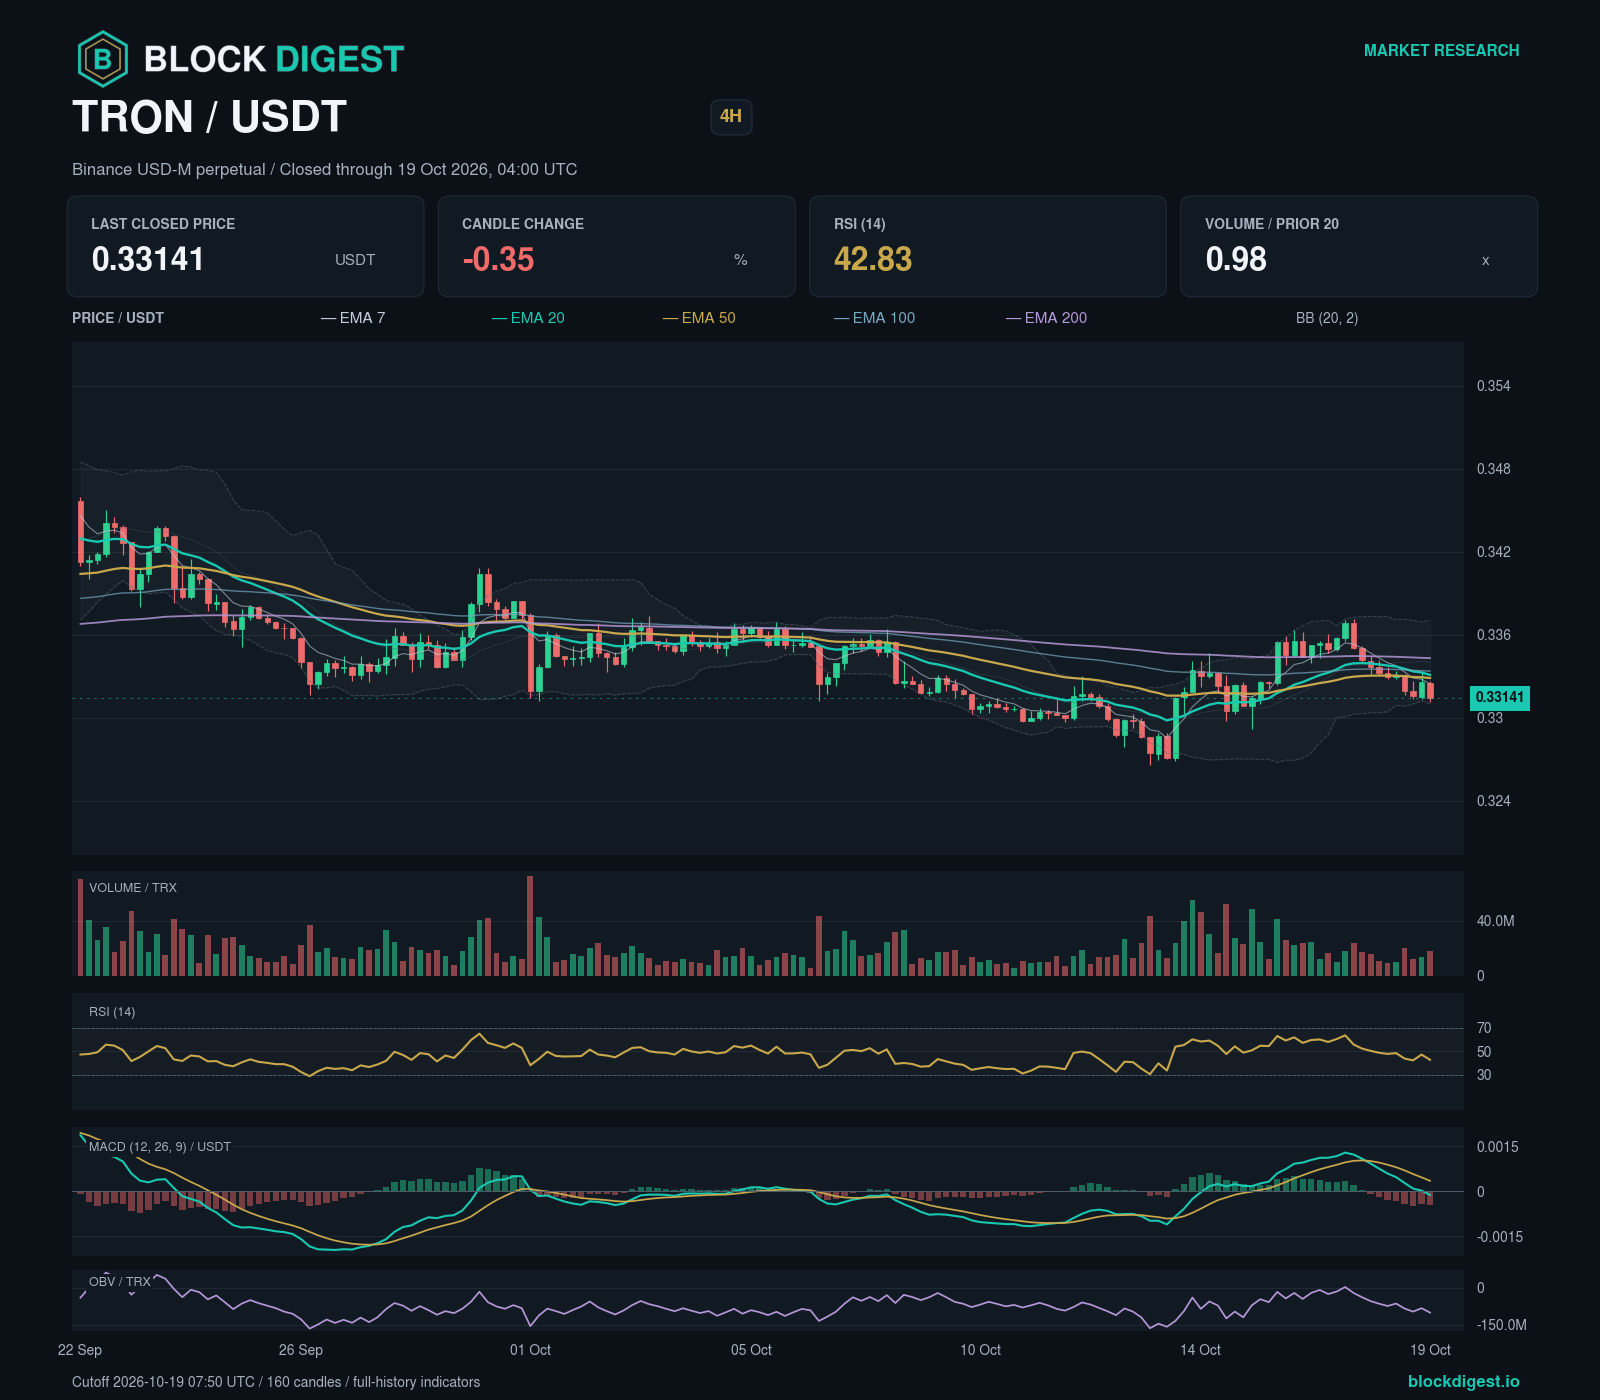
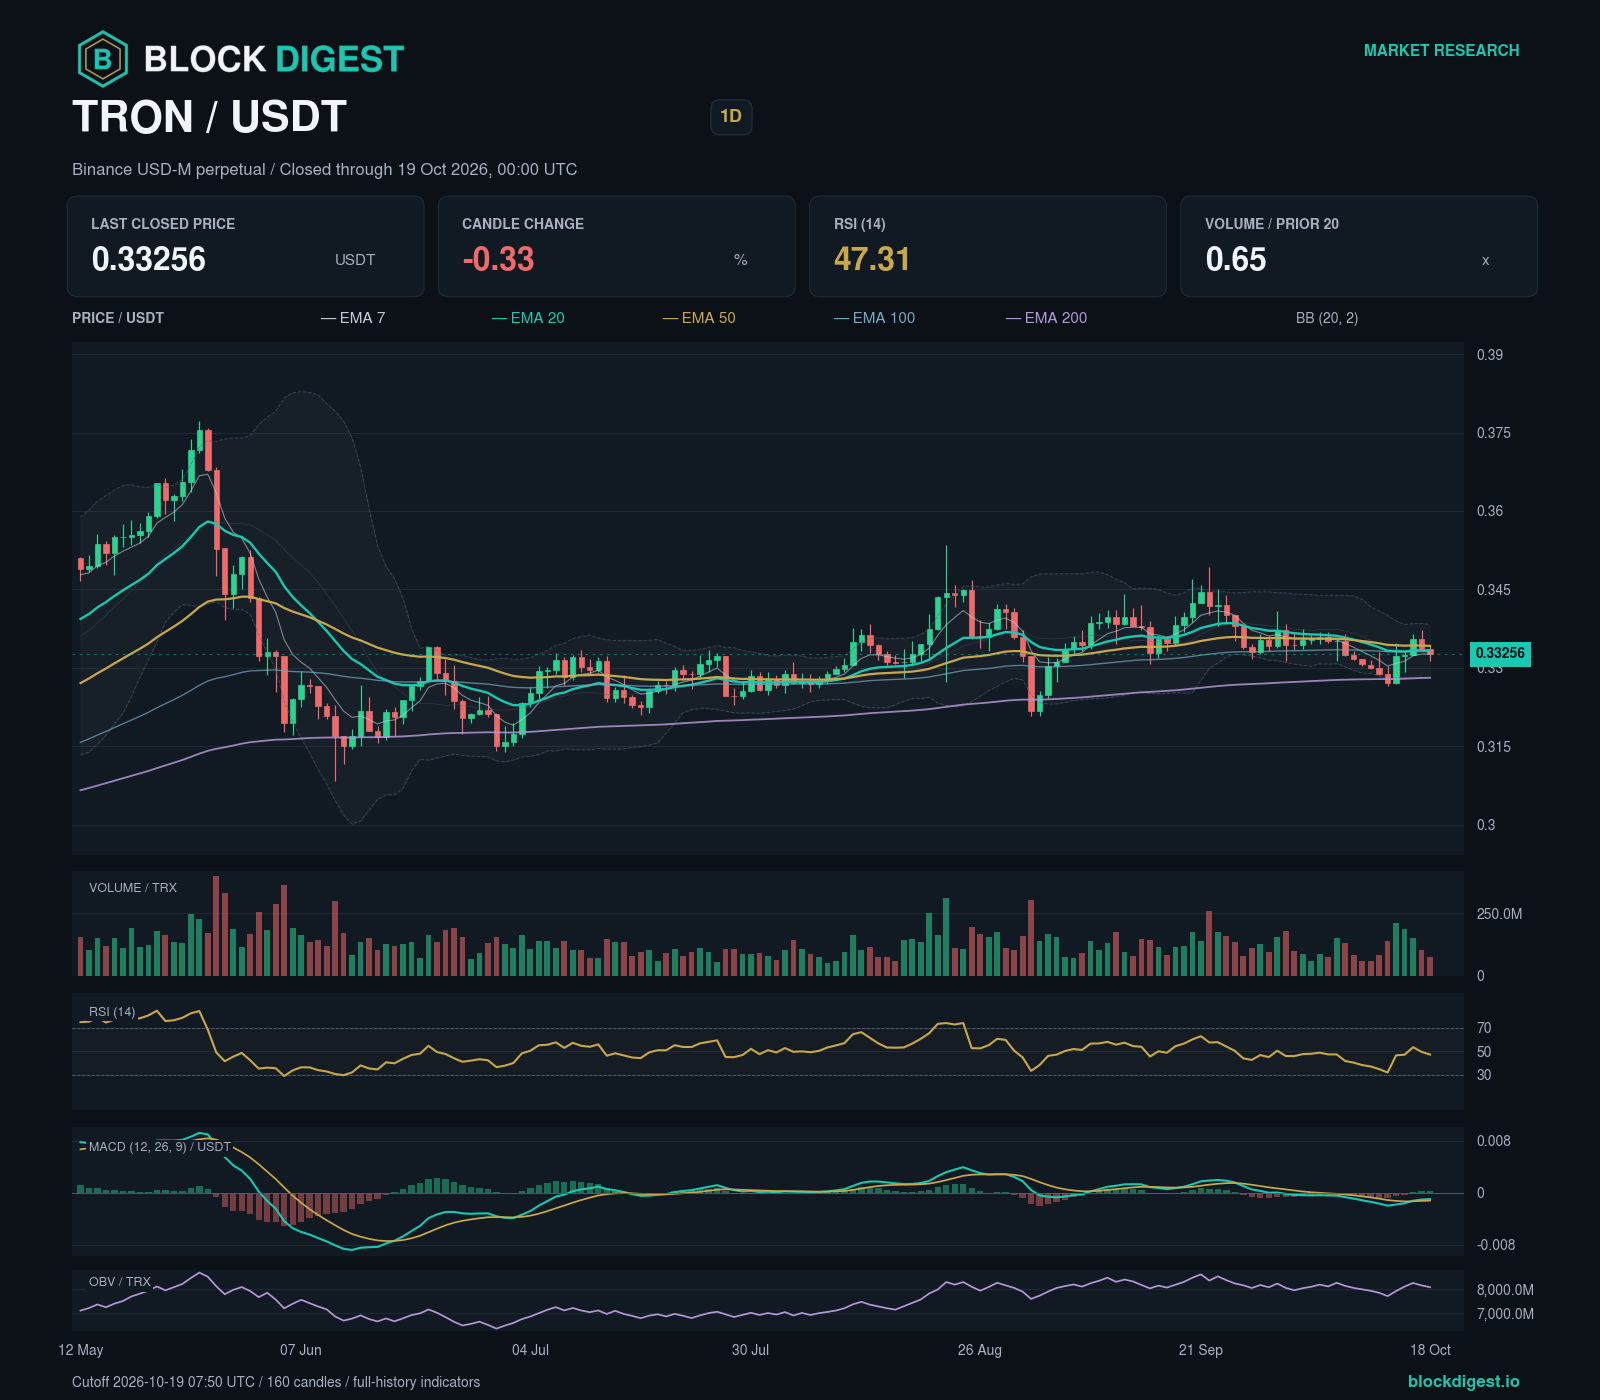
TRON’s daily chart shows lower confirmed swing highs and lower swing lows, giving a bearish structural assessment. The weekly chart shows a mixed sequence of confirmed swing highs and lows; the four-hour chart shows a close below the latest confirmed swing low, without a completed lower-high, lower-low sequence yet.
The latest completed four-hour candle closed at 0.33141 USDT, for the period ending 2026-10-19 04:00 UTC.
Daily RSI is 47.31; the MACD histogram is 0.00022085461 USDT. The histogram is positive and increasing, consistent with upward momentum gathering strength. Daily volume was 0.65 times its preceding 20-day baseline. OBV fell over three daily bars. The volatility regime is compression.
Bullish scenario: A completed daily candle closing above 0.33383988 USDT after the cutoff confirms the condition; a completed daily candle closing below 0.32597012 USDT invalidates it. The trigger lies within the structural zone at 0.33349012 USDT–0.33508988 USDT. A qualifying close can still be inside this zone, leaving its upper boundary at 0.33508988 USDT uncleared. The next mapped zones are 0.33633012 USDT–0.33777988 USDT; 0.33781012 USDT–0.33902988 USDT.
Bearish scenario: A completed daily candle closing below 0.32597012 USDT after the cutoff confirms the condition; a completed daily candle closing above 0.33383988 USDT invalidates it. The next mapped zones are 0.32386012 USDT–0.32507988 USDT; 0.32014012 USDT–0.32144988 USDT.
Confidence in the directional assessment is low because the daily and weekly swing structures have yet to confirm the same trend and the daily MACD histogram has moved against the base directional thesis.
Altcoin Outlook
TRX’s recent BTC-relative gain sits against a bearish daily structure. A further relative gain would not, by itself, overturn the confirmed swing sequence.
For SOL, DOGE, LTC, opposing daily and weekly swing trends remain a key qualification. The scenarios retain their specified daily-close tests; confirmation on that horizon does not automatically resolve the weekly conflict.
TRX gained against BTC in the completed seven-day perpetual-price ratio comparison.
SOL, XRP, BNB, DOGE, LTC lost ground to BTC on the same basis.
These relative moves describe the observed window. Stronger past returns do not establish a better forward setup; each coin’s structural thesis, counter-evidence and closing conditions still matter.
Each scenario lasts seven days from the analysis cutoff and requires a completed daily close, not an intraday touch. A confirming close may already be inside or beyond a target zone; only zones still ahead remain prospective checkpoints. If none remain, a fresh assessment is needed. Overlapping bands are not independent targets, and older zones are context rather than a forecast for this week.
Data notes. Data as of: 2026-10-19T07:50:00.363+00:00. Prices and volume come from Binance USDT perpetual futures. The basket is fixed at SOL, XRP, BNB, DOGE, LTC and TRX. Confidence grades are uncalibrated qualitative assessments, not probabilities.
Source correction — XRP. Weekly base volume for the period(s) starting 2023-09-04 UTC was reconstructed from seven validated daily bars. OHLC and the other four aggregate fields matched the provider’s weekly candle exactly; the inconsistent original and supporting observations are archived.
Disclaimer: This analysis is for informational purposes only and does not constitute financial advice. Cryptocurrency markets are highly volatile and unpredictable. All trading decisions should be made based on your own research and risk tolerance. Block Digest is not responsible for any financial losses incurred as a result of acting on this content.
Stay Ahead of the Market
Follow BlockDigest for crypto market intelligence, research and real-time updates.