Weekly Market Context
TRON led the covered coins against BTC during the completed seven-day window, although its daily swing sequence has yet to establish a confirmed direction. Recent relative gains and confirmed trends describe different aspects of the market.
Within BlockDigest’s fixed six-coin basket, 0 of 6 available daily structures are bullish, 4 bearish and 2 neutral. These classifications describe confirmed swing sequences. They do not measure the entire altcoin market or predict the next week’s returns.
Daily and weekly swing trends oppose one another for SOL, DOGE, LTC. The shorter-term direction therefore conflicts with the higher-timeframe backdrop.
The trailing seven-day comparison runs from the daily close ending 2026-10-05 to the daily close ending 2026-10-12 UTC. It is a completed historical window, separate from the forward scenario window.
Weekly Snapshot Table
Daily prices and indicators below use the completed candle ending 2026-10-12 00:00 UTC. The latest completed four-hour closes and their period-end times are reported in the individual coin sections.
| Coin | Last daily close (USDT) | Trailing 7D | Perpetual ratio vs BTC, 7D | Daily RSI | Structural bias |
|---|---|---|---|---|---|
| SOL | 111.30 | -8.43% | -5.41% | 46.88 | bearish |
| XRP | 1.4095 | -7.28% | -4.22% | 45.52 | bearish |
| BNB | 754.45 | -5.20% | -2.08% | 49.05 | neutral |
| DOGE | 0.08674 | -9.55% | -6.57% | 44.07 | bearish |
| LTC | 64.61 | -8.55% | -5.53% | 51.52 | bearish |
| TRX | 0.33 | -1.62% | +1.62% | 37.20 | neutral |
The BTC comparison is the change in the ratio of synchronized USDT perpetual-futures closes. It is neither a spot Alt/BTC quote nor a measure of capital flows. No dominance-based rotation conclusion is made.
Solana (SOL)
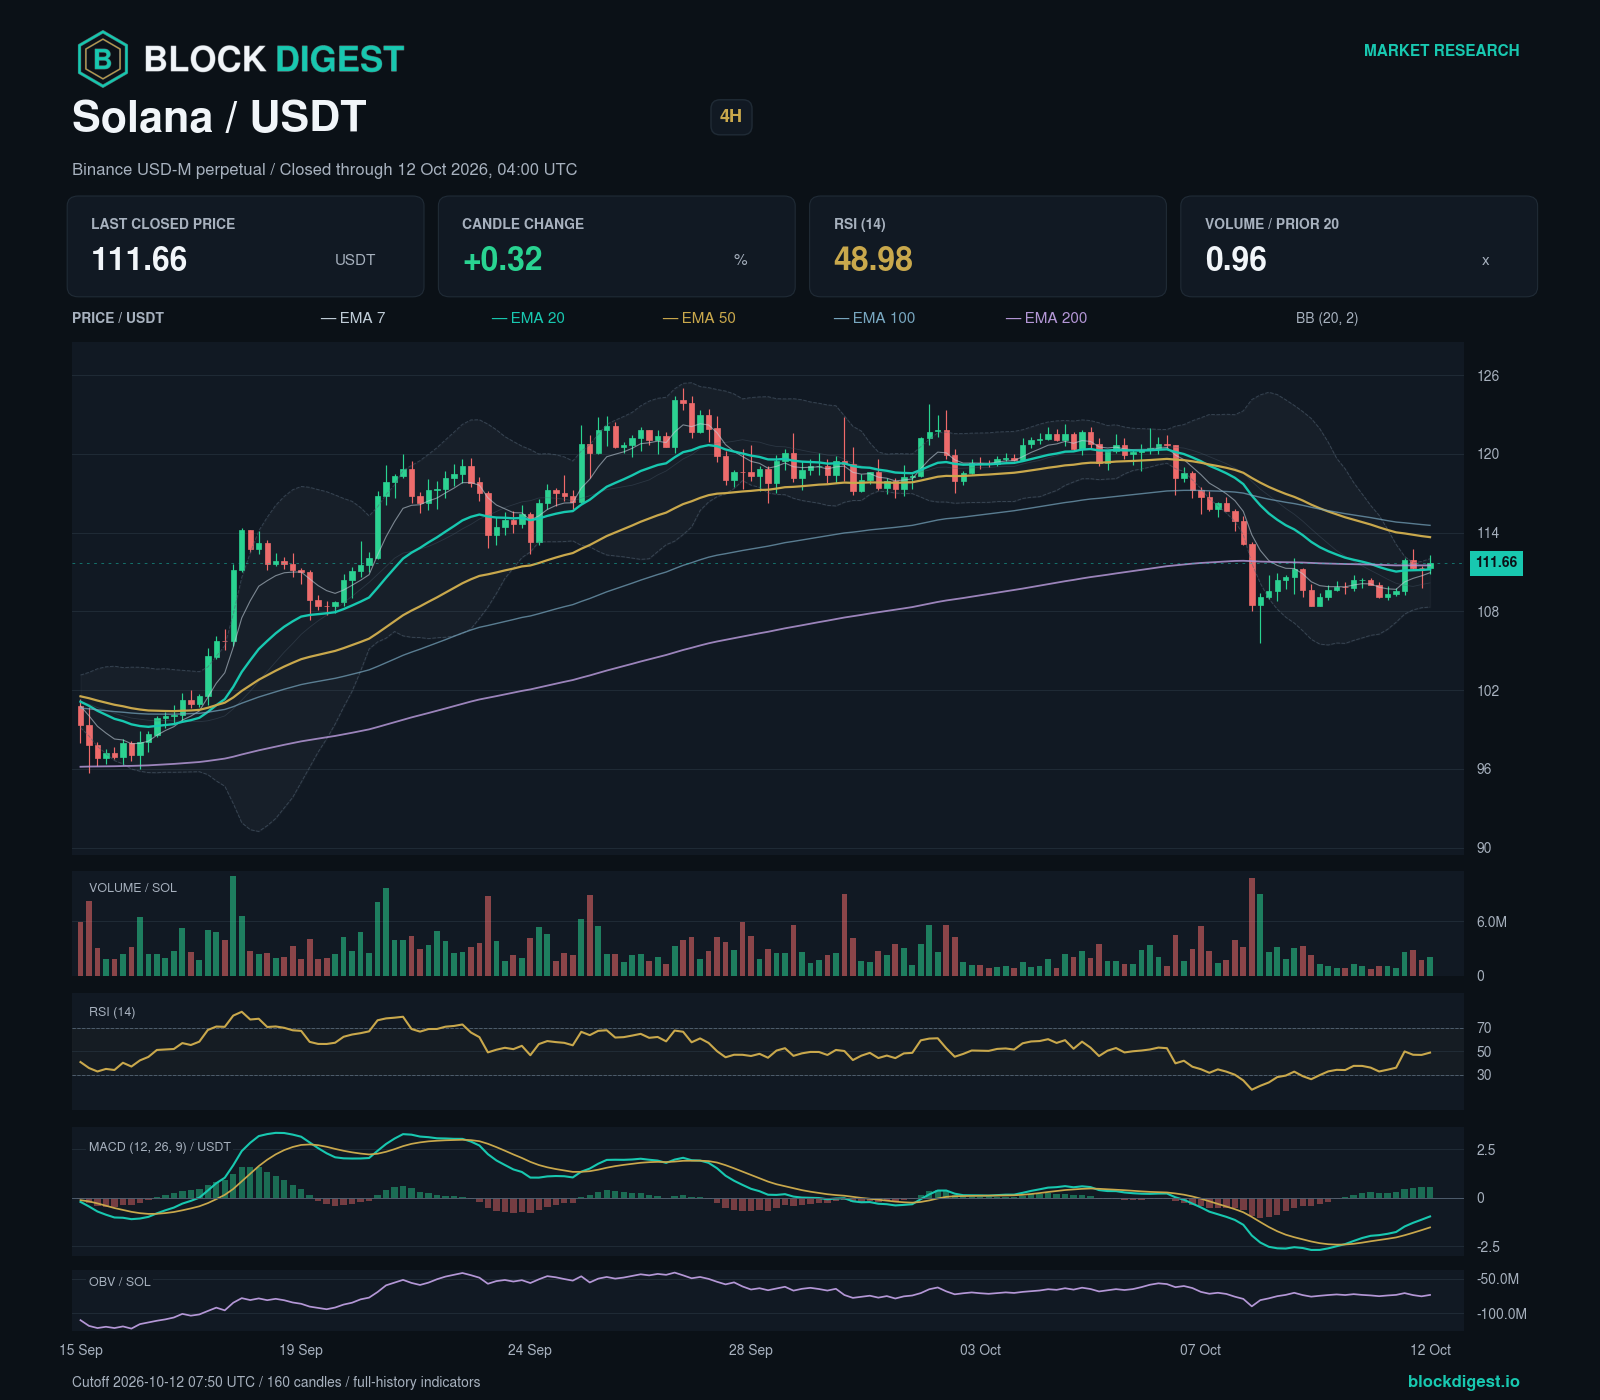
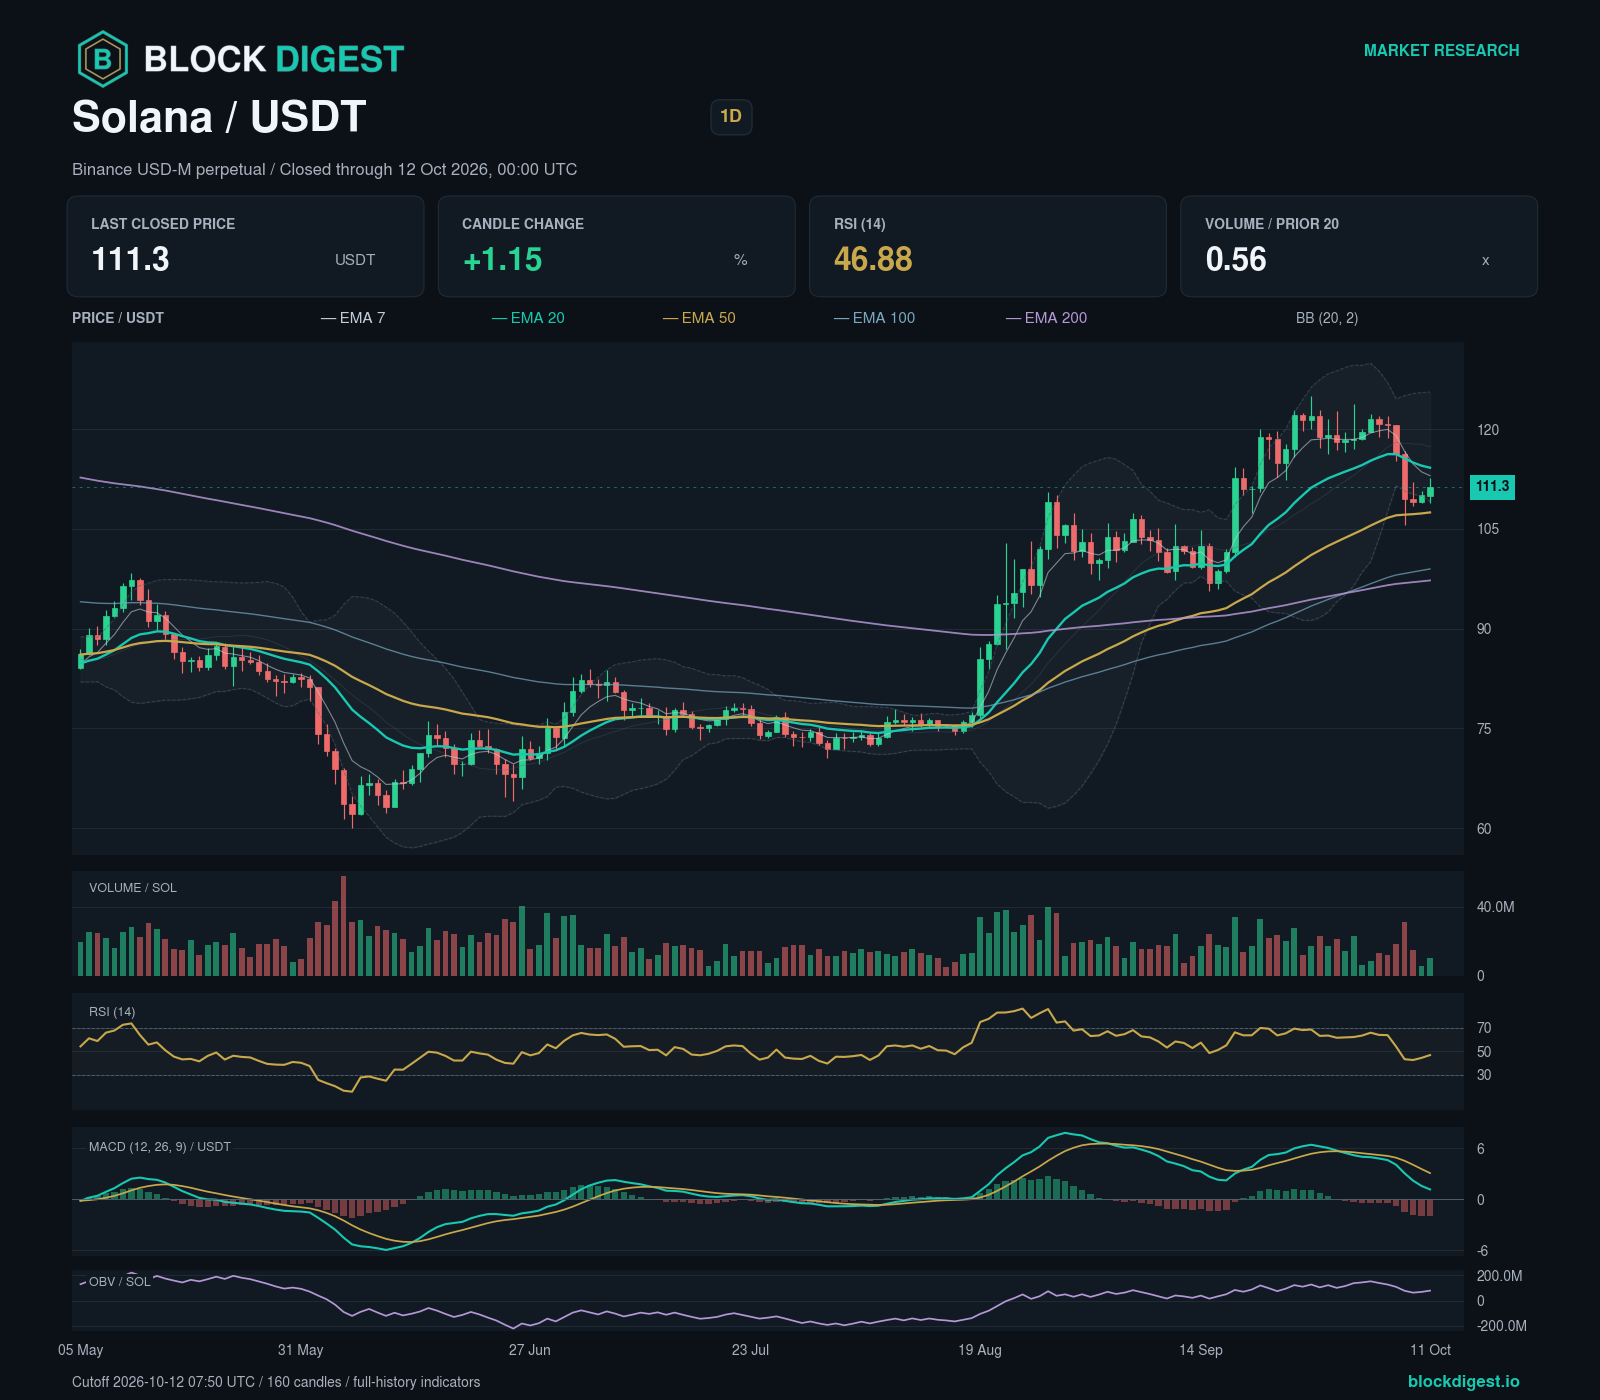
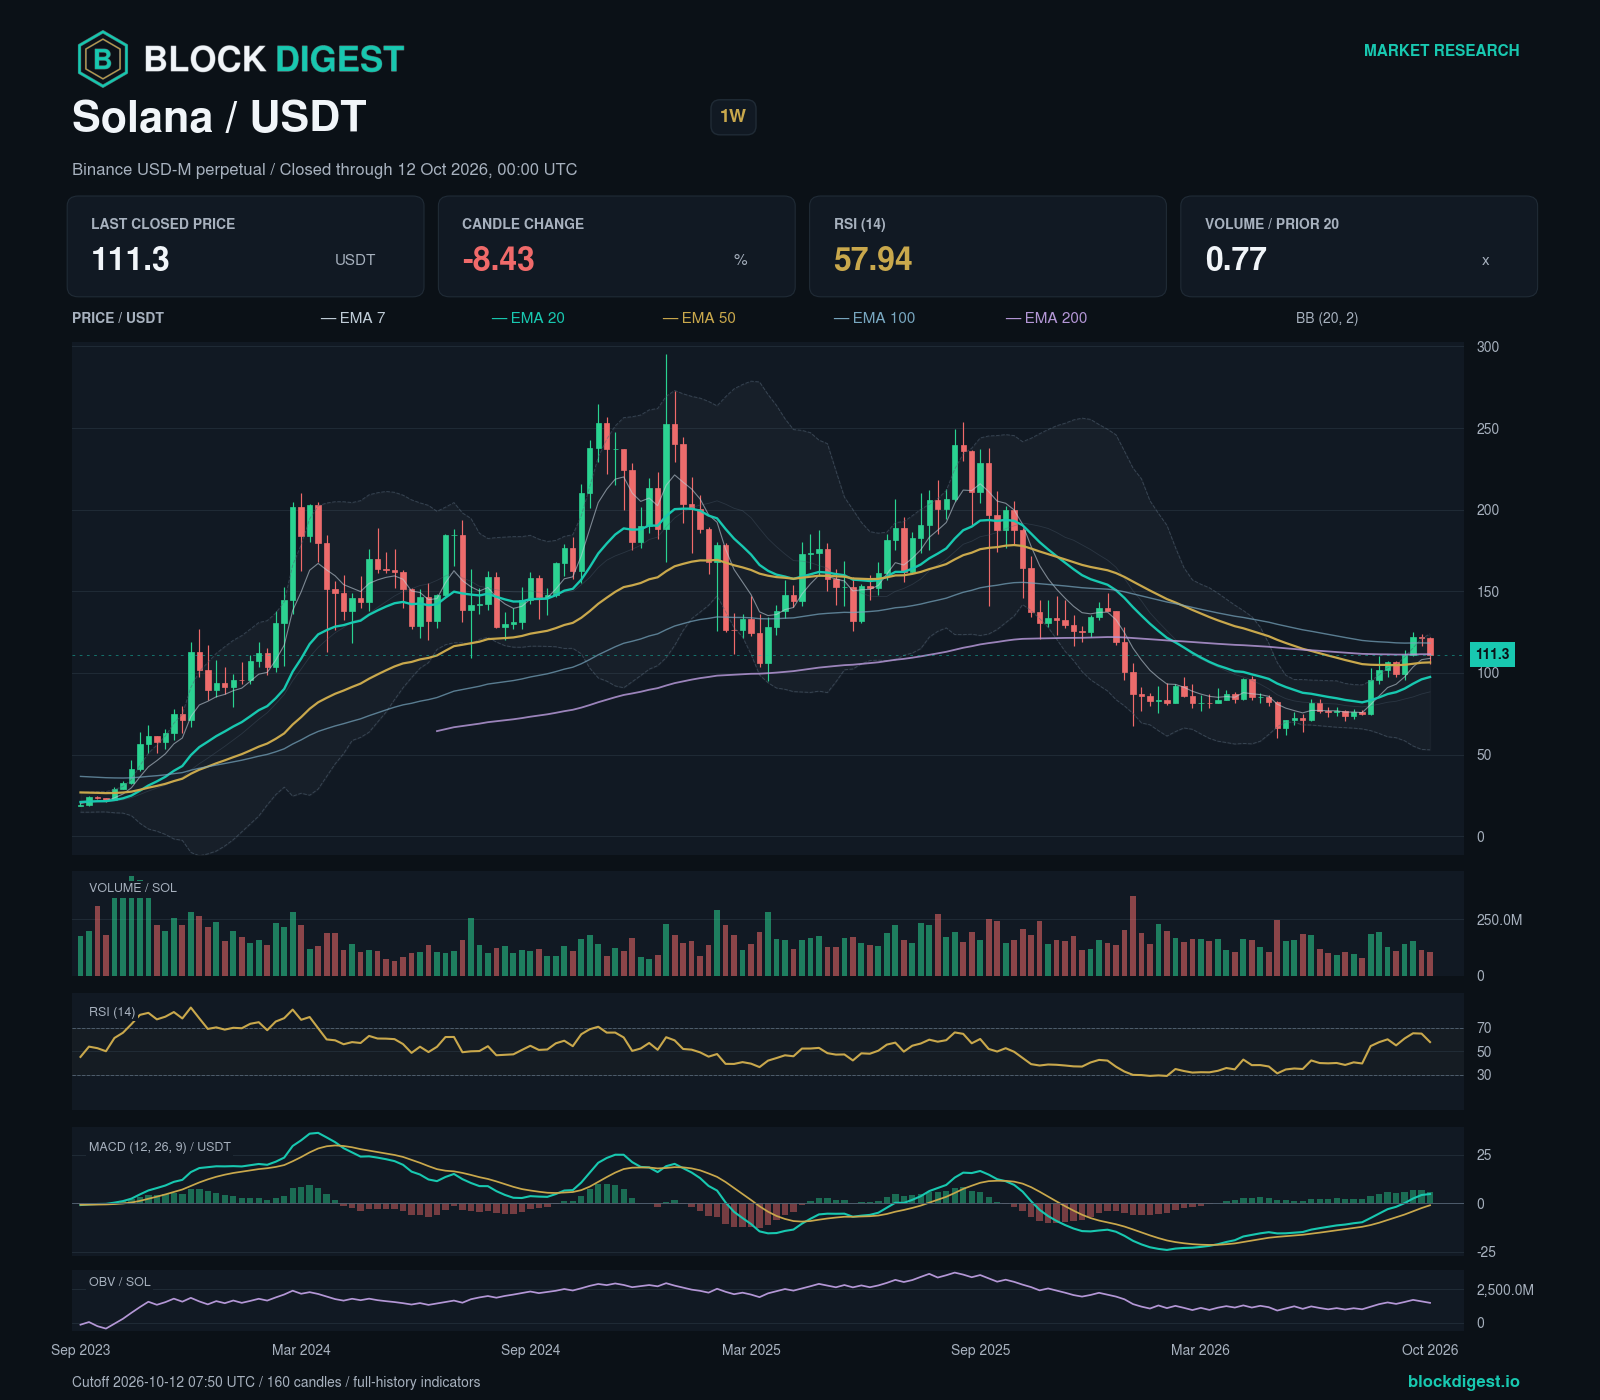
Solana’s daily chart shows lower confirmed swing highs and lower swing lows, giving a bearish structural assessment. Both the weekly and four-hour charts show higher confirmed swing highs and higher swing lows.
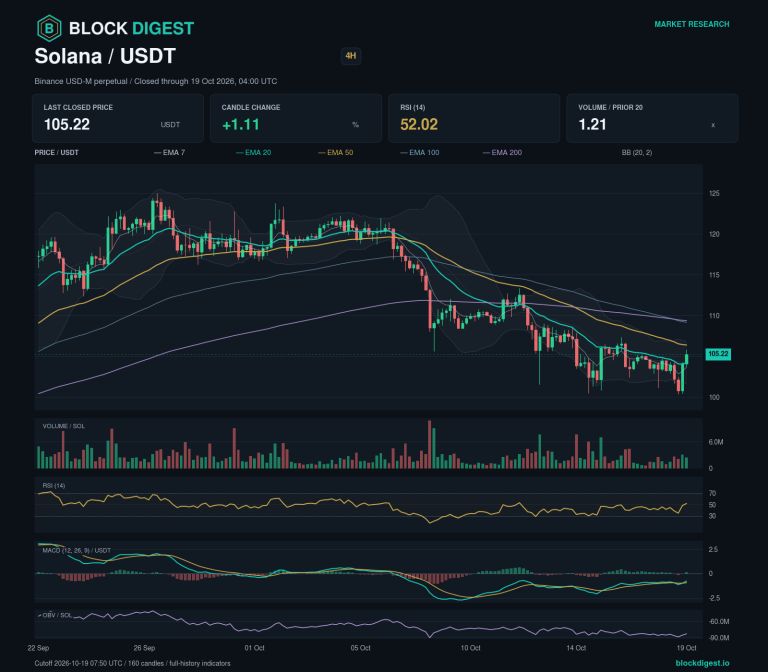
The latest completed four-hour candle closed at 111.66 USDT, for the period ending 2026-10-12 04:00 UTC.
Daily RSI is 46.88; the MACD histogram is -1.9210068 USDT. MACD is still above zero, though below its signal line. Daily volume was 0.56 times its preceding 20-day baseline. OBV rose over three daily bars. The volatility regime is normal.
Bullish scenario: A completed daily candle closing above 112.73 USDT after the cutoff confirms the condition; a completed daily candle closing below 104.89367 USDT invalidates it. This is a break above the last completed daily high. The reference is an observed candle extreme, not a confirmed swing pivot. The trigger lies within the structural zone at 111.67367 USDT–113.10633 USDT. A qualifying close can still be inside this zone, leaving its upper boundary at 113.10633 USDT uncleared. The next mapped zones are 113.60367 USDT–115.03633 USDT; 115.53367 USDT–117.42633 USDT.
Bearish scenario: A completed daily candle closing below 104.89367 USDT after the cutoff confirms the condition; a completed daily candle closing above 112.73 USDT invalidates it. The trigger lies within the structural zone at 104.09367 USDT–105.52633 USDT. A qualifying close can still be inside this zone, leaving its lower boundary at 104.09367 USDT uncleared. The next mapped zones are 97.643674 USDT–99.076326 USDT; 95.003674 USDT–96.436326 USDT.
Confidence in the directional assessment is low because the daily and weekly swing trends point in opposite directions and the four-hour swing structure opposes the daily trend.
XRP (XRP)
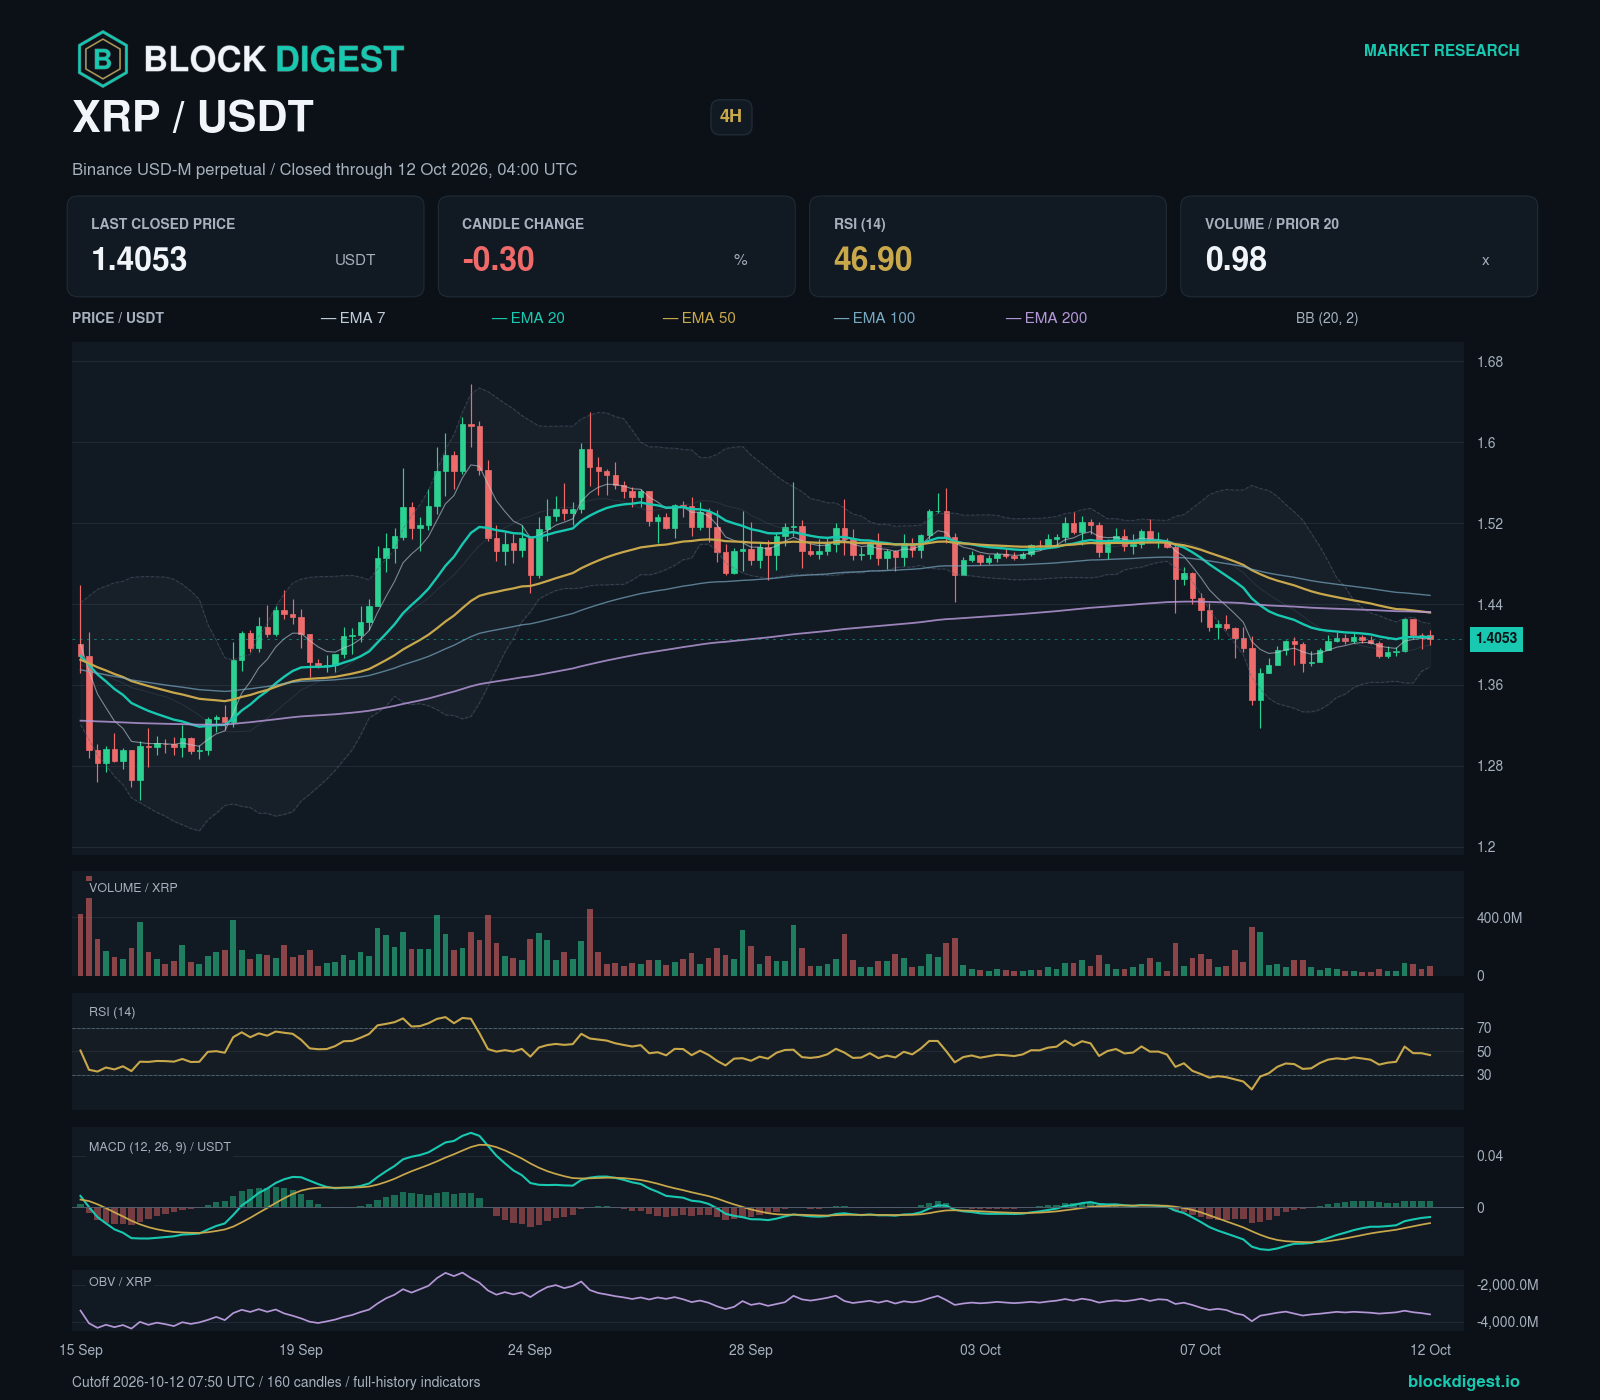
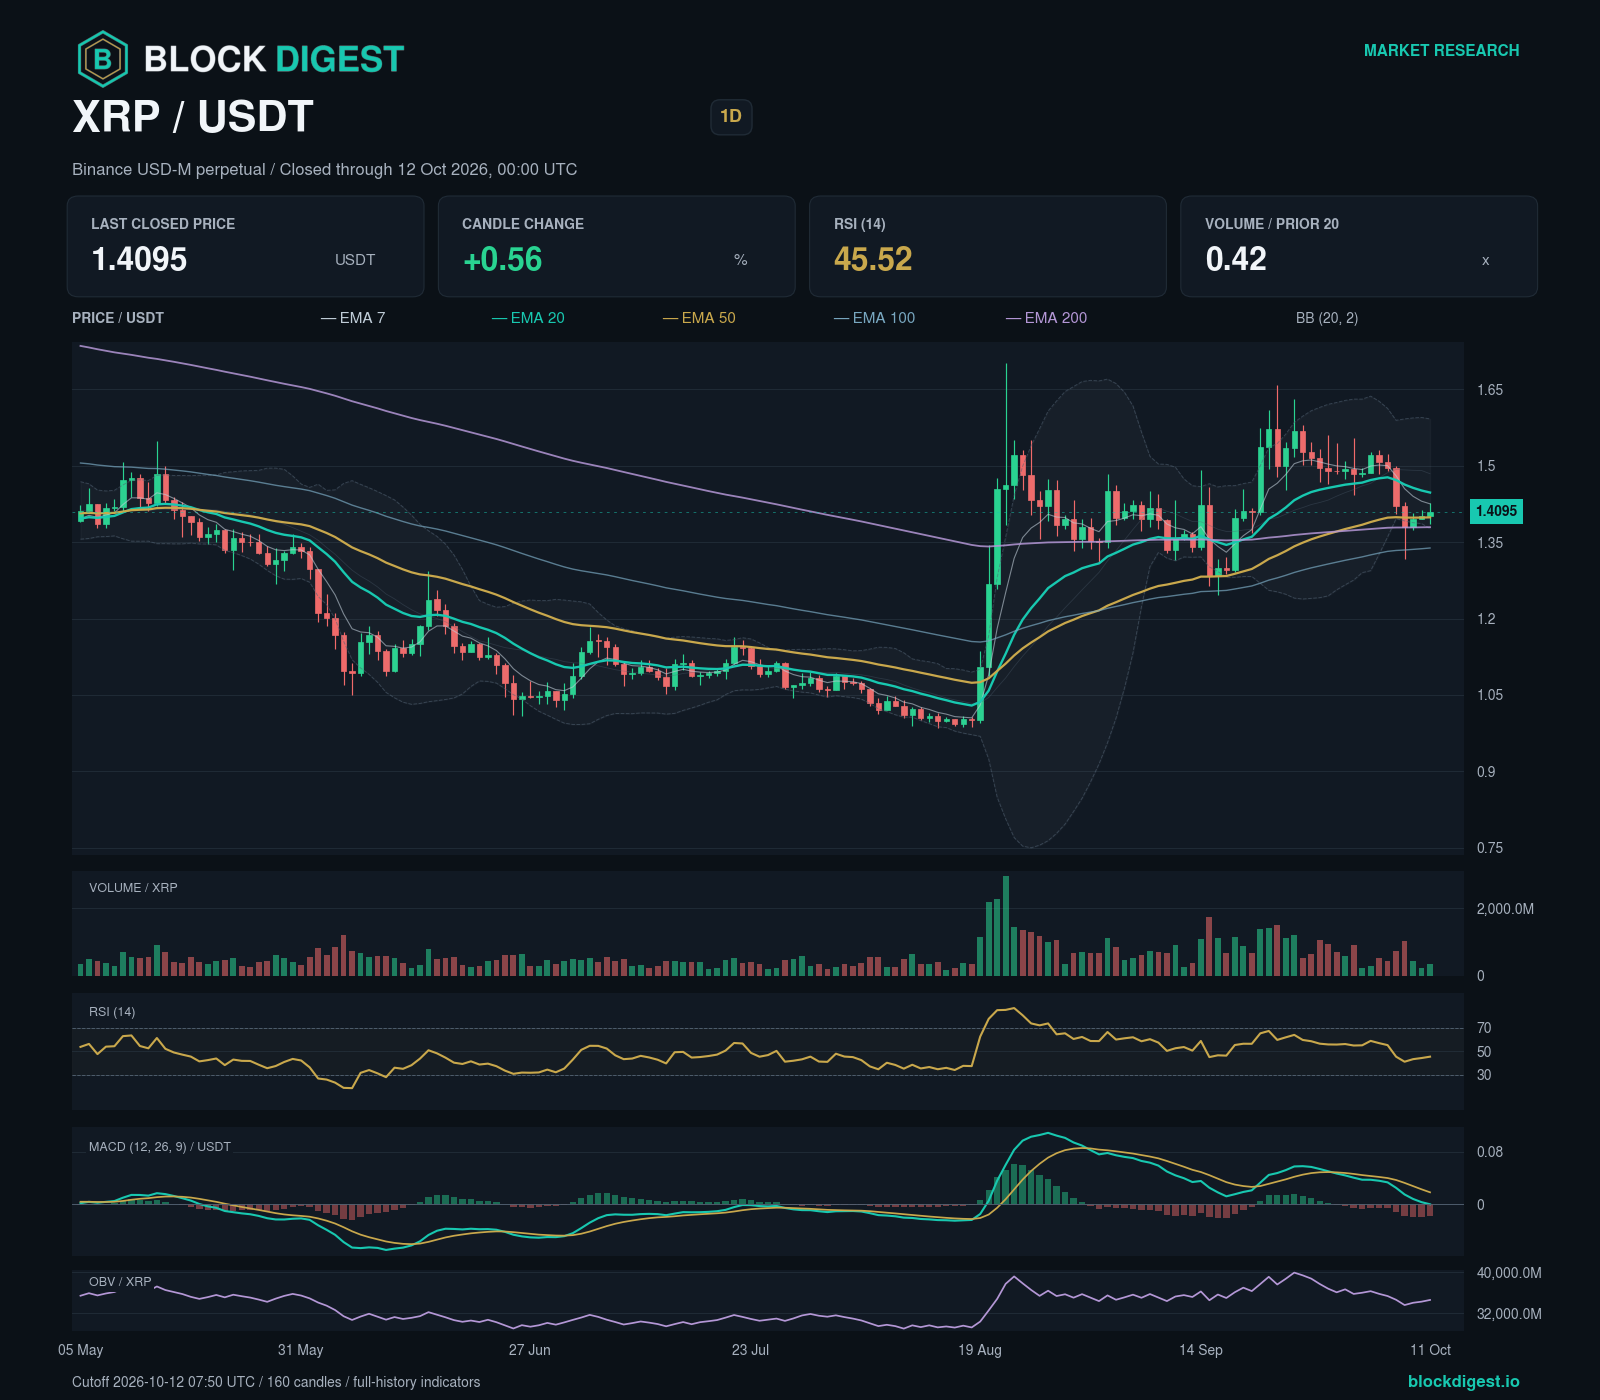
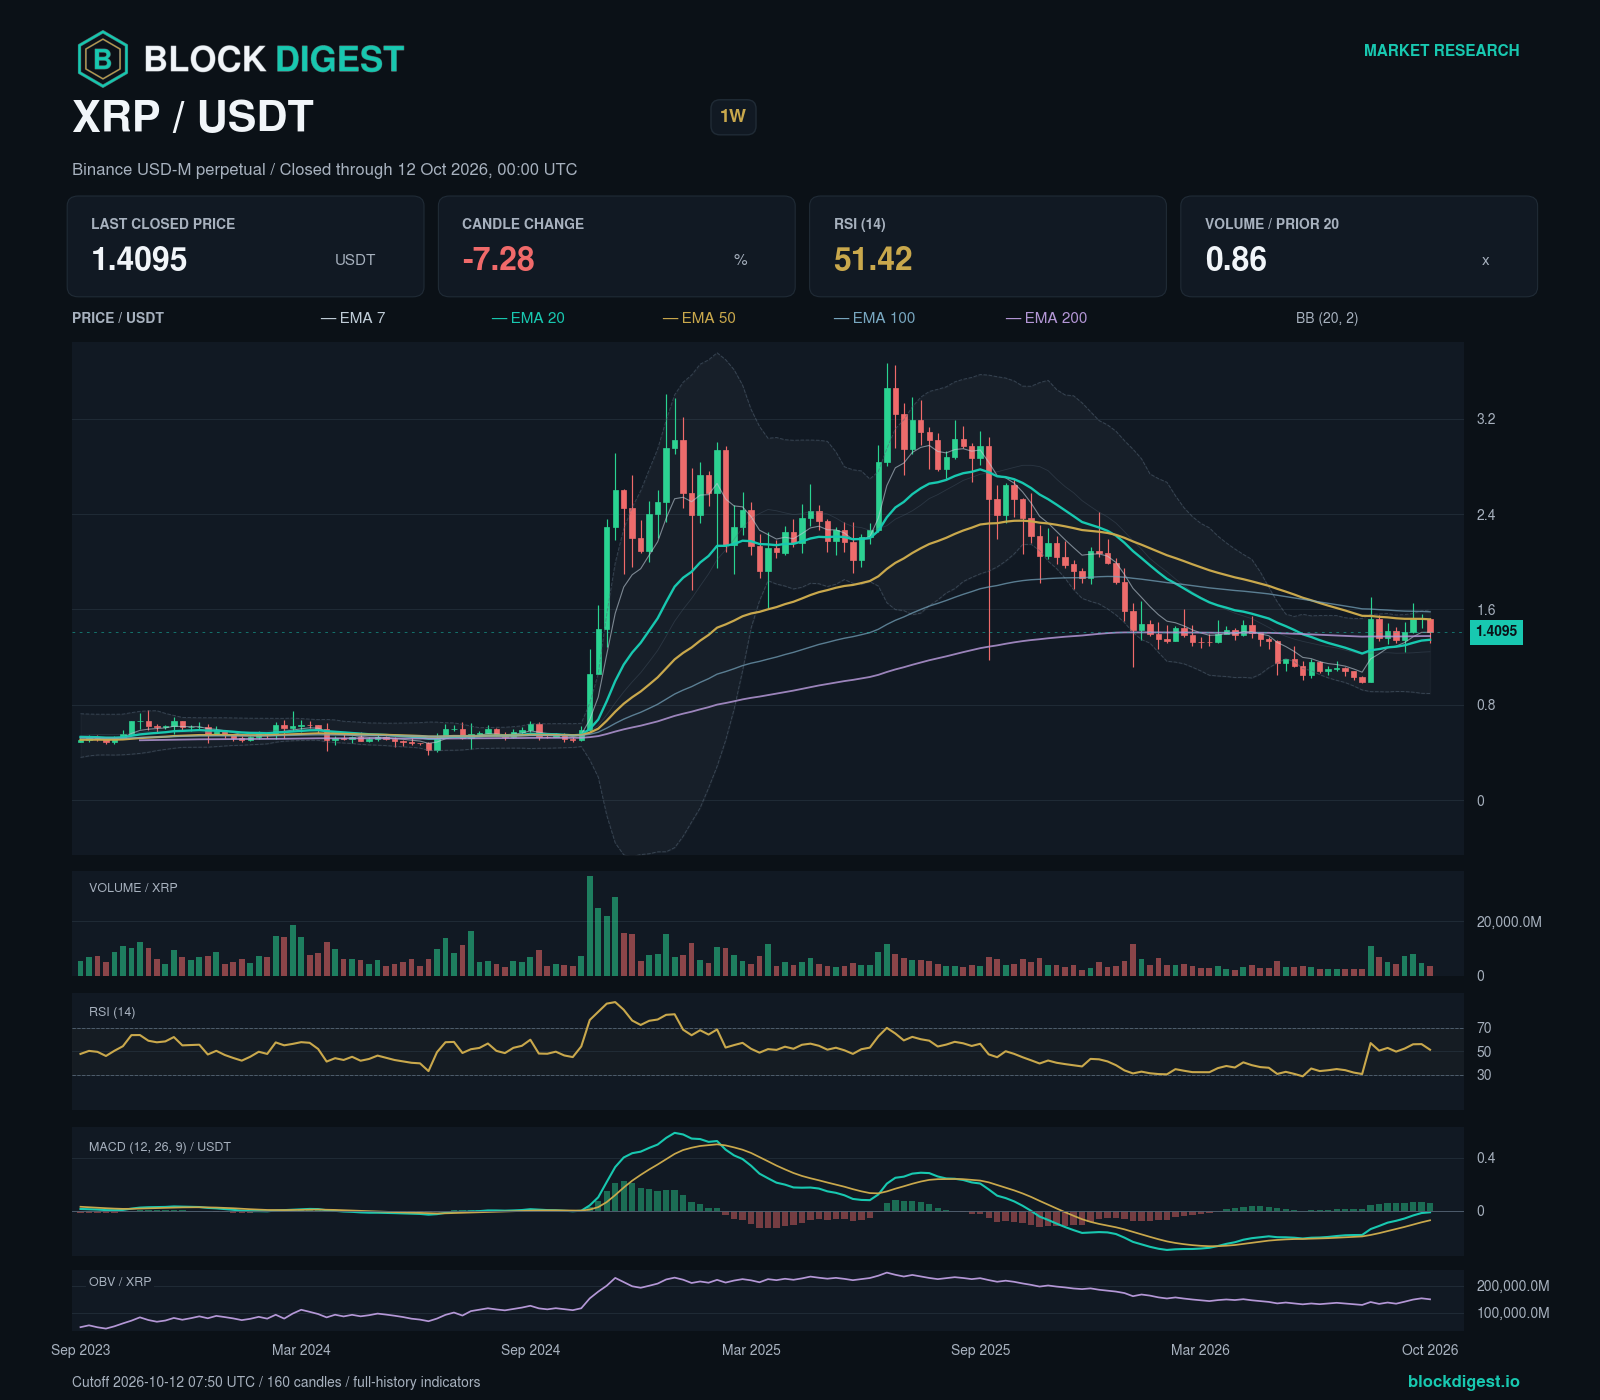
XRP’s daily chart shows lower confirmed swing highs and lower swing lows, giving a bearish structural assessment. The weekly chart shows a mixed sequence of confirmed swing highs and lows; the four-hour chart shows higher confirmed swing highs and higher swing lows.
The latest completed four-hour candle closed at 1.4053 USDT, for the period ending 2026-10-12 04:00 UTC.
Daily RSI is 45.52; the MACD histogram is -0.018281885 USDT. MACD sits below its signal line, describing momentum without confirming a change in swing structure. Daily volume was 0.42 times its preceding 20-day baseline. OBV rose over three daily bars. The volatility regime is normal.
Bullish scenario: A completed daily candle closing above 1.426 USDT after the cutoff confirms the condition; a completed daily candle closing below 1.2983091 USDT invalidates it. This is a break above the last completed daily high. The reference is an observed candle extreme, not a confirmed swing pivot. The next mapped zones are 1.4323091 USDT–1.4614909 USDT; 1.4736091 USDT–1.5017909 USDT.
Bearish scenario: A completed daily candle closing below 1.2983091 USDT after the cutoff confirms the condition; a completed daily candle closing above 1.426 USDT invalidates it. The next mapped zones are 1.2591091 USDT–1.2871909 USDT; 1.2355091 USDT–1.2558909 USDT.
Confidence in the directional assessment is low because the daily and weekly swing structures have yet to confirm the same trend and the four-hour swing structure opposes the daily trend.
BNB (BNB)
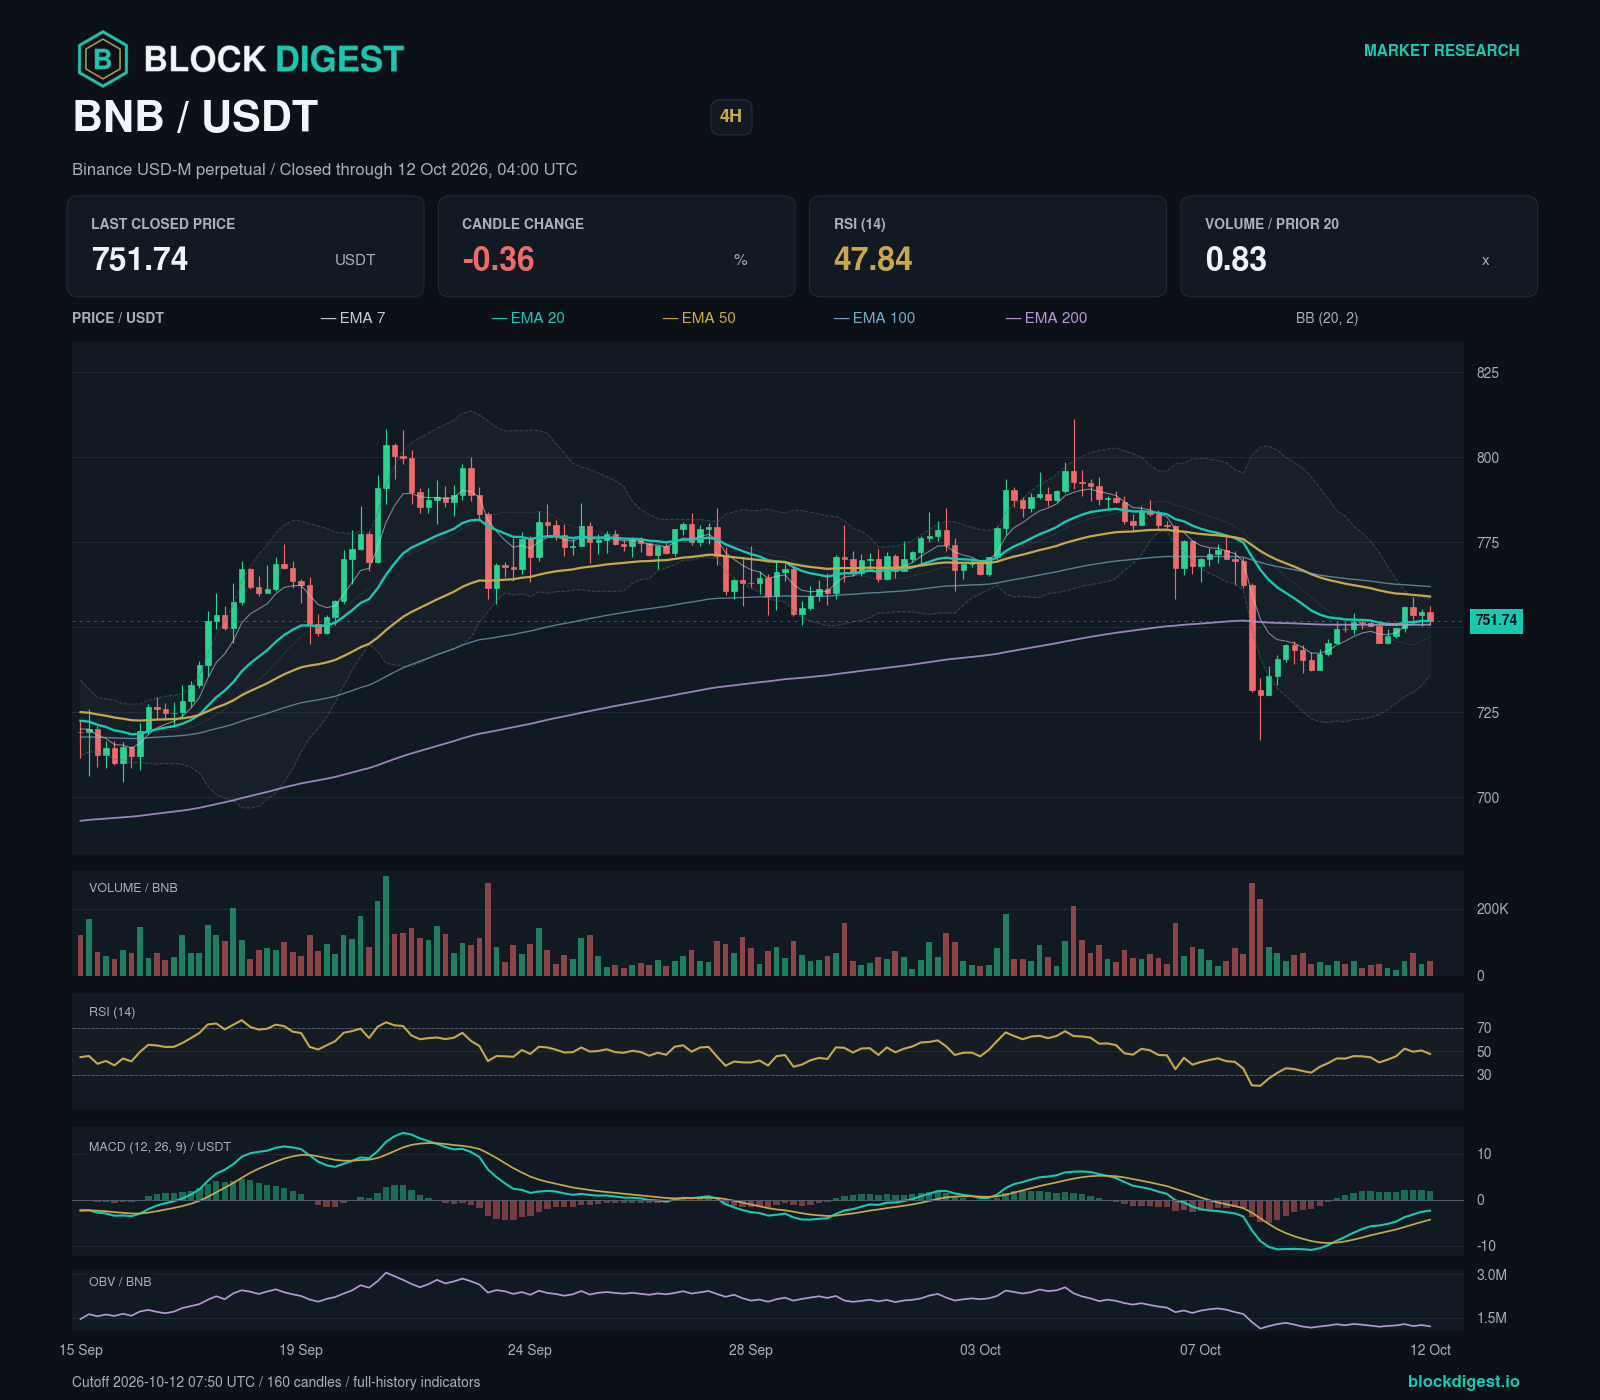
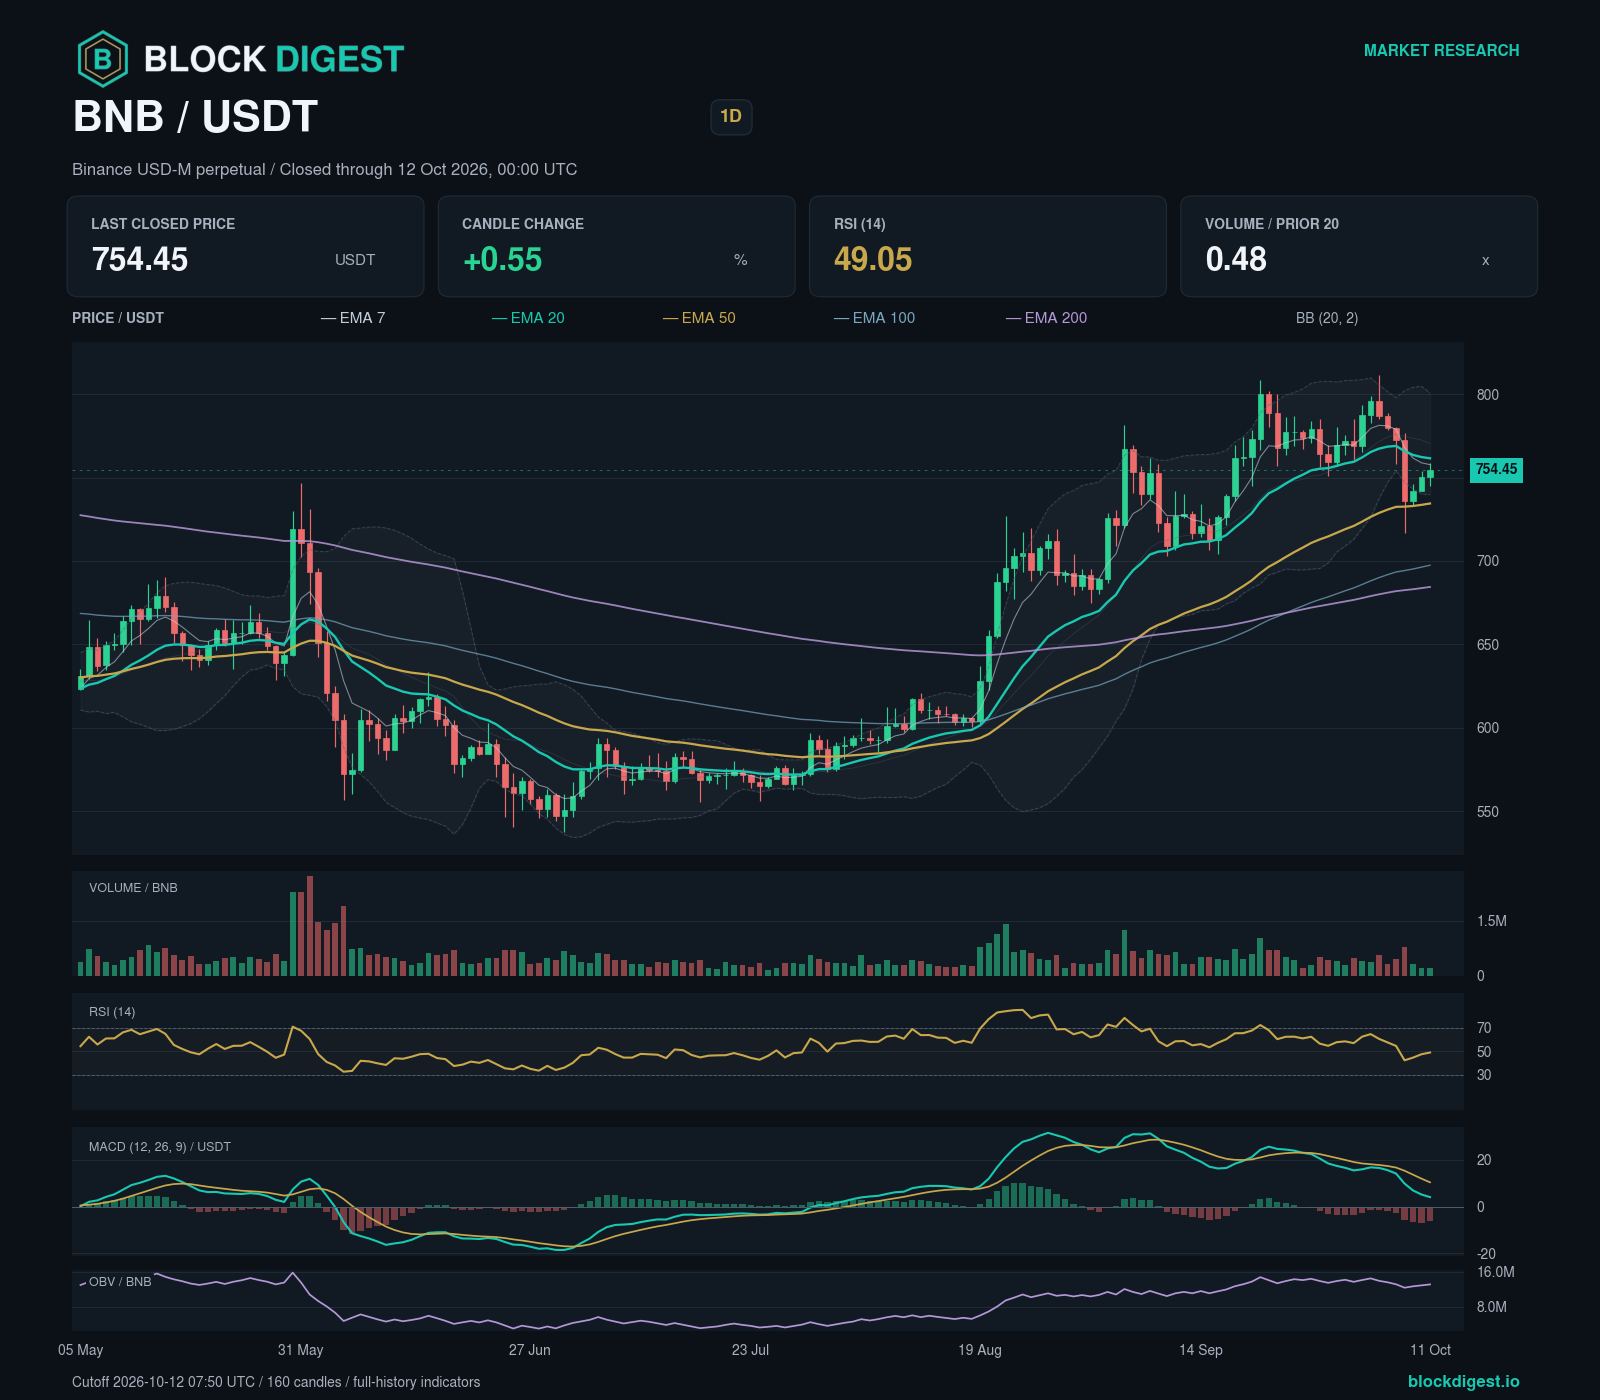
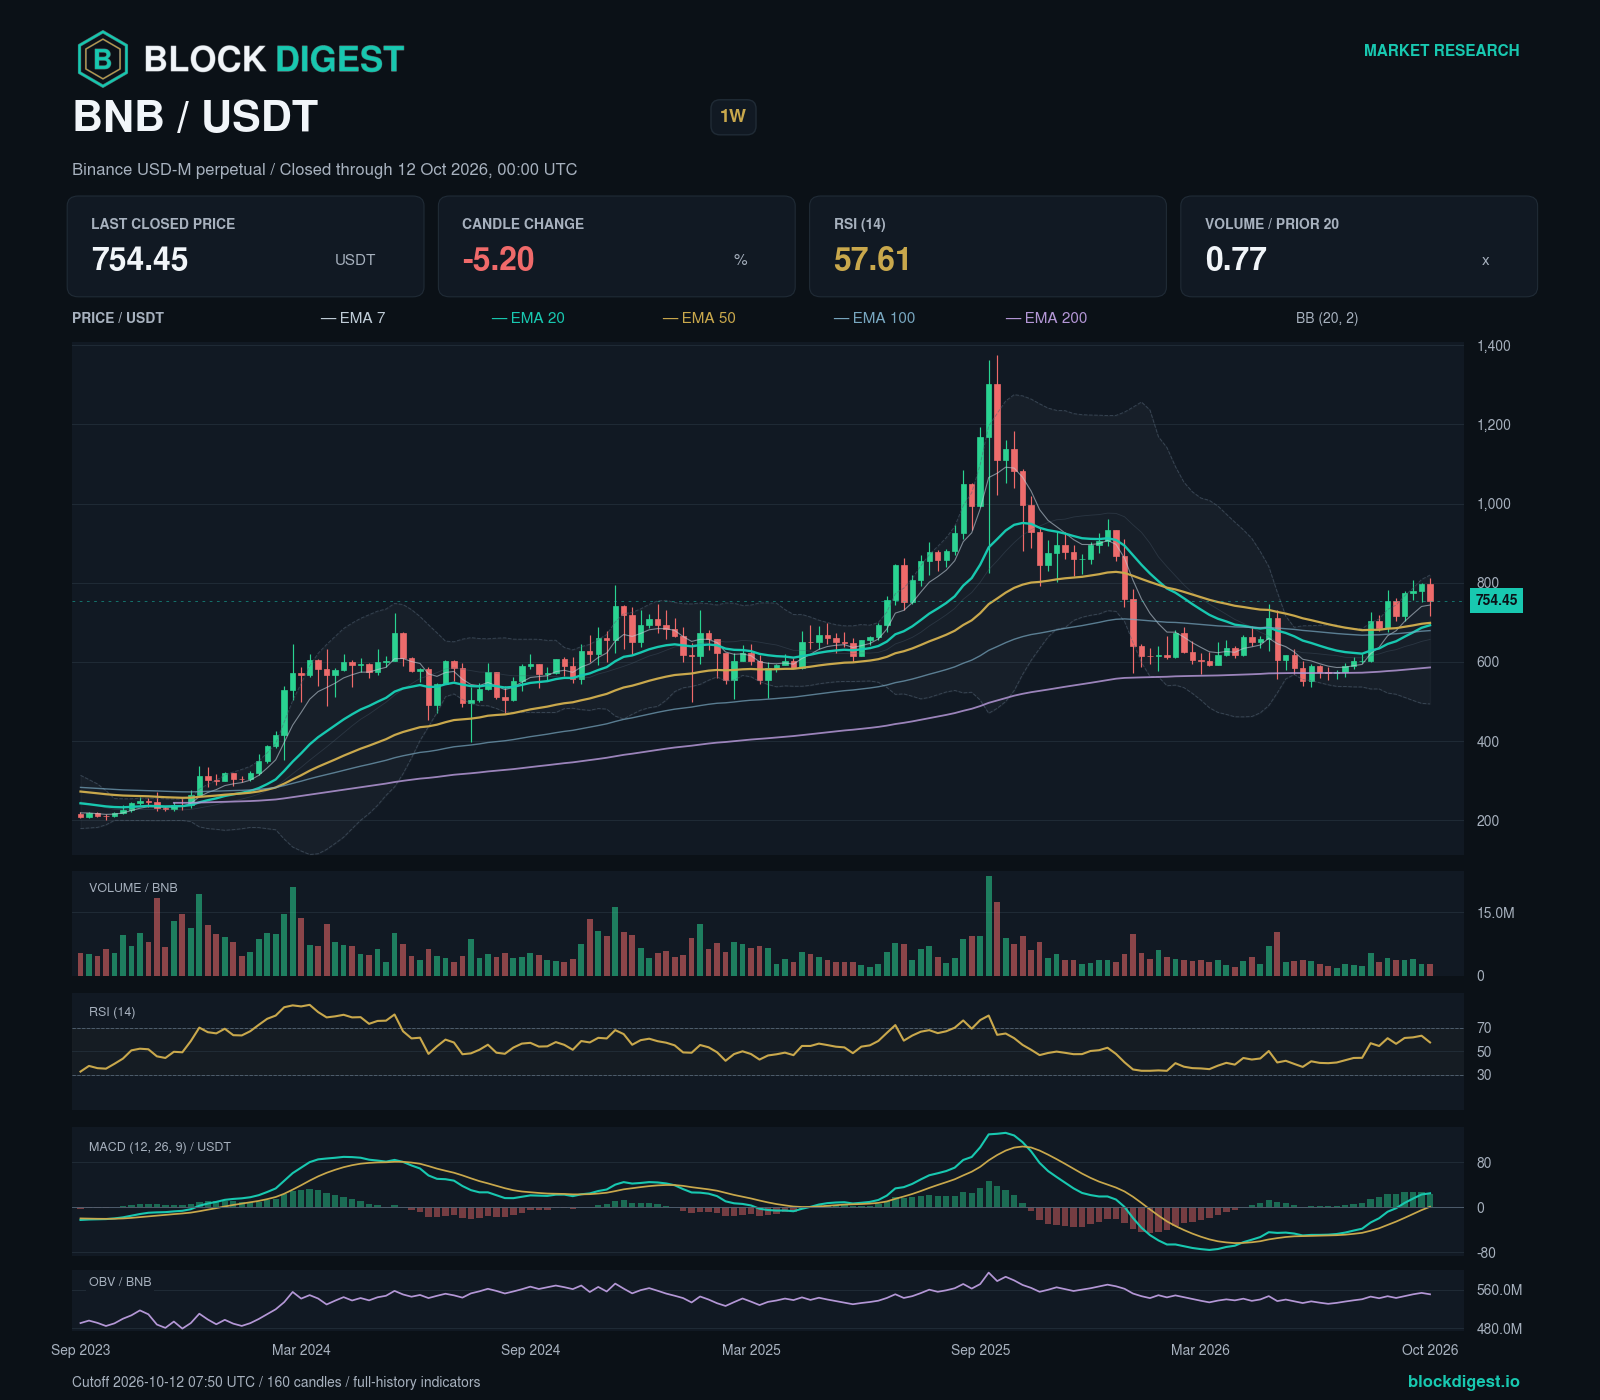
BNB’s daily chart shows a mixed sequence of confirmed swing highs and lows, giving a neutral structural assessment. The weekly chart shows a mixed sequence of confirmed swing highs and lows; the four-hour chart shows higher confirmed swing highs and higher swing lows.
The latest completed four-hour candle closed at 751.74 USDT, for the period ending 2026-10-12 04:00 UTC.
Daily RSI is 49.05; the MACD histogram is -6.3067687 USDT. MACD is still above zero, though below its signal line. Daily volume was 0.48 times its preceding 20-day baseline. OBV rose over three daily bars. The volatility regime is normal.
Bullish scenario: A completed daily candle closing above 758.77 USDT after the cutoff confirms the condition; a completed daily candle closing below 713.47016 USDT invalidates it. This is a break above the last completed daily high. The reference is an observed candle extreme, not a confirmed swing pivot. The trigger lies within the structural zone at 753.51016 USDT–760.26984 USDT. A qualifying close can still be inside this zone, leaving its upper boundary at 760.26984 USDT uncleared. The next mapped zones are 778.06016 USDT–784.81984 USDT; 787.54016 USDT–794.29984 USDT.
Bearish scenario: A completed daily candle closing below 713.47016 USDT after the cutoff confirms the condition; a completed daily candle closing above 758.77 USDT invalidates it. The next mapped zones are 699.62016 USDT–707.71984 USDT; 684.48016 USDT–691.23984 USDT.
Confidence in the directional assessment is low because the daily swing sequence has not established a confirmed directional trend.
Dogecoin (DOGE)
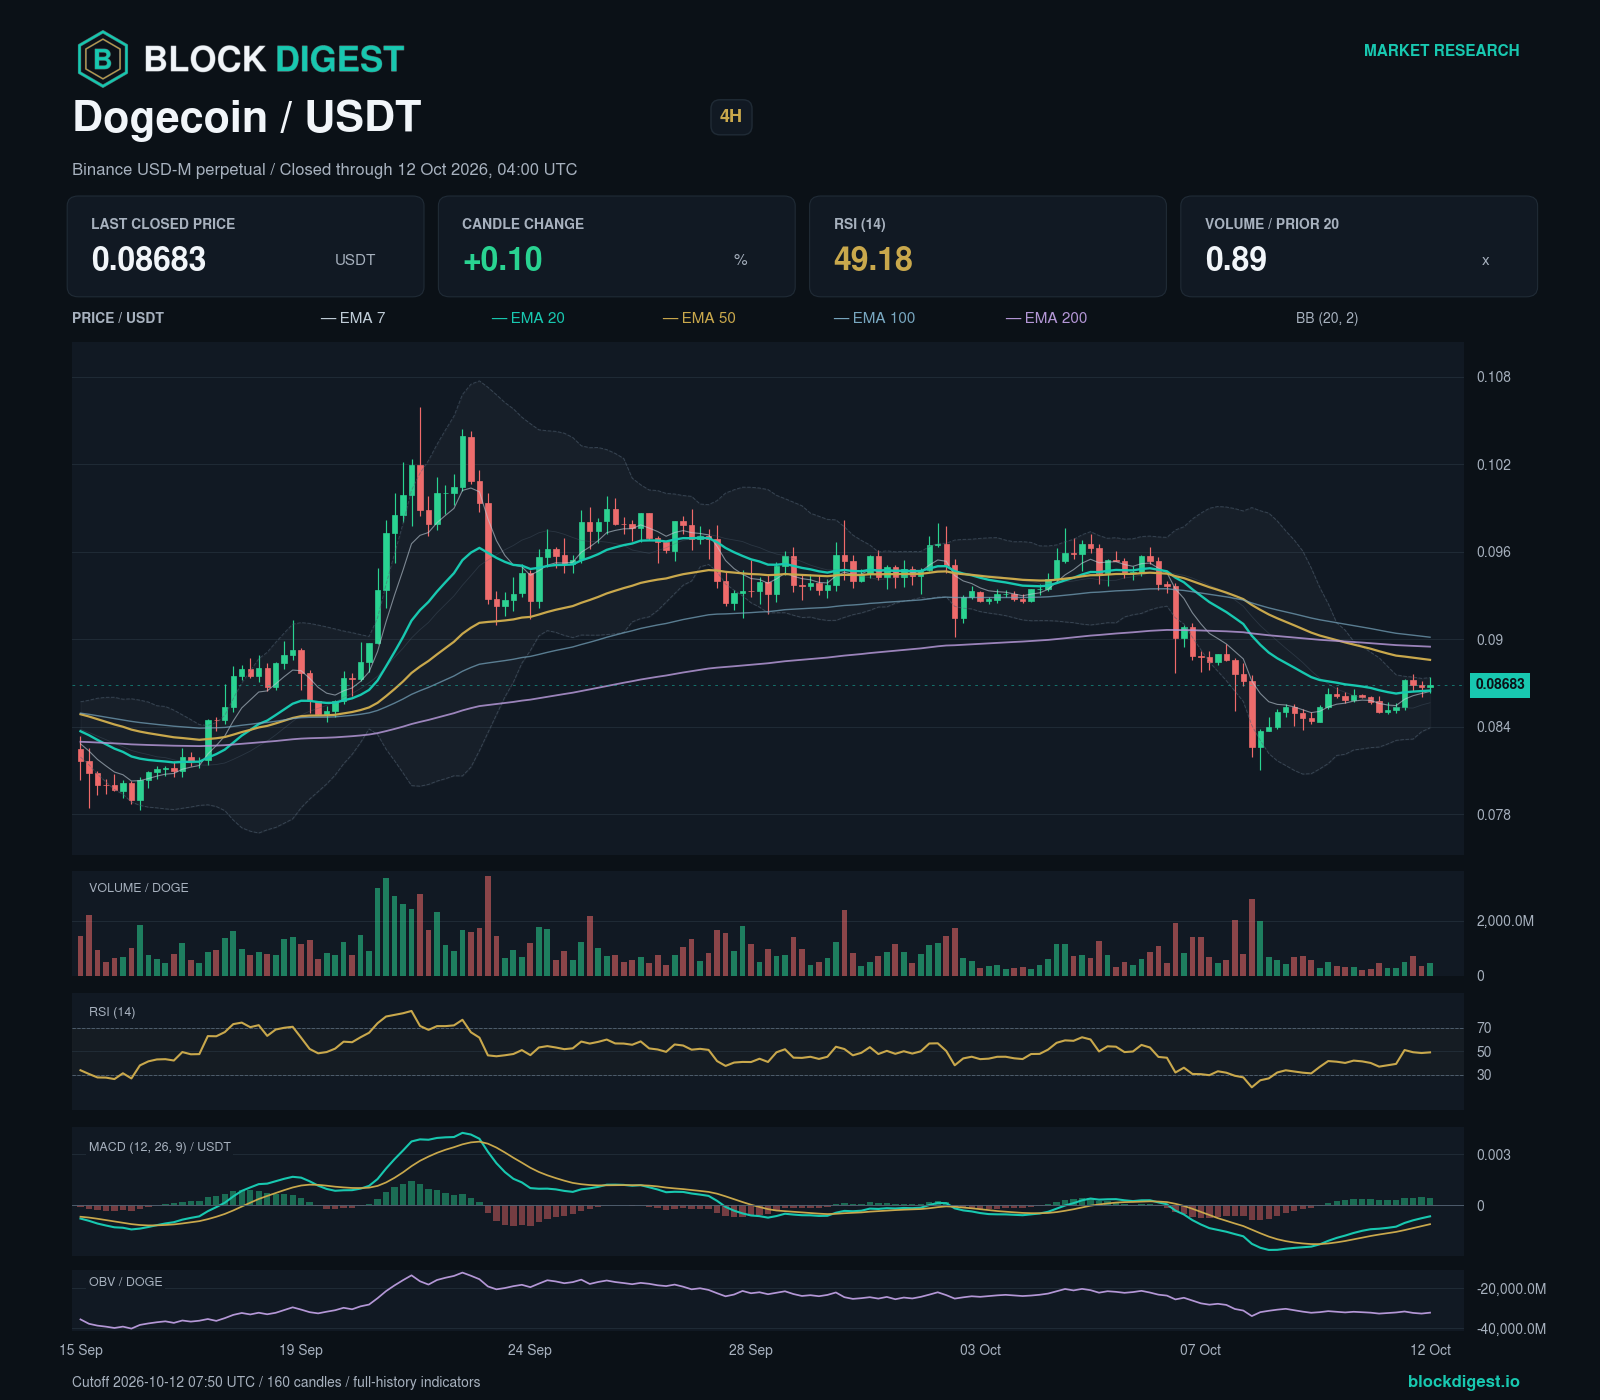
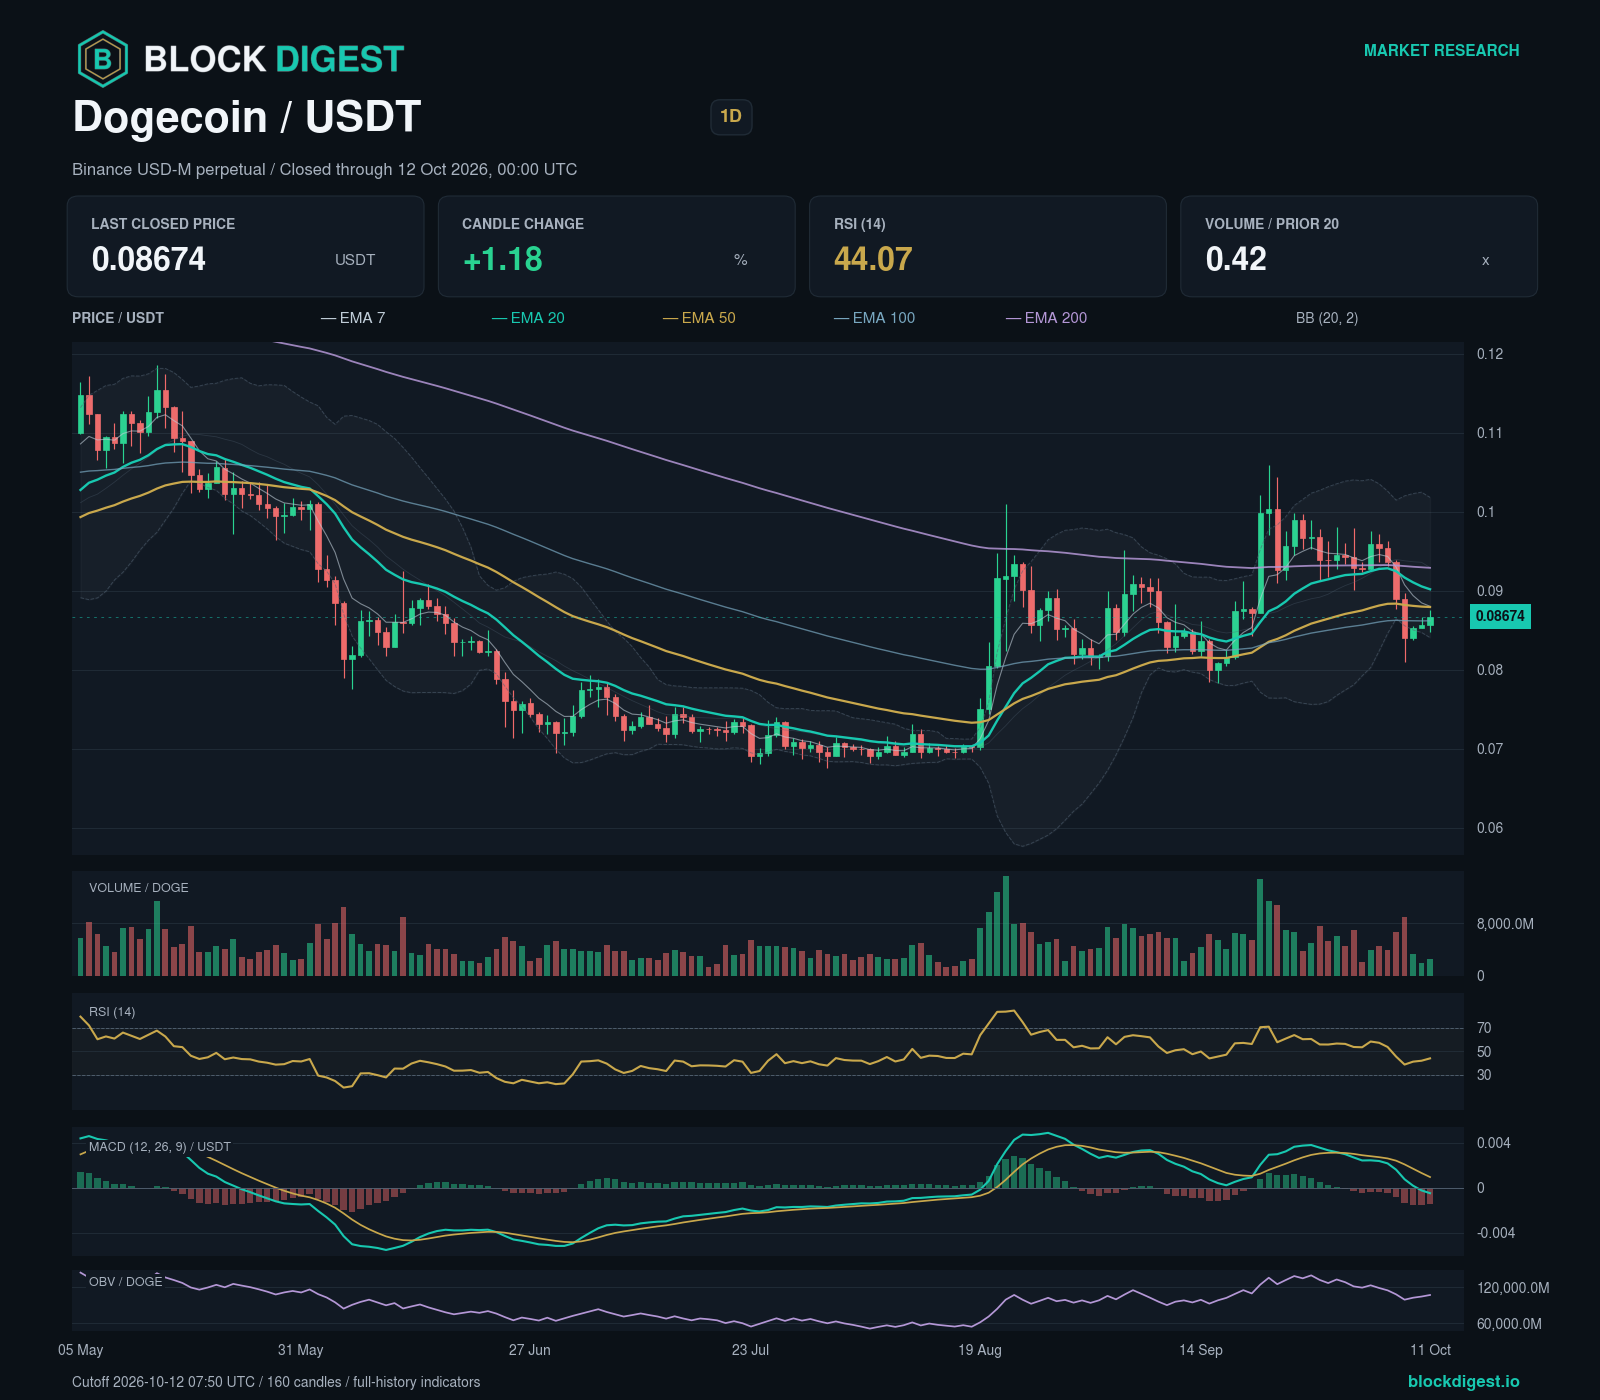
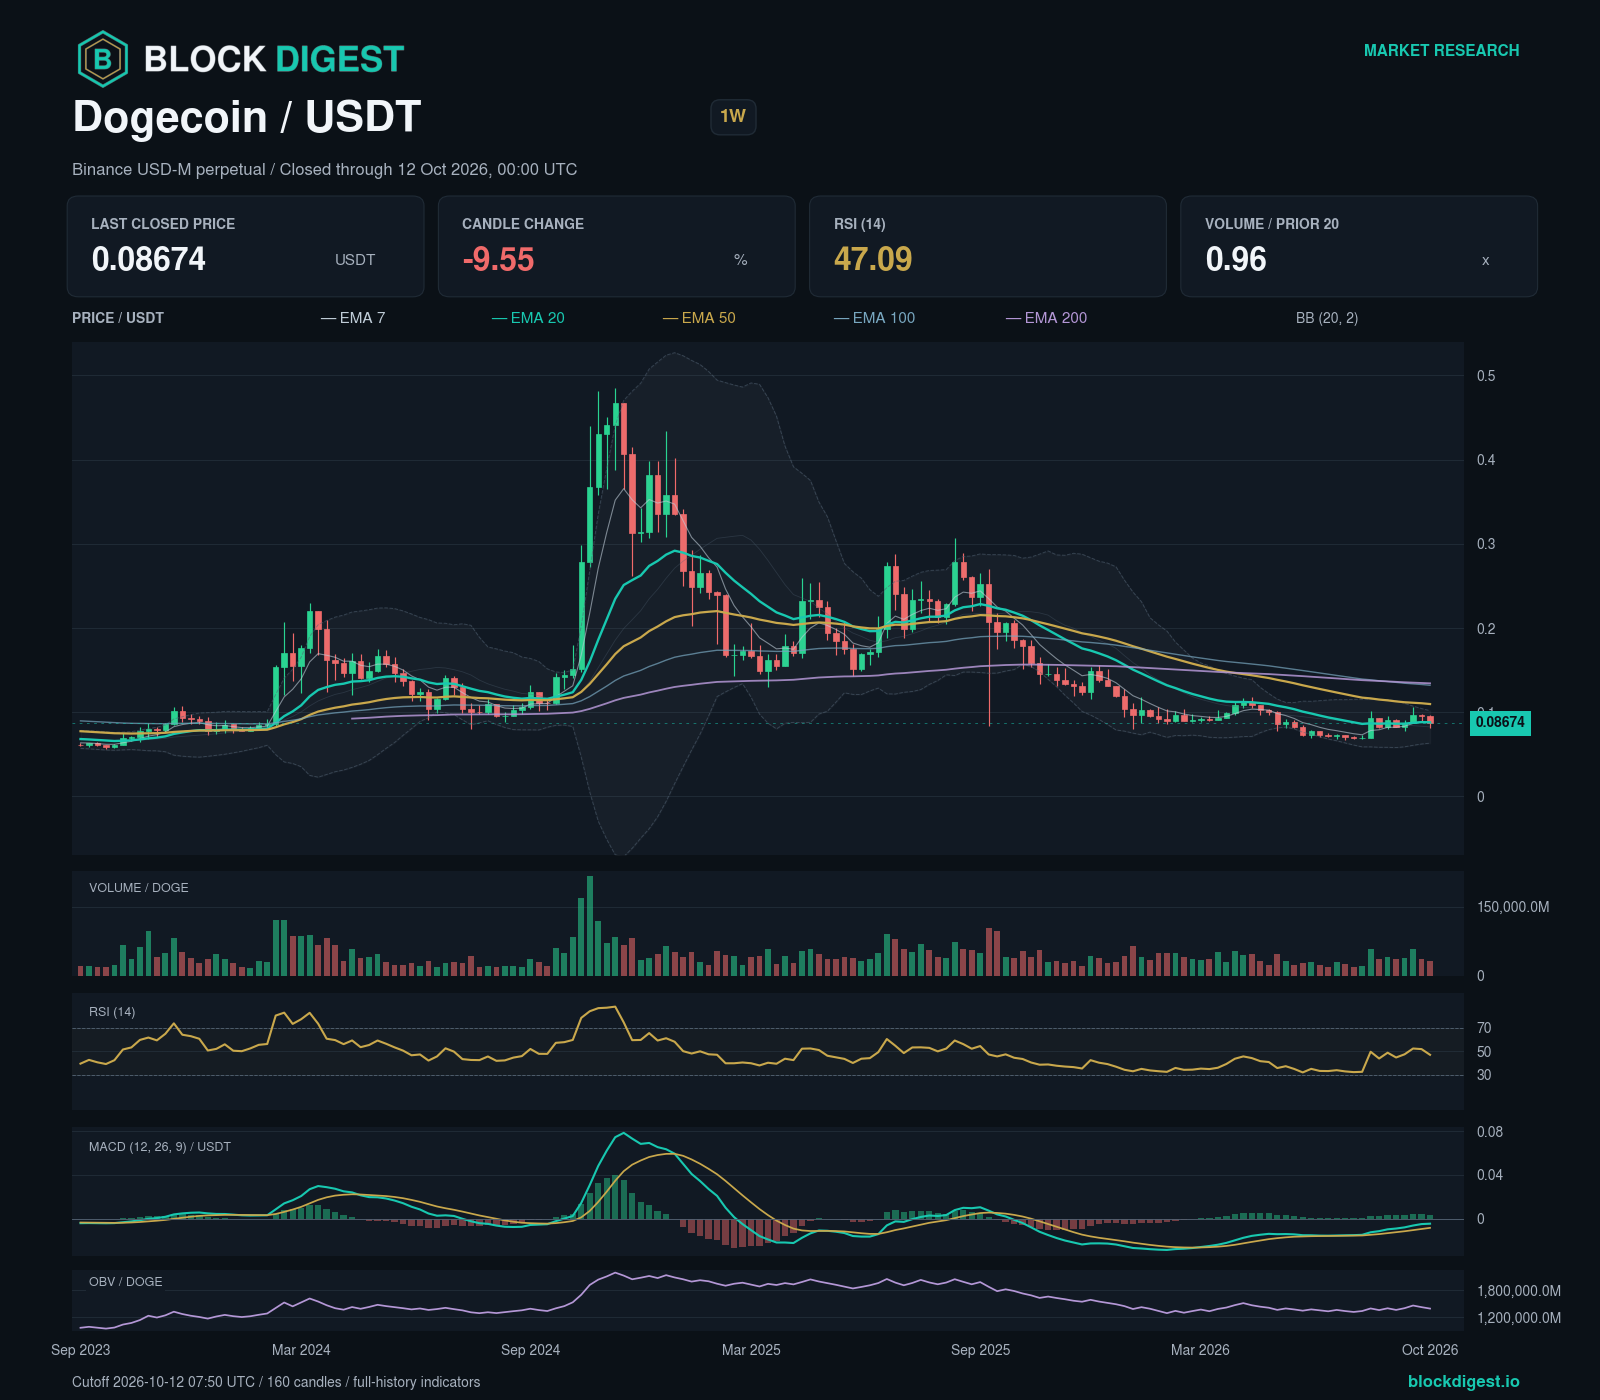
Dogecoin’s daily chart shows lower confirmed swing highs and lower swing lows, giving a bearish structural assessment. Both the weekly and four-hour charts show higher confirmed swing highs and higher swing lows.
The latest completed four-hour candle closed at 0.08683 USDT, for the period ending 2026-10-12 04:00 UTC.
Daily RSI is 44.07; the MACD histogram is -0.0014392556 USDT. MACD sits below its signal line, describing momentum without confirming a change in swing structure. Daily volume was 0.42 times its preceding 20-day baseline. OBV rose over three daily bars. The volatility regime is normal.
Bullish scenario: A completed daily candle closing above 0.08762 USDT after the cutoff confirms the condition; a completed daily candle closing below 0.081453172 USDT invalidates it. This is a break above the last completed daily high. The reference is an observed candle extreme, not a confirmed swing pivot. The trigger lies within the structural zone at 0.087153172 USDT–0.088566828 USDT. A qualifying close can still be inside this zone, leaving its upper boundary at 0.088566828 USDT uncleared. The next mapped zones are 0.089433172 USDT–0.090986828 USDT; 0.094473172 USDT–0.095886828 USDT.
Bearish scenario: A completed daily candle closing below 0.081453172 USDT after the cutoff confirms the condition; a completed daily candle closing above 0.08762 USDT invalidates it. The trigger lies within the structural zone at 0.080313172 USDT–0.081726828 USDT. A qualifying close can still be inside this zone, leaving its lower boundary at 0.080313172 USDT uncleared. The next mapped zones are 0.079203172 USDT–0.080796828 USDT; 0.076903172 USDT–0.078986828 USDT.
Confidence in the directional assessment is low because the daily and weekly swing trends point in opposite directions and the four-hour swing structure opposes the daily trend.
Litecoin (LTC)
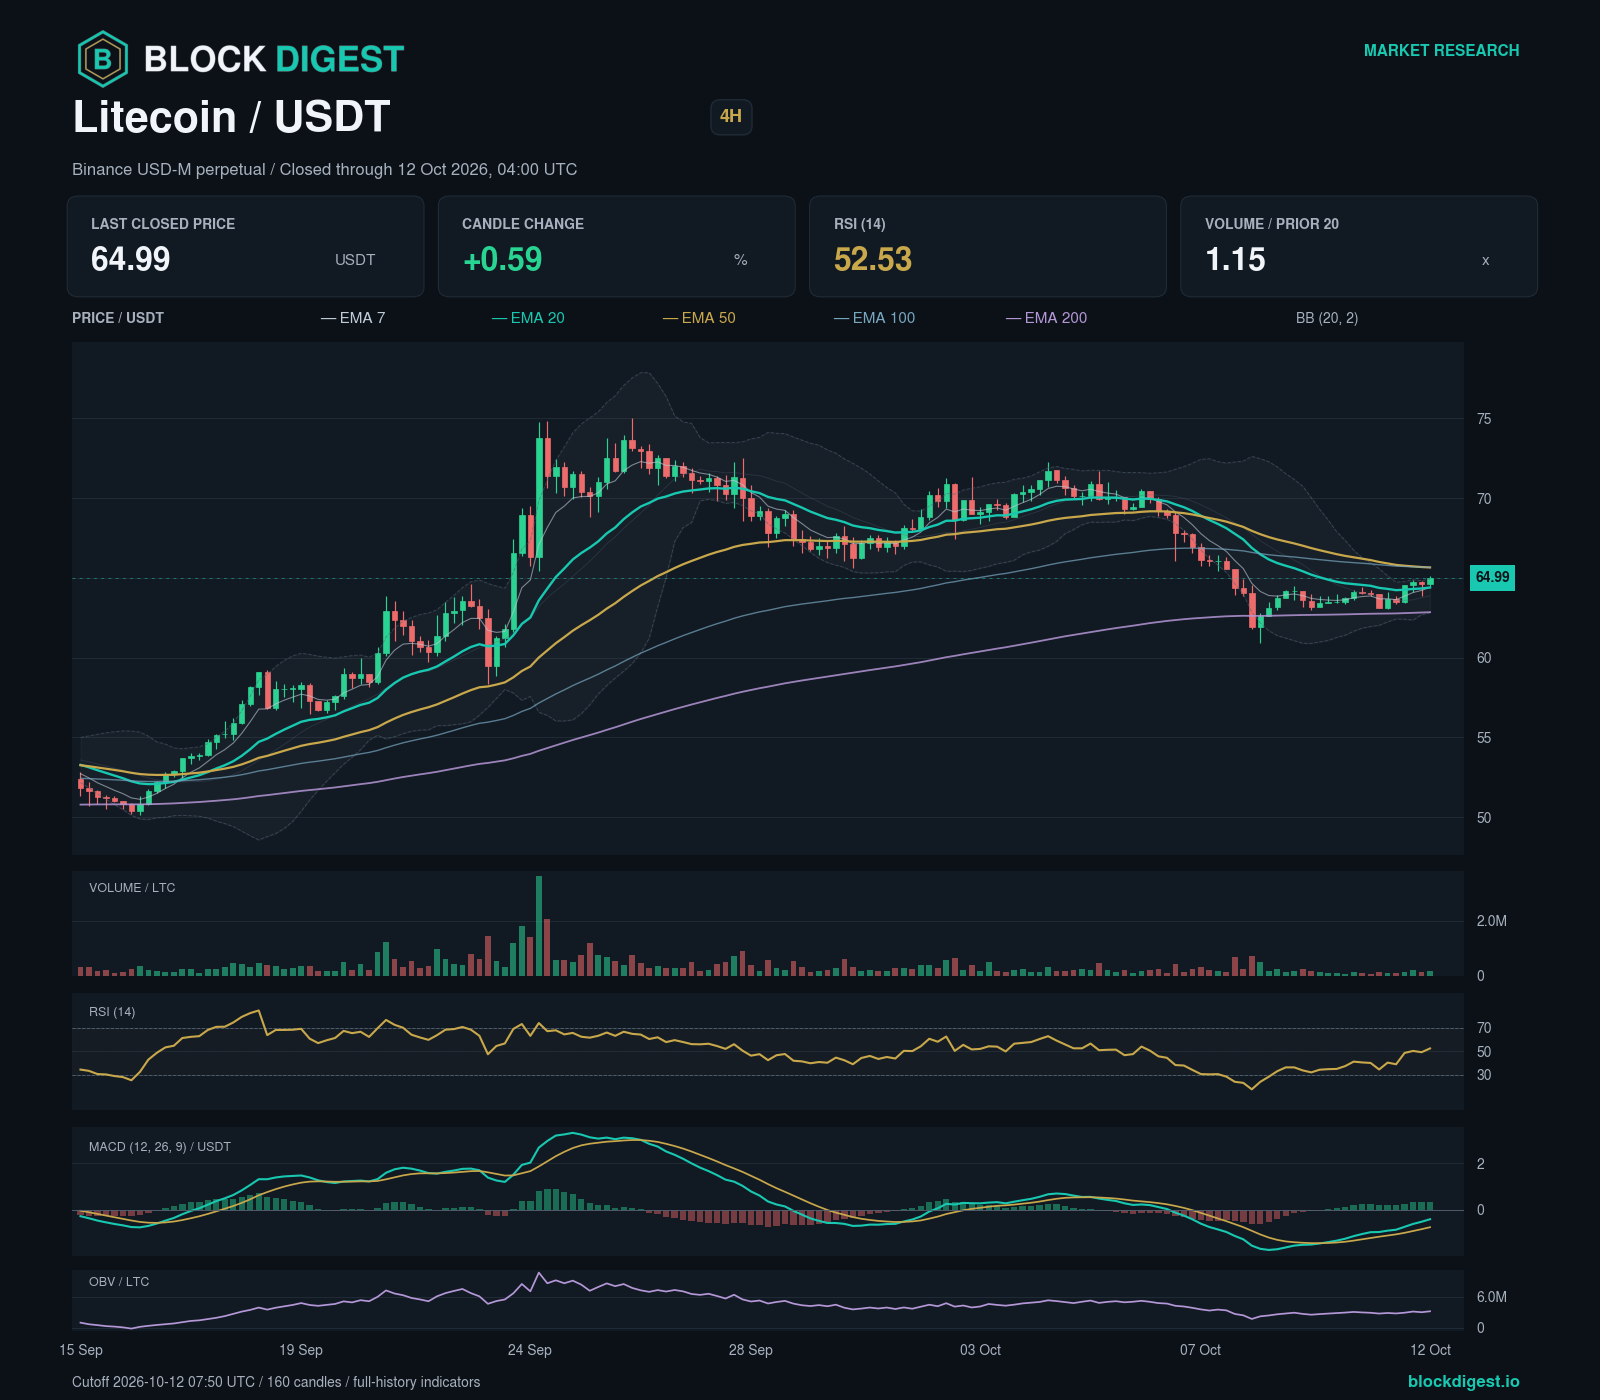
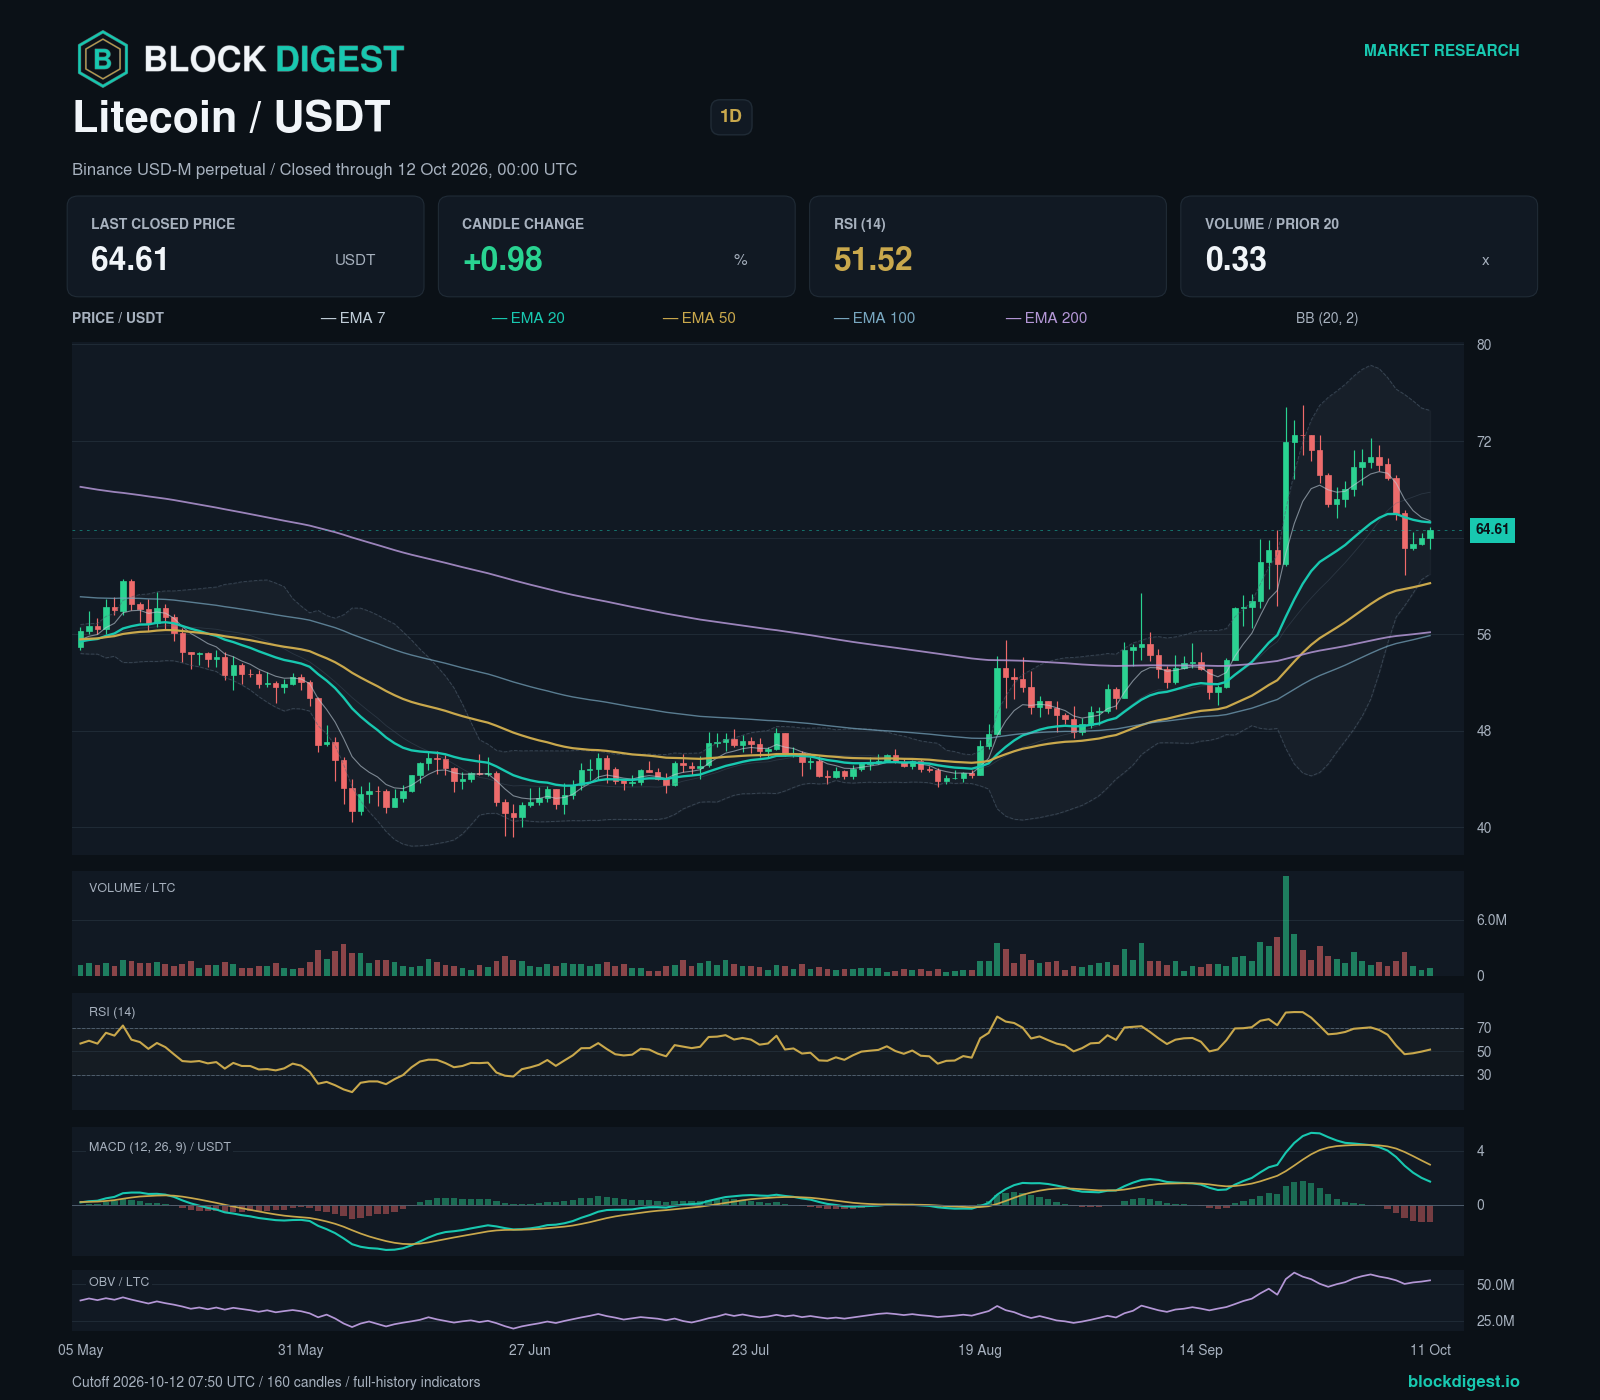
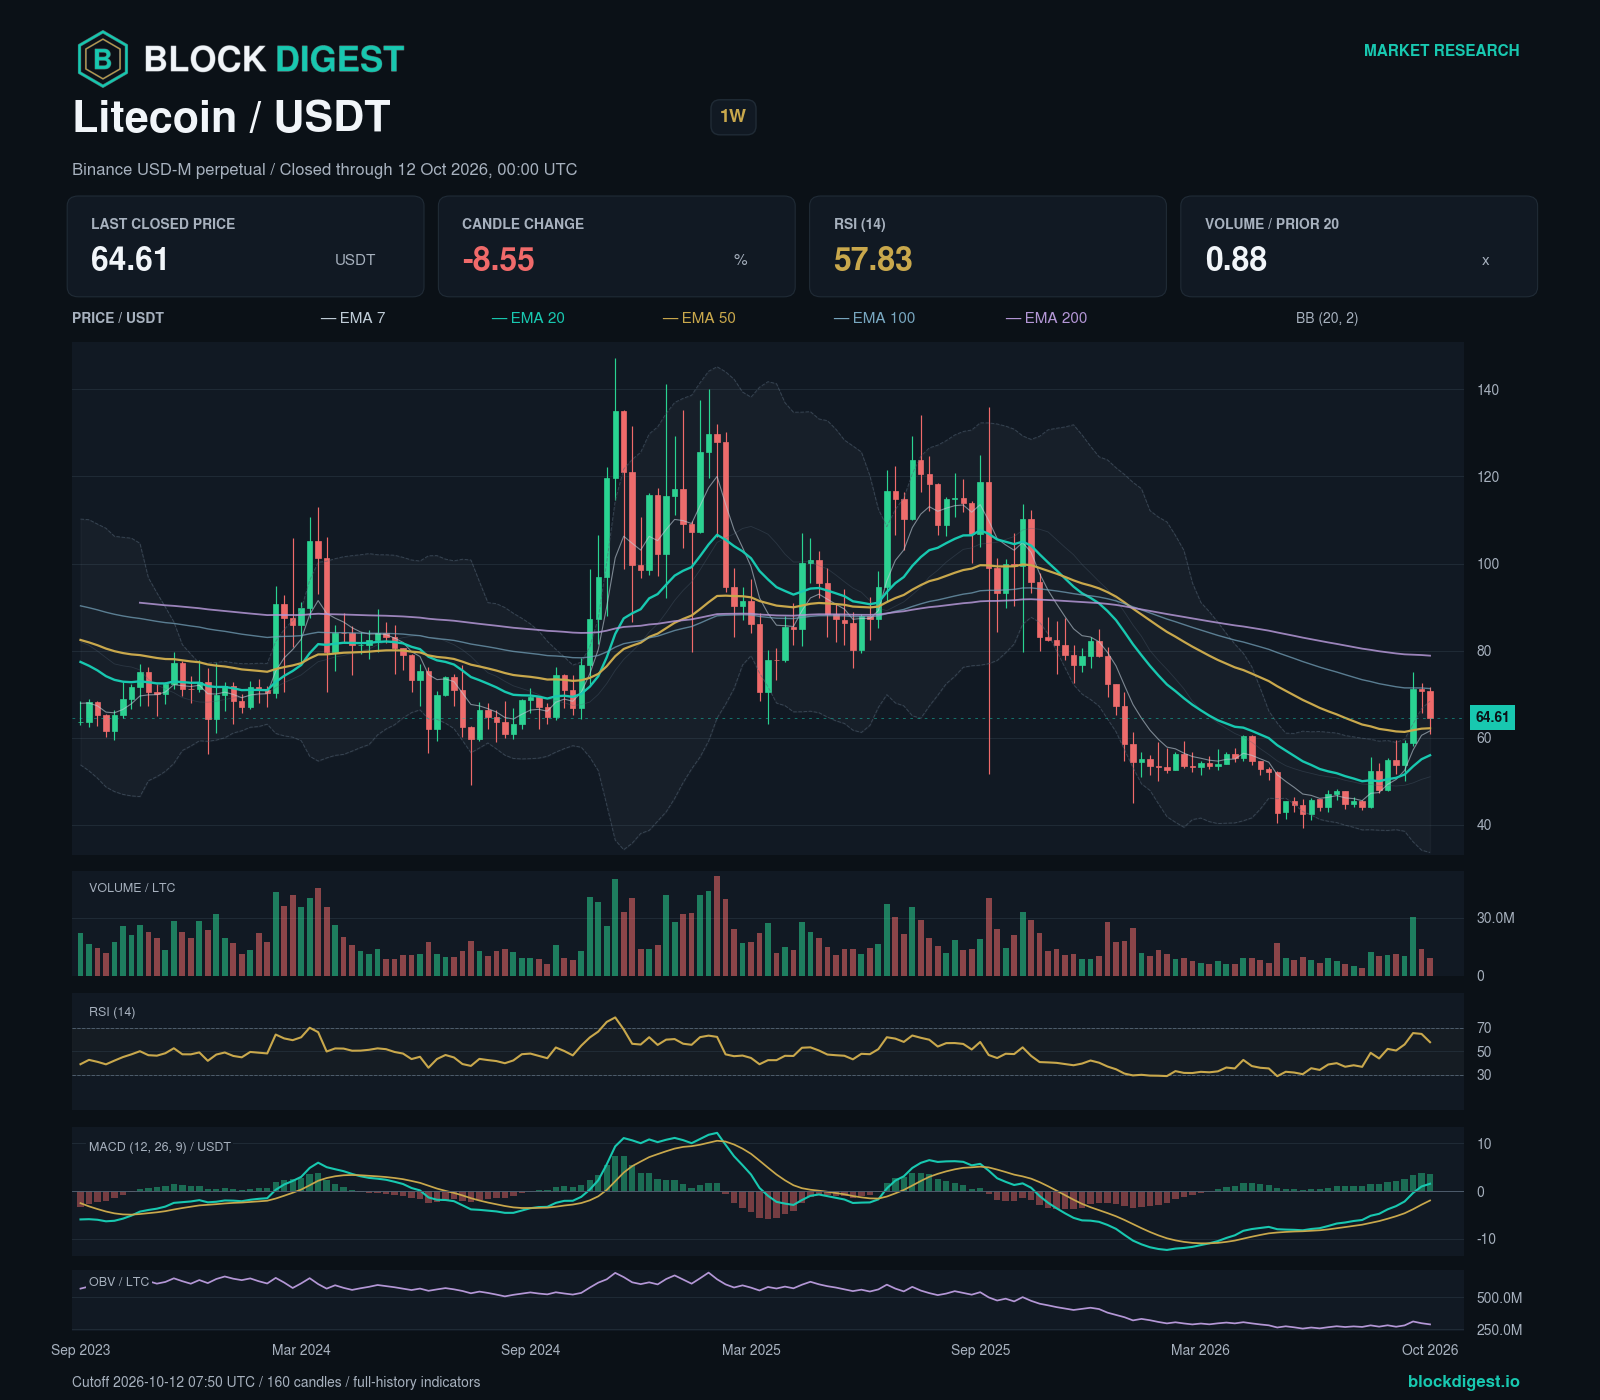
Litecoin’s daily chart shows lower confirmed swing highs and lower swing lows, giving a bearish structural assessment. The weekly chart shows higher confirmed swing highs and higher swing lows; the four-hour chart shows a close above the latest high of its previous lower-high, lower-low sequence, without a confirmed higher-high, higher-low sequence yet.
The latest completed four-hour candle closed at 64.99 USDT, for the period ending 2026-10-12 04:00 UTC.
Daily RSI is 51.52; the MACD histogram is -1.249313 USDT. MACD is still above zero, though below its signal line. Daily volume was 0.33 times its preceding 20-day baseline. OBV rose over three daily bars. The volatility regime is normal.
Bullish scenario: A completed daily candle closing above 66.042163 USDT after the cutoff confirms the condition; a completed daily candle closing below 60.107837 USDT invalidates it. The next mapped zones are 71.257837 USDT–72.162163 USDT; 74.537837 USDT–75.442163 USDT.
Bearish scenario: A completed daily candle closing below 60.107837 USDT after the cutoff confirms the condition; a completed daily candle closing above 66.042163 USDT invalidates it. The next mapped zones are 58.547837 USDT–59.862163 USDT; 54.787837 USDT–55.942163 USDT.
Confidence in the directional assessment is low because the daily and weekly swing trends point in opposite directions.
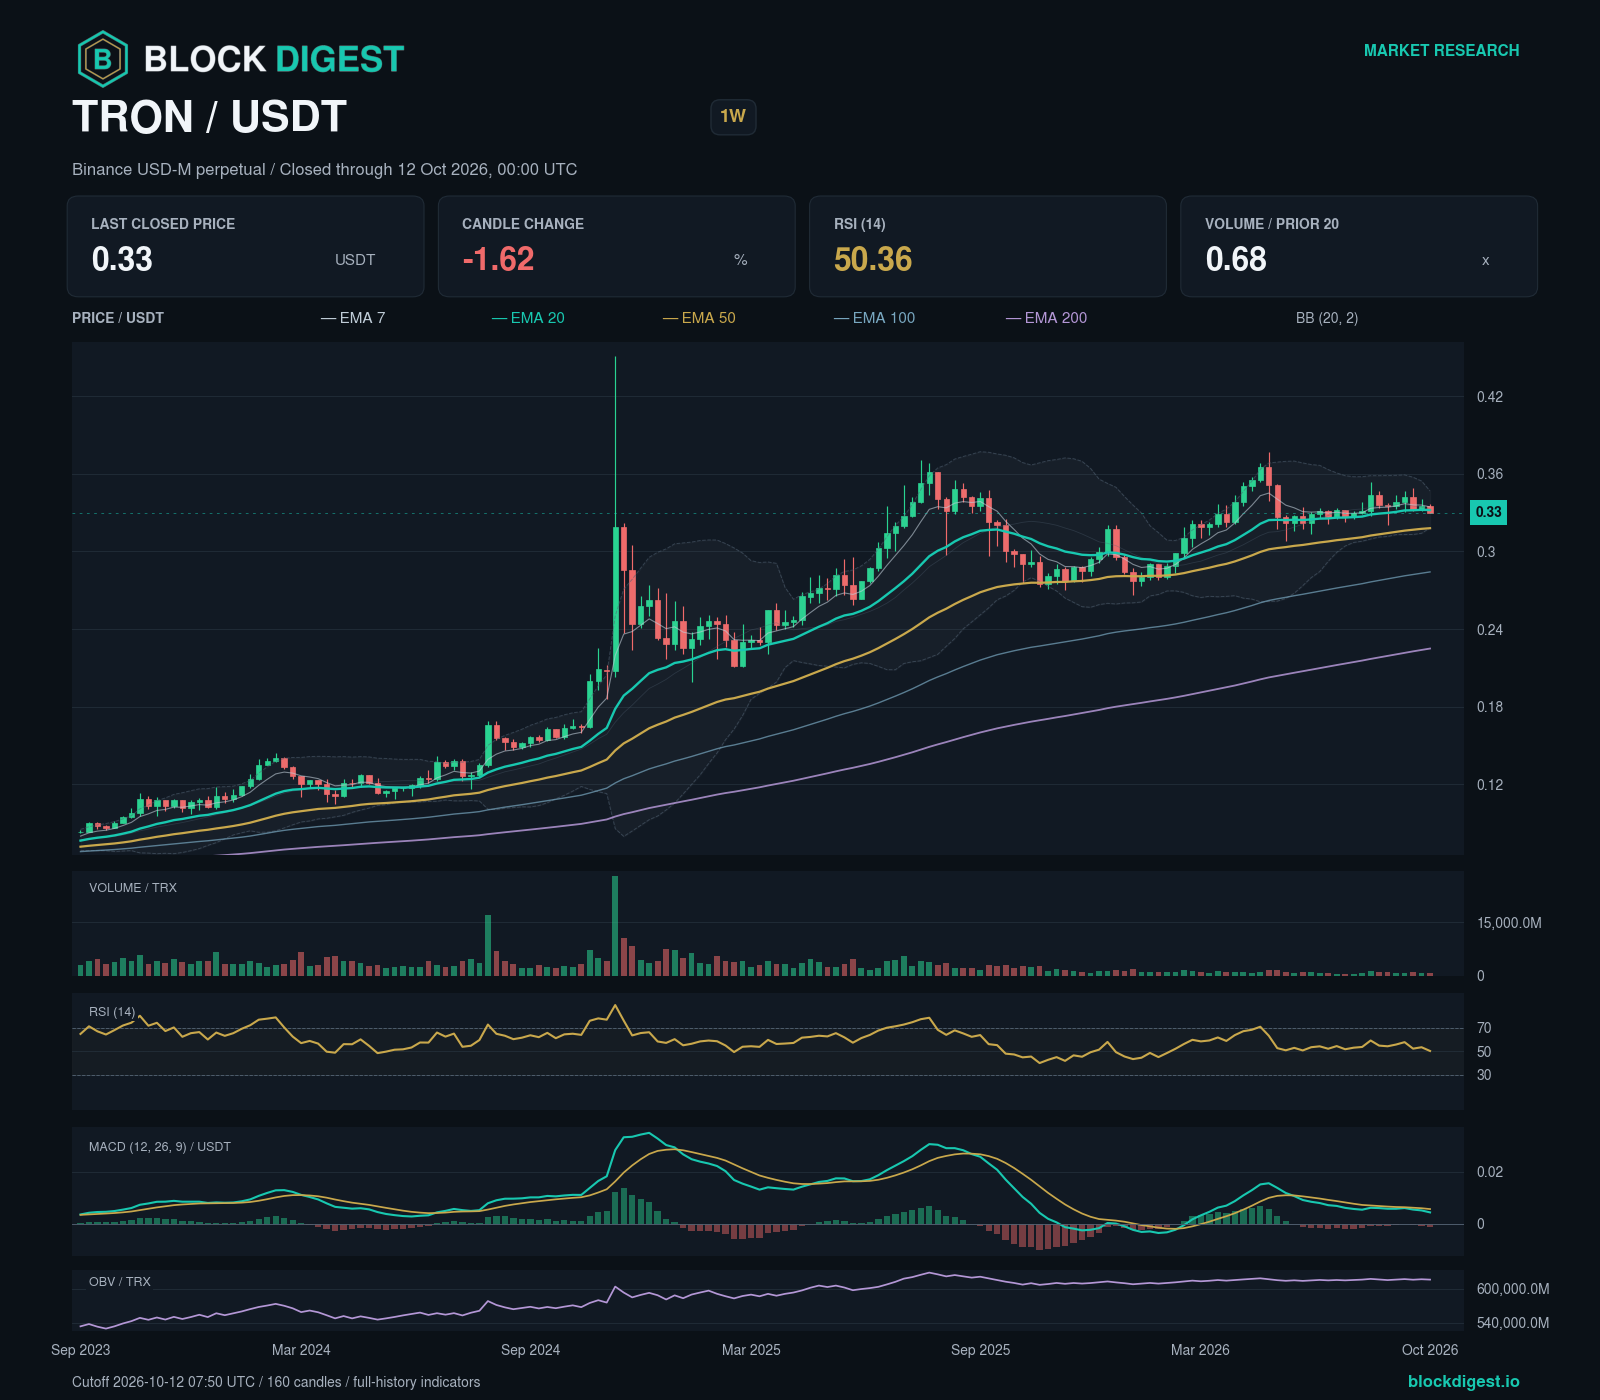
TRON (TRX)
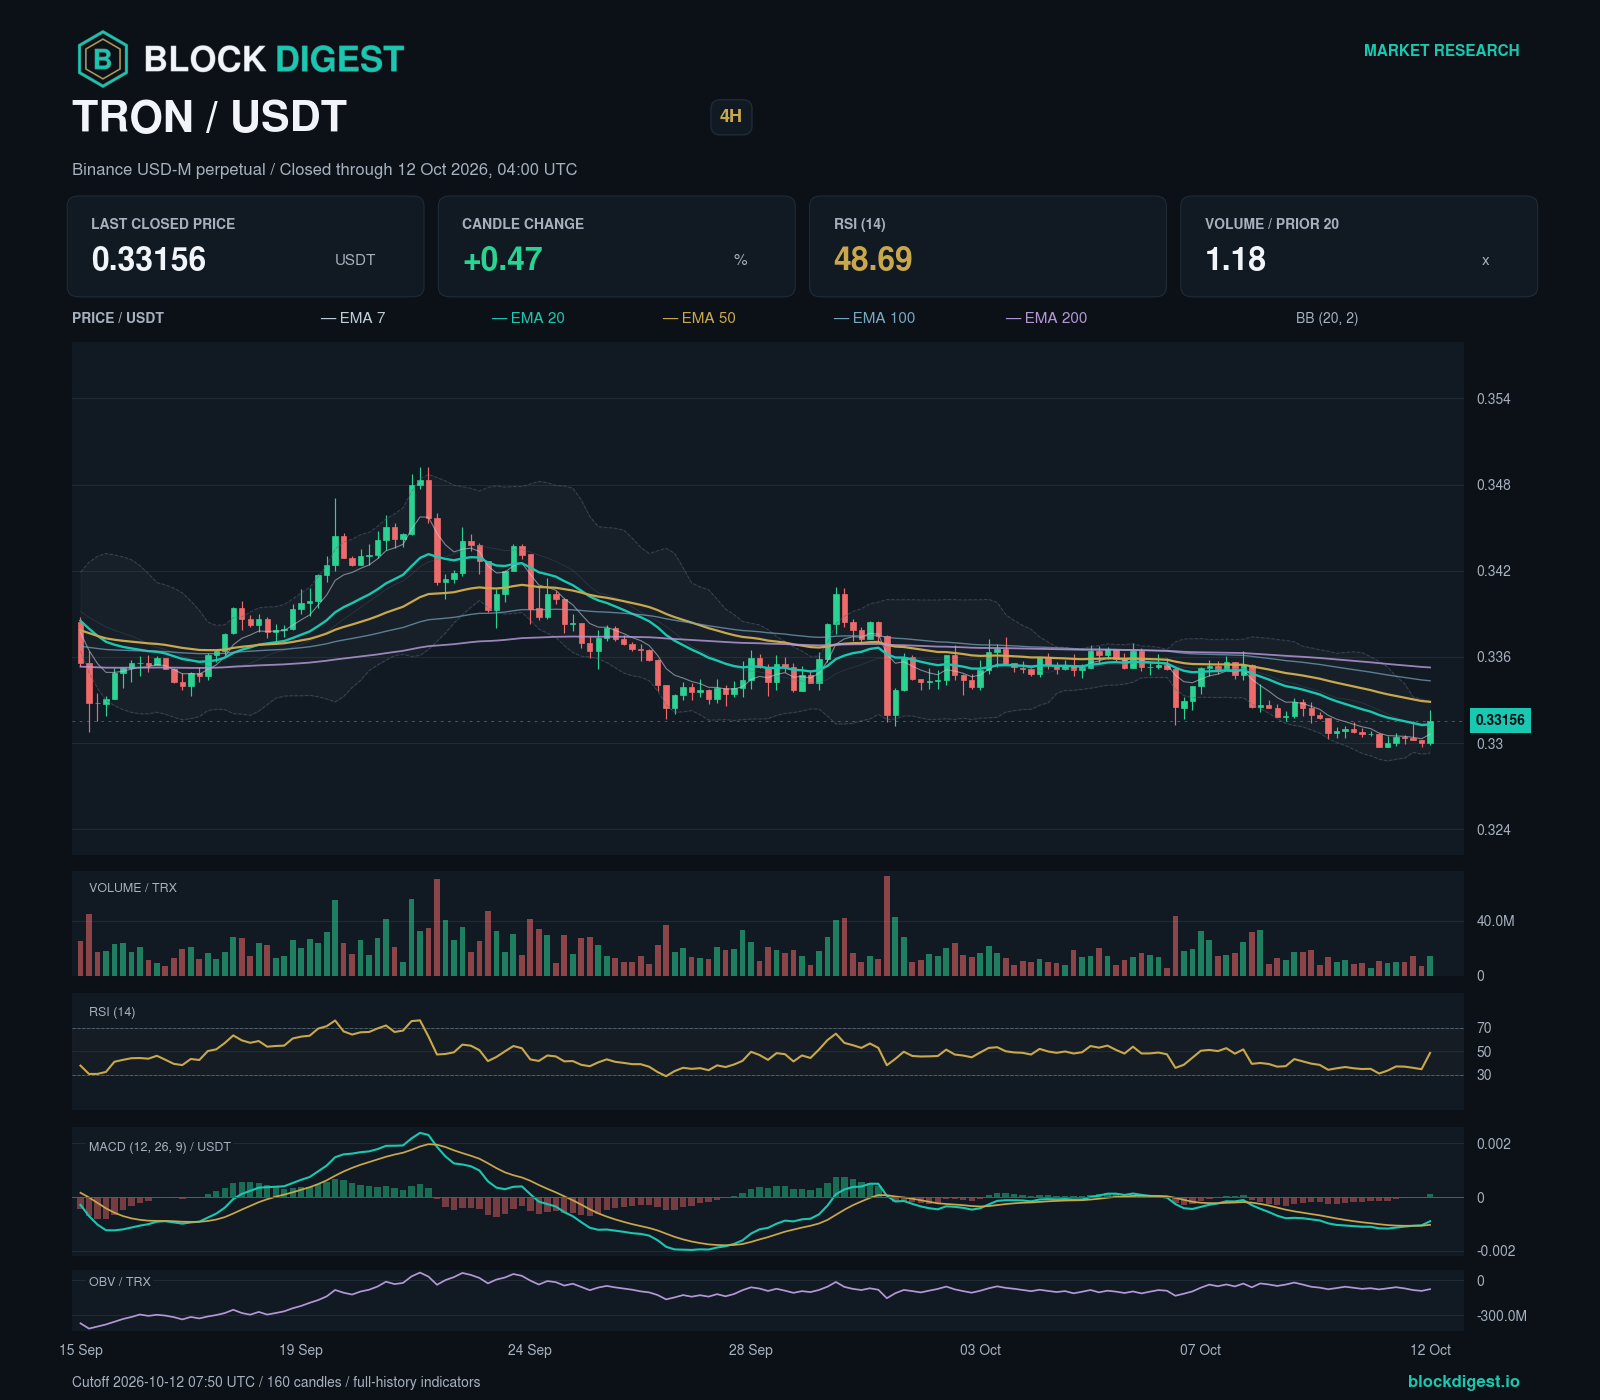
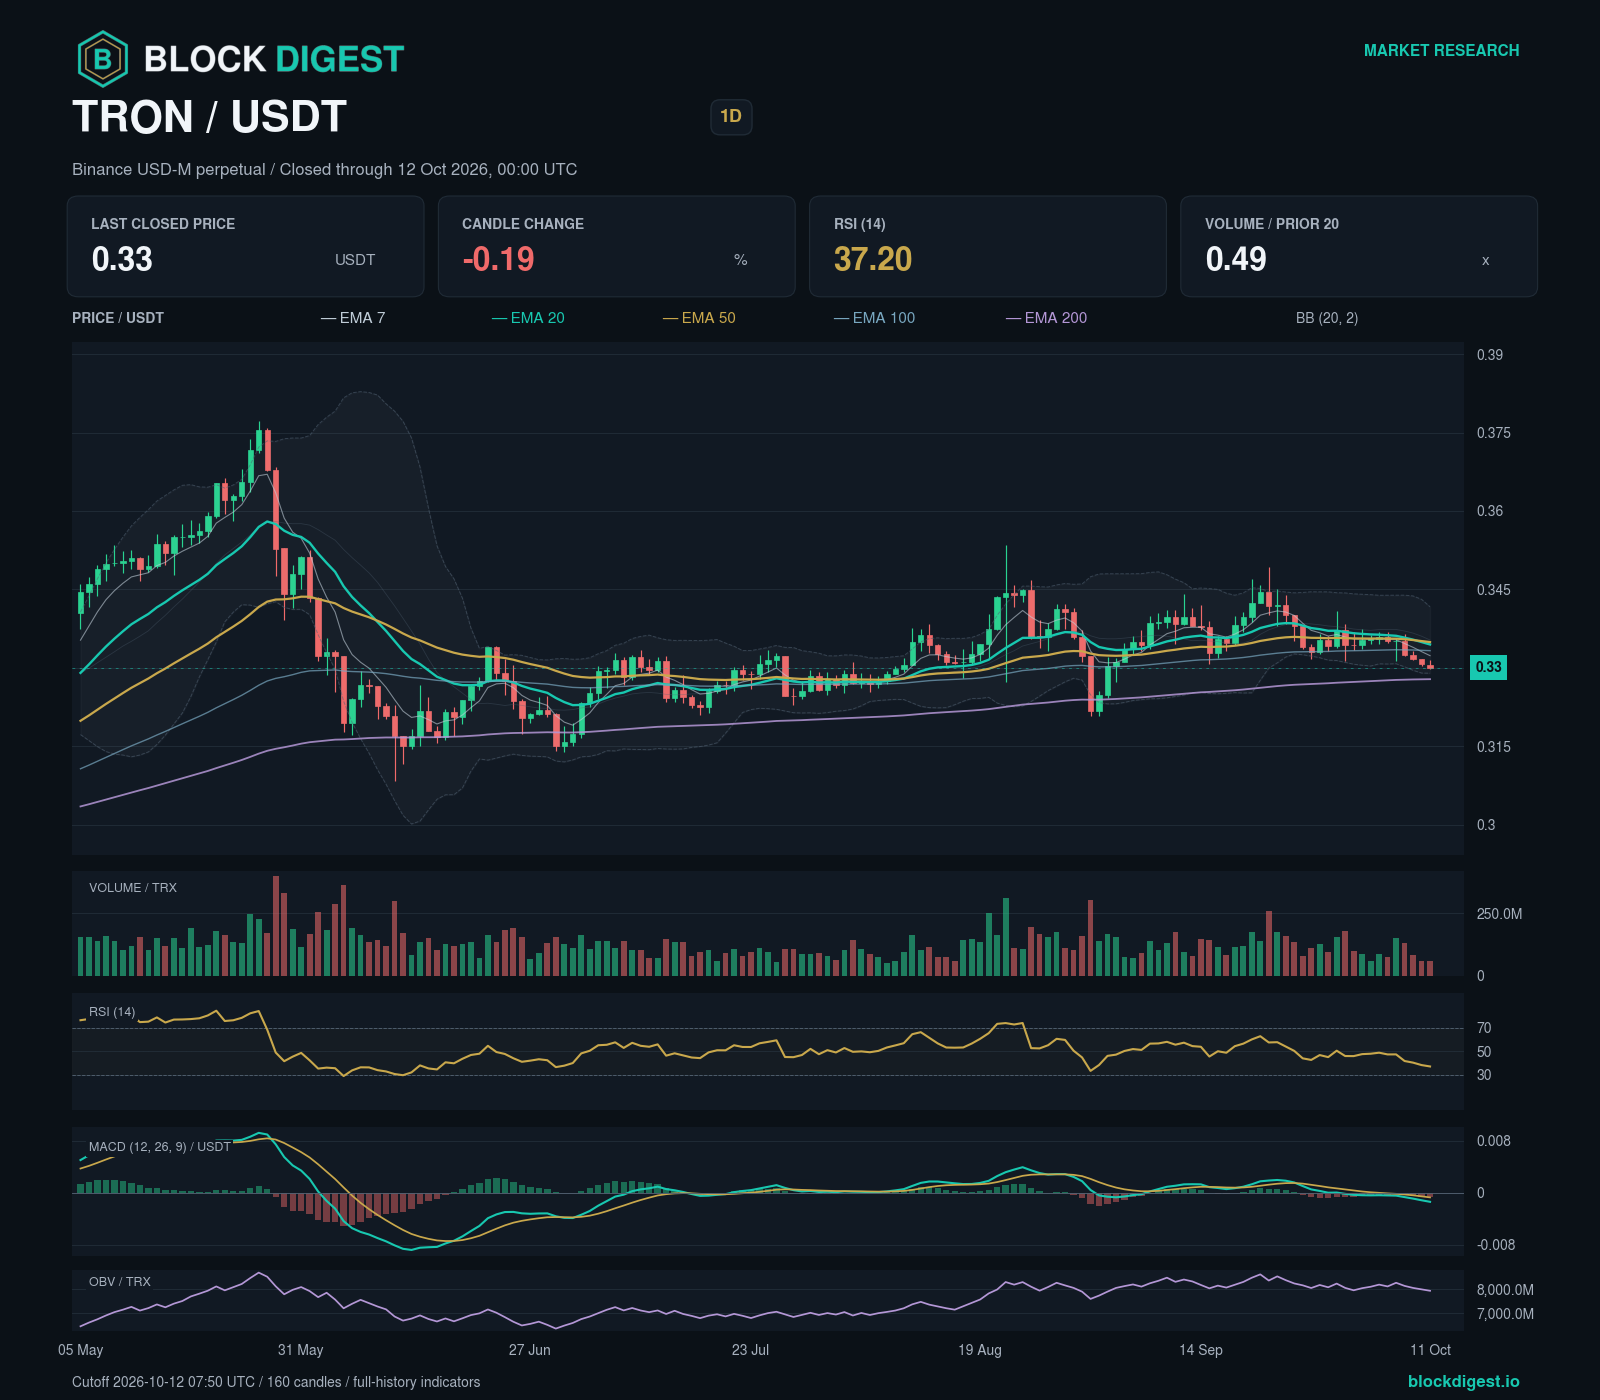
TRON’s daily chart shows a close below the latest confirmed swing low, without a completed lower-high, lower-low sequence yet, giving a neutral structural assessment. The weekly chart shows a mixed sequence of confirmed swing highs and lows; the four-hour chart shows a close above the latest high of its previous lower-high, lower-low sequence, without a confirmed higher-high, higher-low sequence yet.
The latest completed four-hour candle closed at 0.33156 USDT, for the period ending 2026-10-12 04:00 UTC.
Daily RSI is 37.20; the MACD histogram is -0.00067772428 USDT. MACD sits below its signal line, describing momentum without confirming a change in swing structure. Daily volume was 0.49 times its preceding 20-day baseline. OBV fell over three daily bars. The volatility regime is normal.
Bullish scenario: A completed daily candle closing above 0.3338167 USDT after the cutoff confirms the condition; a completed daily candle closing below 0.3291233 USDT invalidates it. The trigger lies within the structural zone at 0.3335133 USDT–0.3350667 USDT. A qualifying close can still be inside this zone, leaving its upper boundary at 0.3350667 USDT uncleared. The next mapped zones are 0.3363533 USDT–0.3375267 USDT; 0.3378333 USDT–0.3390067 USDT.
Bearish scenario: A completed daily candle closing below 0.3291233 USDT after the cutoff confirms the condition; a completed daily candle closing above 0.3338167 USDT invalidates it. The next mapped zones are 0.3266133 USDT–0.3277867 USDT; 0.3238833 USDT–0.3250567 USDT.
Confidence in the directional assessment is low because the daily swing sequence has not established a confirmed directional trend.
Altcoin Outlook
TRX’s strongest BTC-relative gain among the covered coins has not resolved its daily swing structure. The relevant daily closing conditions remain the checkpoints for a directional move; the trailing return alone does not supply that confirmation.
For SOL, DOGE, LTC, opposing daily and weekly swing trends remain a key qualification. The scenarios retain their specified daily-close tests; confirmation on that horizon does not automatically resolve the weekly conflict.
TRX gained against BTC in the completed seven-day perpetual-price ratio comparison.
SOL, XRP, BNB, DOGE, LTC lost ground to BTC on the same basis.
These relative moves describe the observed window. Stronger past returns do not establish a better forward setup; each coin’s structural thesis, counter-evidence and closing conditions still matter.
Each scenario lasts seven days from the analysis cutoff and requires a completed daily close, not an intraday touch. A confirming close may already be inside or beyond a target zone; only zones still ahead remain prospective checkpoints. If none remain, a fresh assessment is needed. Overlapping bands are not independent targets, and older zones are context rather than a forecast for this week.
Data notes. Common analysis cutoff: 2026-10-12T07:50:03.107+00:00. Prices and volume come from Binance USDT perpetual futures. The basket is fixed at SOL, XRP, BNB, DOGE, LTC and TRX. Confidence grades are uncalibrated qualitative assessments, not probabilities.
Source correction — XRP. Weekly base volume for the period(s) starting 2023-09-04 UTC was reconstructed from seven validated daily bars. OHLC and the other four aggregate fields matched the provider’s weekly candle exactly; the inconsistent original and supporting observations are archived.
Disclaimer: This analysis is for informational purposes only and does not constitute financial advice. Cryptocurrency markets are highly volatile and unpredictable. All trading decisions should be made based on your own research and risk tolerance. Block Digest is not responsible for any financial losses incurred as a result of acting on this content.
Stay Ahead of the Market
Follow BlockDigest for crypto market intelligence, research and real-time updates.